
Water resources class 12 Geography Chapter 4 comes from the NCERT book India: People and Economy and spans about twelve printed pages. It covers India’s water endowment, its uneven distribution, who consumes it, and the conservation toolkit of watershed management and rainwater harvesting. The official chapter PDF is below; the rest of the page explains its numbers, maps, definitions, policies and exercises.
Download the NCERT Class 12 Geography Chapter 4 Water Resources PDF
This is the exact chapter file NCERT publishes, not a summary or a third-party scan.
Open the official NCERT Class 12 Geography Chapter 4 Water Resources PDF from ncert.nic.in — it is the complete chapter as printed in the current NCERT edition of India: People and Economy, including all maps, figures and the closing exercises.
| What the chapter holds | Count | Where it is used |
|---|---|---|
| Printed pages | 12 | |
| Figures with NCERT captions | 9 | |
| Exercise questions | 3 | answered in our NCERT Solutions |
| Activities | 3 | |
| Official NCERT PDF | Download the chapter PDF | the chapter exactly as NCERT publishes it |
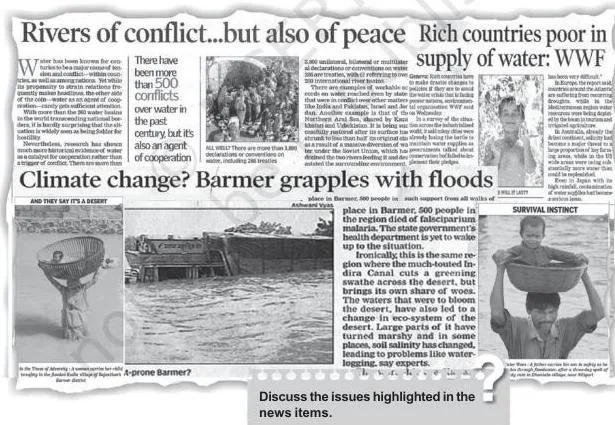

What is inside Chapter 4 Water Resources
This table maps the chapter’s structure so you know where each idea sits before you open the file. The chapter builds one continuous argument: how much water India has, where it sits, who uses it, what is going wrong, and what is being done about it.
| Chapter section (as NCERT names it) | What it covers |
|---|---|
| Opening: Water Resources | Water as a cyclic resource; only about 3 per cent of the earth’s water is freshwater; disputes over sharing water among communities, regions and states |
| Water Resources of India | India’s shares of world area, water and population; the 4,000, 1,869 and 1,122 cubic km chain |
| Surface Water Resources | Rivers, lakes, ponds and tanks; about 10,360 rivers and tributaries; why only 32 per cent of surface flow is usable; the Ganga–Brahmaputra–Barak concentration |
| Groundwater Resources | 432 cubic km of replenishable groundwater; high, moderate and low utilisation states |
| Lagoons and Backwaters | Brackish coastal water bodies of Kerala, Odisha and West Bengal |
| Water Demand and Utilisation | Irrigation’s 89 and 92 per cent shares; multipurpose river valley projects |
| Demand of Water for Irrigation | Monsoon variability, the green revolution, wells and tubewells, fluoride and arsenic contamination |
| Pradhan Mantri Krishi Sinchayee Yojana (PMKSY) | The 2026-27 scheme for assured irrigation and water-use efficiency |
| Emerging Water Problems and Deterioration of Water Quality | Pollution sources, CPCB monitoring at 507 stations, the most polluted river stretches |
| Water Conservation and Management | Prevention of pollution, recycle and reuse, conjunctive use of surface and groundwater |
| Watershed Management, with Ralegan Siddhi | Definition, Haryali, Atal Jal, Neeru-Meeru, Arvary Pani Sansad, and the case study |
| Rainwater Harvesting | Methods, Kund and Tanka structures, benefits of recharge |
| National Water Policy 2012 and Jal Kranti Abhiyan | The policy framework and the 2026-27 awareness campaign |
| Exercises | MCQs, 30-word answers and 150-word answers on the whole chapter |
India’s water budget: the numbers the whole chapter hangs on
This section separates the four water figures students routinely mix up. Learn them as one chain — each number is the previous one shrunk by a specific constraint.
India holds about 2.45 per cent of the world’s surface area and 4 per cent of its water resources, but more than 17 per cent of the world’s population. The chain below explains why abundant rainfall does not remove that mismatch.
| Figure | What it counts | Where it comes from |
|---|---|---|
| 4,000 cubic km | Total water from precipitation in India in a year | The chapter’s starting figure |
| 1,869 cubic km | Surface water plus replenishable groundwater | The availability that remains from precipitation |
| 1,122 cubic km | Total utilisable water | 60 per cent of 1,869 — the most that can be put to beneficial use |
| 690 cubic km | Utilisable surface water | 32 per cent of surface flow; the rest is blocked by topographical and hydrological constraints |
| 432 cubic km | Replenishable groundwater | The rechargeable portion of the groundwater stock |
The chain matters because answers that quote 4,000 cubic km as usable water are wrong. Only 60 per cent of the 1,869 cubic km can be put to beneficial uses, which gives the 1,122 cubic km figure. The monsoon’s concentration in a few months, the shape of the land and the behaviour of the rivers all cut the usable share sharply.
Surface water and groundwater: where India’s water sits
This section places the water on a map: which basins hold it, and which states are drawing it down fastest.
River basins hold most of the surface water
The chapter names four sources of surface water: rivers, lakes, ponds and tanks. India has about 10,360 rivers and tributaries longer than 1.6 km each, and the flow in a river depends on the size of its catchment area and the rainfall within that catchment.
The decisive fact is the Ganga–Brahmaputra–Barak concentration: these basins cover only about one-third of the country yet carry about 60 per cent of total surface water, because their catchments receive relatively high monsoon rainfall.
The chapter refers you to Class XI India: Physical Environment for the monsoon’s spatial variation. It contrasts these basins with south Indian rivers like the Godavari, Krishna and Kaveri, whose annual flows are already largely harnessed, while the Brahmaputra and Ganga basins remain to be developed.
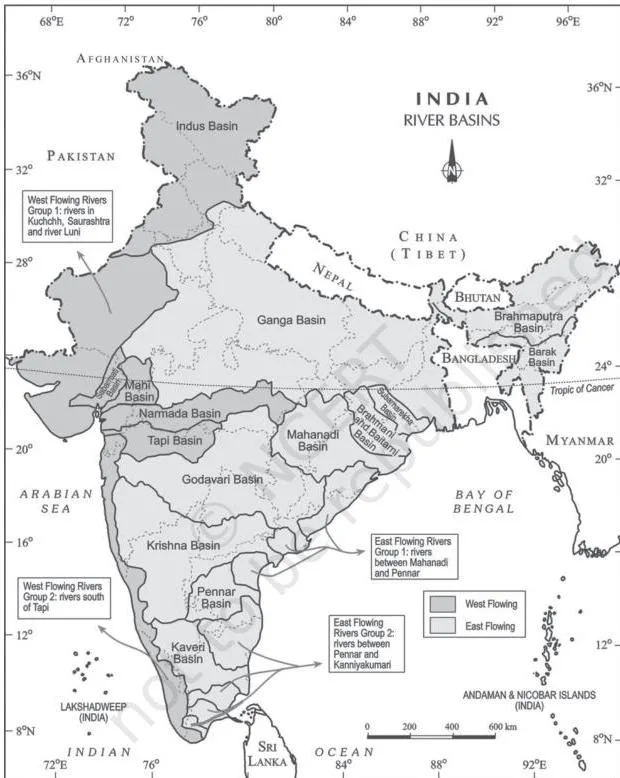
The India – River Basins map above is the visual proof of the 60-per-cent claim: the Ganga, Brahmaputra and Barak catchments together cover about one-third of the country’s area. When you are asked to describe the spatial distribution of water resources, this map plus the one-third-area and 60-per-cent figures are the core of your answer.
Groundwater: 432 cubic km that recharges
Total replenishable groundwater is about 432 cubic km. Utilisation is relatively high in the river basins of the north-western region and parts of south India, and the chapter groups the states by how hard they pump.
| Group | States | What the pattern means |
|---|---|---|
| Very high utilisation | Punjab, Haryana, Rajasthan, Tamil Nadu | Irrigated farming is draining these aquifers fastest |
| Moderate utilisation | Gujarat, Uttar Pradesh, Bihar, Tripura, Maharashtra | Groundwater is drawn at a middle rate |
| Low utilisation | Chhattisgarh, Odisha, Kerala | Only a small part of their groundwater potential is used |
The chapter adds a warning here: if the present trend continues, demand will outrun supply, which will be detrimental to development and can cause social upheaval and disruptions.
Lagoons and backwaters
Along the indented coasts of Kerala, Odisha and West Bengal, lagoons and lakes form a separate surface-water stock. The water is generally brackish, but it is used for fishing and for irrigating certain varieties of paddy and coconut.
Who uses India’s water: irrigation dominates demand
One fact drives every water problem in this chapter: farming takes nearly all of India’s water. India has traditionally been an agrarian economy, with about two-thirds of its population dependent on agriculture.
| Sector | Share of surface water | Share of groundwater |
|---|---|---|
| Agriculture | 89 per cent | 92 per cent |
| Industry | 2 per cent | 5 per cent |
| Domestic | 9 per cent | Lower than the 9 per cent surface share |
The chapter expects these shares to shift: with development, the industrial and domestic shares are likely to increase. That single sentence is the basis of exercise question 2(iii).
Why irrigation dominates
Irrigation dominates for a simple reason: rainfall in India varies sharply across space and time. Large tracts of north-western India and the Deccan plateau are drought-prone, winter and summer are dry in most of the country, and even high-rainfall states like West Bengal and Bihar face monsoon breaks.
Crops also push up demand. Rice, sugarcane and jute need heavy water, so they can be grown reliably only with irrigation. That is why the Five Year Plans gave irrigation high priority through projects like Bhakra-Nangal, Hirakud, Damodar Valley, Nagarjuna Sagar and the Indira Gandhi Canal Project.
The green revolution chain and its cost
Irrigation makes multiple cropping possible and keeps high-yielding varieties supplied with moisture. That is why the green revolution succeeded in Punjab, Haryana and western Uttar Pradesh, where more than 85 per cent of net sown area is irrigated.
The cost of that success shows up in two figures: 76.1 per cent of Punjab’s and 51.3 per cent of Haryana’s net irrigated area is served by wells and tubewells. Over-pumping has lowered the groundwater table in these states.
Over-withdrawal in Rajasthan and Maharashtra has raised fluoride concentration in groundwater, and arsenic concentration has increased in parts of West Bengal and Bihar. Industry’s water share, though small now, connects to the industrial geography covered in our Secondary Activities notes.
Deterioration of water quality
Water quality means the purity of water — water without unwanted foreign substances. Micro-organisms, chemicals and industrial and other wastes pollute water, render it unfit for human use, damage aquatic systems, and can seep down to pollute groundwater.
River pollution follows a clear pattern. Upper stretches in hilly areas stay cleaner; in the plains, drains carry agricultural, domestic and industrial effluents into rivers, and pollutant concentration peaks in summer when the flow is low.
The Central Pollution Control Board, with state boards, monitors water quality at 507 stations. Organic and bacterial contamination remains the main source of pollution.
The most polluted stretches the chapter names:
- Yamuna between Delhi and Etawah — the most polluted river stretch in the country
- Sabarmati at Ahmedabad, Gomti at Lucknow, Kali, Adyar, Coom
- Vaigai at Madurai and Musi of Hyderabad
- Ganga at Kanpur and Varanasi
Laws have lagged. The Water (Prevention and Control of Pollution) Act 1974 and the Environment Protection Act 1986 have not been implemented effectively — in 1997, 251 polluting industries were located along rivers and lakes — and the Water Cess Act 1977 has made only marginal impacts. The chapter’s remedy is public awareness.
Reading the chapter’s maps: river basins and the Ganga
The chapter carries two maps that carry its spatial argument. Reading them is part of the chapter’s skill set, not decoration.
The India – River Basins map (shown in the surface-water section above) is the proof of the one-third-area and 60-per-cent claim. A full answer on spatial distribution makes three moves: name the Ganga–Brahmaputra–Barak concentration, contrast it with the already-harnessed south Indian rivers, and give the monsoon’s spatial variation as the cause.
The Ganga and its Tributaries map links geography to the pollution lists in the chapter.
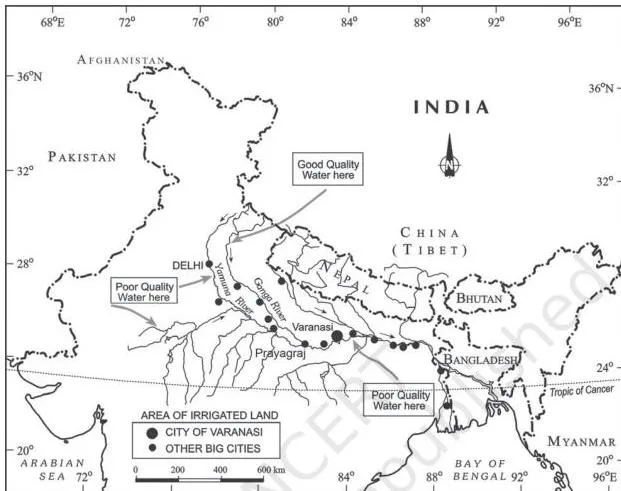
Read it this way: the towns marked along the banks are the points where domestic and industrial effluents enter the river system. This is exactly the raw material for the chapter’s second Activity, and it explains why the pollution list names the Ganga at Kanpur and Varanasi — both cities sit on the banks this map shows.
The discipline of reading a drainage map is the same skill practised in our Graphical Representation of Data notes.
The three activities in the chapter, decoded
Three classroom tasks sit inside the chapter. Each trains one skill the exercises test: arguing from evidence, reading a map, and observing daily life.
Activity 1 — the cost of intensive irrigation
The activity asks you to discuss how intensive irrigation in Punjab, Haryana and western Uttar Pradesh is increasing soil salinity and depleting groundwater, and what that means for agriculture.
The evidence is already in the chapter: more than 85 per cent of net sown area in those states is irrigated, wells and tubewells supply 76.1 per cent of Punjab’s and 51.3 per cent of Haryana’s irrigated area, and the water table is falling. A good discussion connects those facts to rising salinity and a shrinking water supply.
Activity 2 — towns and industries on the Ganga
The activity asks you to find the major towns and cities on the bank of the Ganga and its tributaries and the major industries they have. This is a map-reading task: use Fig 4.2, list the towns marked on the banks, and name what each is known for. The pollution section already gives you two anchors — Kanpur and Varanasi.
Activity 3 — recycling water at home
The activity asks you to observe the quantity of water used at home in various activities and list ways to reuse and recycle it. The chapter’s own examples: water after bathing and washing utensils can be used for gardening, and so can the water used for washing a vehicle.
The principle is that lower-quality recycled water frees better-quality water for drinking.
Watershed management and rainwater harvesting: the conservation toolkit
This is the solutions half of the chapter. Watershed management is the organising idea; rainwater harvesting is its best-known technique.
What watershed management does
Watershed management manages and conserves surface and groundwater together. It works by preventing runoff and storing and recharging groundwater through structures like percolation tanks and recharge wells.
In the broad sense it covers conservation, regeneration and judicious use of all natural and human resources within a watershed, aiming at a balance between natural resources and society. The deciding factor is community participation — the chapter says the success of watershed development largely depends on it.
Government programmes the chapter names:
- Haryali — a Central Government project executed by Gram Panchayats with people’s participation, conserving water for drinking, irrigation, fisheries and afforestation.
- Atal Bhujal Yojana (Atal Jal) — implemented in 8,220 water-stressed Gram Panchayats across 229 blocks in 80 districts of seven states, aiming to shift communities from a consumption attitude to conservation and smart water management.
- Neeru-Meeru (Andhra Pradesh) and Arvary Pani Sansad (Alwar, Rajasthan) — people-built percolation tanks, dug-out ponds called Johads, and check dams.
- Tamil Nadu has made rainwater harvesting structures compulsory — no new building may be constructed without them.
Rainwater harvesting: an old technique with a modern role
Rainwater harvesting captures and stores rainwater for various uses and for recharging groundwater aquifers. The chapter calls it a low-cost, eco-friendly technique that guides rain into borewells, pits and wells.
Traditional structures matter in answers: in Rajasthan, Kund or Tanka — covered underground tanks built near or inside the house or village — store harvested rainwater. Modern practice harvests rain from rooftops and open spaces.
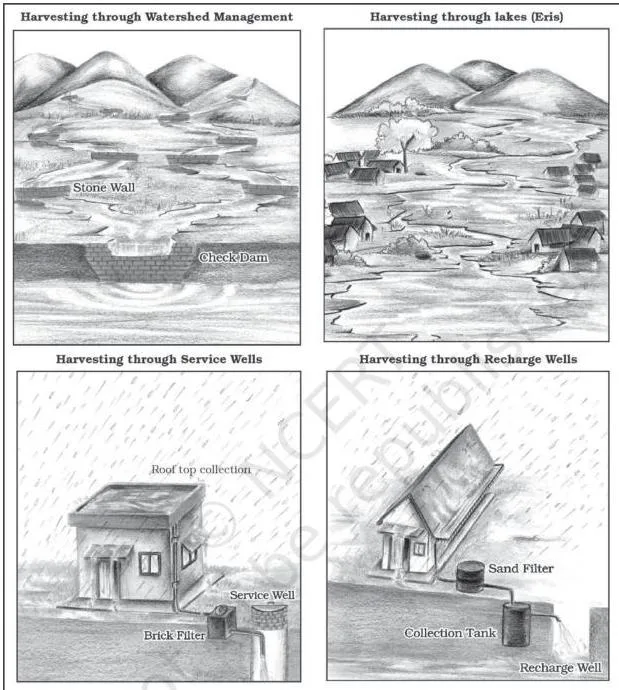
Figure 4.3 gathers the various methods. The idea behind them all is the same: rainwater that would run off can be guided into the ground instead, so it recharges the water table rather than being lost.
The chapter lists the benefits of rainwater harvesting:
- recharges groundwater and increases water availability
- checks the declining groundwater table
- improves groundwater quality by diluting contaminants like fluoride and nitrates
- prevents soil erosion and flooding
- arrests salt-water intrusion in coastal areas
- cuts community dependence on groundwater and saves the energy used to pump it
The Ralegan Siddhi case study: watershed development that worked
Ralegan Siddhi is the chapter’s worked example — the proof that watershed development can rebuild a water supply and a village economy together.
In 1975 the village, in Ahmadnagar district of Maharashtra, was trapped in poverty and illicit liquor trade. The transformation began when a retired army man settled there and persuaded villagers to accept family planning and voluntary labour, to stop open grazing and felling trees, and to ban liquor.
Voluntary labour kept the village largely independent of government grants — even villagers working outside contributed one month’s salary every year. The turning point was a leak: the percolation tank could not hold water, people voluntarily repaired the embankment, and the seven wells below it filled with water in summer for the first time in living memory.
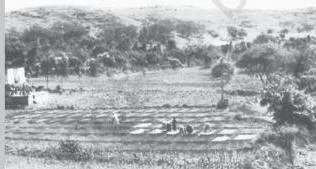

The two photographs record the change. The first shows the village before the mitigation approach — the state the chapter describes as a web of poverty. The second carries the chapter’s own verdict: at present, water is adequate and agriculture is flourishing, though the caption adds that the use of fertilisers and pesticides is very high.
The social process is as important as the engineering. A youth group called Tarun Mandal worked to ban the dowry system, caste discrimination and untouchability. Liquor-distilling units were removed, open grazing was banned in favour of stall-feeding, and water-intensive sugarcane was banned; pulses, oilseeds and low-water cash crops were encouraged instead.
Local elections began to be held by consensus, and a system of Nyay Panchayats, or informal courts, was set up — since then no case has been referred to the police. A school building worth Rs 22 lakh was built entirely from village resources, with no donations.
For an answer, this case study is your concrete evidence for watershed management and sustainable development: a degraded, water-scarce village used community participation, local structures and crop choice to make water adequate and agriculture flourish. The chapter is honest about limits — most watershed programmes are still at a nascent stage, and success stories are few.
Water policy and programmes at a glance
The chapter closes with schemes and a policy that are easy to mix up. This table keeps them apart.
| Programme | Launched by / when | What it does | One fact to remember |
|---|---|---|---|
| Pradhan Mantri Krishi Sinchayee Yojana (PMKSY) | Central Government, 2026-27 | Assures protective irrigation for all farms; promotes efficient water use; sustainable conservation; integrated development of rain-fed areas | The slogans “Har khet ko pani” and “Per drop more crop” |
| Haryali | Central Government watershed project | Conserves water for drinking, irrigation, fisheries and afforestation | Executed by Gram Panchayats with people’s participation |
| Atal Bhujal Yojana (Atal Jal) | Government programme (Ministry of Jal Shakti data) | Groundwater management in water-stressed blocks; shifts community attitude from consumption to conservation | 8,220 water-stressed Gram Panchayats in 229 blocks of 80 districts across seven states |
| Neeru-Meeru | Andhra Pradesh | Builds water-harvesting structures through people’s participation | Percolation tanks, Johads, check dams |
| Arvary Pani Sansad | Alwar, Rajasthan | Same people-built water-harvesting approach | The Johad dug-out pond is its best-known structure |
| National Water Policy 2012 | Government of India | Proposes a national water framework law; water as an economic good after pre-emptive needs; climate-change adaptation; water footprints and water auditing; community participation | Water is an economic good only after drinking water, food security and minimum ecosystem needs are met |
| Jal Kranti Abhiyan | Government of India, 2026-27 | Water security through per-capita availability; selects Jal Grams; model command areas; pollution abatement (including arsenic-free wells); mass awareness | One water-stressed village in each of 672 districts becomes a “Jal Gram” |
Beyond these, the chapter lists wider remedies: desalinisation (too costly to matter as a source), inter-linking of rivers to transfer water from surplus to deficit basins, and — most important for households and communities — pricing of water.
Definitions from the chapter, in plain words
These are the working definitions the chapter relies on. Learn the plain meaning first, then the precise phrasing you would write.
| Term | Plain meaning | Chapter section it comes from |
|---|---|---|
| Water quality | Purity of water — water without unwanted foreign substances | Deterioration of Water Quality |
| Replenishable groundwater | The rechargeable part of groundwater, about 432 cubic km | Groundwater Resources |
| Lagoons and backwaters | Brackish coastal water bodies used for fishing and for irrigating paddy and coconut | Lagoons and Backwaters |
| Conjunctive use | Using surface water and groundwater together | Water Conservation and Management |
| Watershed management | Preventing runoff and recharging water through structures like percolation tanks and recharge wells; balancing natural and human resources | Watershed Management |
| Rainwater harvesting | Capturing and storing rain for use or groundwater recharge; low-cost and eco-friendly | Rainwater Harvesting |
Common mistakes students make in Water Resources
Six errors repeat across student answers to this chapter. Each one has a quick self-check.
| Mistake | Correct rule | How to check |
|---|---|---|
| Quoting 4,000 cubic km as India’s usable water | 4,000 cubic km is total annual precipitation; only 1,122 cubic km is utilisable (about 28 per cent) | Does your sentence use the word “precipitation” for the 4,000 figure? |
| Calling groundwater a non-renewable resource | The chapter calls it replenishable (432 cubic km); the problem is the rate of over-pumping in high-use states | Does your answer use the word “replenishable”? |
| Swapping the groundwater utilisation groups | High: Punjab, Haryana, Rajasthan, Tamil Nadu. Moderate: Gujarat, Uttar Pradesh, Bihar, Tripura, Maharashtra. Low: Chhattisgarh, Odisha, Kerala | Can you name one state from each group without looking? |
| Treating river water as usable water | Only 690 cubic km (32 per cent) of surface flow is utilisable; the rest is lost to topographical and hydrological constraints | Do your figures come in the pair “690 and 32 per cent”? |
| Naming only the Ganga as polluted | The Yamuna between Delhi and Etawah is the most polluted stretch; the list also includes the Sabarmati, Gomti, Kali, Adyar, Coom, Vaigai and Musi | Can you name one polluted river other than the Ganga? |
| Calling rainwater harvesting a modern idea | It is a traditional practice — Rajasthan’s Kund and Tanka are village structures built near or inside the house | Does your answer name a traditional structure? |
How to answer the three exercise questions
The exercises close the chapter. Each question below is mapped to the section that answers it, and question 2(i) has a worked 30-word answer.
Question 1 — the MCQs
- (i) → (a) Abiotic resource. The chapter’s opening calls water a cyclic resource with abundant supplies. Among the options it is not biotic, not non-renewable and not non-cyclic, so the type is abiotic.
- (ii) → Tamil Nadu. The chapter’s very high utilisation list is Punjab, Haryana, Rajasthan and Tamil Nadu.
- (iii) → Irrigation. Agriculture takes 89 per cent of surface water and 92 per cent of groundwater.
Question 2 — the 30-word answers
| Question part | What a full answer needs | Where it lives in the chapter |
|---|---|---|
| 2(i) Depletion of water resources | Per-capita availability falls with population growth; water sources are polluted by industrial, agricultural and domestic effluents; groundwater is over-pumped for irrigation | Opening; Emerging Water Problems; Demand of Water for Irrigation |
| 2(ii) Highest groundwater development in Punjab, Haryana and Tamil Nadu | Intensive irrigated farming: more than 85 per cent of net sown area in Punjab, Haryana and western Uttar Pradesh is irrigated; 76.1 per cent of Punjab’s and 51.3 per cent of Haryana’s irrigated area comes from wells and tubewells | Groundwater Resources; Demand of Water for Irrigation |
| 2(iii) Agriculture’s share expected to decline | With development, the shares of industrial and domestic sectors are likely to increase | Water Demand and Utilisation |
| 2(iv) Impacts of contaminated water | Water is rendered unfit for human use; toxic substances damage aquatic systems; pollutants seep into groundwater | Deterioration of Water Quality |
Worked answer for 2(i) (about 30 words): “India’s usable water is only 1,122 cubic km. A growing population, pollution from farms and factories, and over-pumping of groundwater for irrigation deplete it fast.” It uses a figure from the chapter, names two depletion factors, and stays near the word limit — check your own draft against those three tests.
Question 3 — the 150-word answers
- 3(i) Availability and spatial distribution — build from the water budget (4,000, 1,869 and 1,122 cubic km, with 690 of surface flow usable) and from the monsoon-driven pattern: the Ganga–Brahmaputra–Barak basins hold 60 per cent of surface water in one-third of the area.
- 3(ii) Social conflicts — open with the chapter’s claim that sharing and control of water are disputed among communities, regions and states; support it with groundwater over-use (high-utilisation states, fluoride and arsenic contamination) and the chapter’s warning that continued trends will be detrimental to development and can cause social upheaval and disruptions.
- 3(iii) Watershed management and sustainable development — give the definition (preventing runoff, recharging water through percolation tanks and recharge wells, balancing natural and human resources), then prove it with the Ralegan Siddhi case study.
Structuring a 150-word answer: open with the definition or the figure, develop with at least two supporting facts, and close with the chapter’s conclusion. For question 3(iii), Ralegan Siddhi is the ready-made example. Remember that textbook contents and the examinable syllabus are not always identical — check the current official CBSE syllabus for what is examinable.
Water Resources from start to finish: the chapter’s argument in six steps
If you have two minutes before an assessment, hold this six-step chain. It is the chapter’s whole argument.
- Endowment. 4,000 cubic km of rain, 1,869 cubic km of surface water plus replenishable groundwater, and 1,122 cubic km utilisable — of which 690 is surface and 432 is replenishable groundwater.
- Distribution. The monsoon concentrates water in space and time; the Ganga–Brahmaputra–Barak basins hold 60 per cent of surface water in one-third of the area; groundwater utilisation is highest in Punjab, Haryana, Rajasthan and Tamil Nadu.
- Demand. Irrigation takes 89 per cent of surface and 92 per cent of groundwater; industry 2 and 5 per cent; domestic 9 per cent of surface water.
- Stress. Over-pumping lowers water tables; fluoride rises in Rajasthan and Maharashtra, arsenic in parts of West Bengal and Bihar; the Yamuna between Delhi and Etawah is the most polluted stretch, and the Ganga at Kanpur and Varanasi is on the pollution list.
- Response. Prevention of pollution, recycle and reuse, conjunctive use, watershed management (percolation tanks, recharge wells, Johads) and rainwater harvesting (Kund, Tanka), backed by PMKSY, Haryali, Atal Jal, Neeru-Meeru, Arvary Pani Sansad, the National Water Policy 2012 and Jal Kranti Abhiyan — plus inter-linking of rivers and water pricing.
- Proof. Ralegan Siddhi: a voluntarily repaired percolation tank, community participation and a ban on sugarcane turned a poor village into one where water is adequate and agriculture flourishes.
Related chapters and resources
Water Resources connects to the rest of your Class 12 Geography set and to your Class XI book.
- Class 12 Geography notes hub — chapters from both Class 12 Geography books.
- Class 12 hub — notes and resources across your Class 12 subjects.
- Main CBSE notes index — the starting point for notes across classes.
- Graphical Representation of Data — the map- and data-reading skills this chapter’s figures depend on.
- Secondary Activities — the industrial geography behind industry’s share of water use.
The chapter itself refers you to Class XI India: Physical Environment for the monsoon’s spatial variation and the huge catchment areas of the Ganga, Brahmaputra and Indus. The authority for the textbook is the NCERT official website, which publishes this chapter as legy204.pdf within India: People and Economy.
Sources and data verification
- The content and figures on this page describe the NCERT Class 12 Geography textbook India: People and Economy, chapter 4 (Water Resources), in the official NCERT edition.
- This page covers only that NCERT book. It is not a listing of the wider CBSE scheme of studies or of the other Class 12 Geography books.
- It is maintained for the current academic session using the NCERT information available to us. NCERT settles textbooks, editions and PDFs; CBSE settles the curriculum, syllabus and examinations.
- Textbook contents and the examinable syllabus are not always identical — always check the current official CBSE syllabus for what is examinable this session.
Water Resources Class 12: frequent questions
Where can I download the water resources class 12 NCERT Geography chapter PDF?
Open the official NCERT Class 12 Geography Chapter 4 Water Resources PDF from ncert.nic.in whenever you need the printed chapter itself — the diagrams, maps and exercises included. It is chapter 4 of India: People and Economy, and the same link is given at the top of this page.
Why is only 1,122 cubic km of India’s water utilisable when 4,000 cubic km falls as rain?
4,000 cubic km is total annual precipitation, not usable water. The availability from surface water and replenishable groundwater is 1,869 cubic km, and only 60 per cent of that — 1,122 cubic km — can be put to beneficial uses. Of surface flow alone, only 690 cubic km (32 per cent) is utilisable because of topographical, hydrological and other constraints.
Which states have the highest groundwater utilisation and why?
Punjab, Haryana, Rajasthan and Tamil Nadu. The reason is irrigated agriculture: more than 85 per cent of net sown area in Punjab, Haryana and western Uttar Pradesh is irrigated, and 76.1 per cent of Punjab’s and 51.3 per cent of Haryana’s net irrigated area is served by wells and tubewells.
That over-pumping lowers the water table and has raised fluoride levels in Rajasthan and Maharashtra and arsenic in parts of West Bengal and Bihar.
What is watershed management and how did Ralegan Siddhi succeed at it?
Watershed management prevents runoff and recharges surface and groundwater through structures like percolation tanks and recharge wells, with the wider goal of balancing natural and human resources. Its success depends on community participation.
Ralegan Siddhi showed it working. Villagers voluntarily repaired a leaking percolation tank, the seven wells below it filled in summer for the first time in living memory, and the village then banned water-intensive sugarcane, formed the Tarun Mandal youth group, set up Nyay Panchayats and replaced open grazing with stall-feeding.
Today water is adequate and agriculture flourishes, though the chapter notes that fertiliser and pesticide use is very high.
What is the difference between the National Water Policy 2012 and Jal Kranti Abhiyan?
The National Water Policy 2012 is a policy document. It proposes a national water framework law, treats water as an economic good only after pre-emptive needs for drinking water, food security and minimum ecosystem needs, and calls for climate-change adaptation, water footprints, water auditing and community participation.
Jal Kranti Abhiyan (2026-27) is an action campaign for water security through per-capita availability. It selects one water-stressed village in each of 672 districts as a Jal Gram, identifies model command areas of about 1,000 hectares, builds arsenic-free wells, abates pollution and runs mass awareness drives.
One sets the long-term framework; the other is on-the-ground action.
Reference: NCERT Class 12 Geography textbook, chapter 4, official edition on ncert.nic.in.
Explore Class 12 Geography Books
- Previous: Graphical Representation of Data
- Next: Secondary Activities
Related chapters: