
Chapter 4 Spatial Information Technology is the GIS chapter of the NCERT Class 12 Geography textbook Practical Work in Geography Part-II — a 19-page chapter on how computers store, link and analyse geographic data.
The official PDF of Spatial Information Technology Class 12 is offered right below, and the rest of this page teaches what the chapter contains, with NCERT page references so you can follow along in the book.
Download the Spatial Information Technology Class 12 NCERT Chapter PDF
The official NCERT edition of the Spatial Information Technology Class 12 NCERT Geography Chapter 4 PDF is published at ncert.nic.in and holds the complete chapter from Practical Work in Geography Part-II. Open it to read the chapter exactly as NCERT printed it, with every figure, box and exercise in place.
This is the file CBSE schools refer to. The page numbers cited on this page follow the printed numbering of this NCERT edition.
| What the chapter holds | Count | Where it is used |
|---|---|---|
| Printed pages | 19 | |
| Figures with NCERT captions | 13 | |
| Tables | 2 | |
| Exercise questions | 3 | answered in our NCERT Solutions |
| Official NCERT PDF | Download the chapter PDF | the chapter exactly as NCERT publishes it |
Chapter 4 at a Glance: What Is Inside the PDF
The table below lists what the chapter file contains — its length, figures, comparison tables and exercise sets — counted from the NCERT edition.
| What the chapter holds | Count |
|---|---|
| Printed pages | 19 |
| Figures | 13 |
| Comparison tables (Boxes 4.1 and 4.2) | 2 |
| Exercise question sets | 3 |
The chapter is conceptual, not numerical: it carries no formulas and no worked examples, so the skills that matter are defining terms, comparing data formats and explaining GIS operations.
What This Chapter Covers: From Maps to Decision Support
The chapter opens with the everyday questions a spatial information system is built to answer: What is where? Why is it there? What will happen if it is shifted to a new location? Who gains, and who loses, from that move? (NCERT, p. 45) Ordinary computer tools cannot answer these.
A Database Management System (DBMS) processes data, and Computer Assisted Cartography draws maps and diagrams from it, but neither can evolve a decision support system. GIS exists to do exactly that — to integrate data collected from different sources and support decisions about the real world.
The chapter teaches eight blocks of ideas:
- what the word spatial means, and how Spatial Information Technology combines Remote Sensing, GPS, GIS, Digital Cartography and DBMS
- spatial vs non-spatial data, using the chapter’s own worked tables in Box 4.1
- the five components of a GIS and the role each one plays
- raster and vector data formats, and which tasks each handles best
- the five-stage GIS work sequence from data input to spatial analysis
- data verification, editing and format conversion
- linking and matching data sets: exact, hierarchical and fuzzy matching
- overlay and buffer analysis, the two spatial operations the chapter treats in detail
Spatial Information Technology Class 12: Key Concepts, Explained
This chapter has no formulas to memorise. What you need is the ability to define terms precisely, to compare data formats, and to explain how a GIS turns stored data into decisions.
What Is Spatial Information Technology?
Start with the word spatial, because it appears in nearly every answer you write. The chapter derives it from space: a feature is spatial when it is distributed over a geographically definable space and has physically measurable dimensions — a road, a field boundary, the address of a municipal facility.
(NCERT, p. 45) Spatial Information Technology (SIT) is the use of technological inputs to collect, store, retrieve, display, manipulate, manage and analyse spatial information. It is an amalgamation of five parent fields: Remote Sensing, GPS, GIS, Digital Cartography and Database Management Systems. (NCERT, p. 45)
What Is a GIS?
A Geographic Information System is the applied form of this technology — a system for capturing, storing, checking, integrating, manipulating, analysing and displaying data that are spatially referenced to the Earth. In practice it means a spatially referenced computer database plus the applications software that works on it. (NCERT, p. 46) GIS matters because it goes beyond what its parents do.
It is an amalgamation of Computer Assisted Cartography and DBMS, drawing conceptual strength from computer science, statistics, cartography, remote sensing, database technology, geography, geology, hydrology, agriculture and resource management.
The point students miss: a DBMS only processes data and a map only displays it, while a GIS analyses it and supports decisions. (NCERT, p. 46)
Spatial Data vs Non-Spatial Data
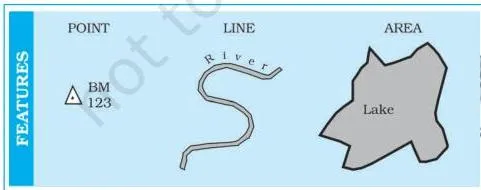
All geographical information is carried by two kinds of data, and telling them apart is the most tested idea in this chapter. Spatial data are characterised by their positional, linear and areal forms of appearance — a point, a line and an area (Fig. 4.1). The data that describe spatial data are called non-spatial or attribute data. (NCERT, pp. 46-47)
The cycle shop example in Box 4.1 makes the distinction concrete. A stock register of wheel spokes, ball bearings and tyres is non-spatial — those parts could be stored anywhere. Literate population by state is spatial, because every state has a definite, mappable location. (NCERT, p. 46)
Advantages of GIS Over Manual Methods
Why replace paper maps at all? The chapter lists three inherited limitations: map information is processed and presented in a particular way, a map shows only predetermined themes, and altering the depicted information means drawing a new map. (NCERT, p. 47) A GIS removes all three. Its advantages come as a list of four:
- users can interrogate displayed spatial features and retrieve their attribute information for analysis;
- maps can be drawn by querying or analysing attribute data;
- spatial operations such as polygon overlay and buffering can be applied to the integrated database to generate new information;
- different items of attribute data can be linked to one another through a shared location code. (NCERT, p. 48)
The Five Components of GIS
Every GIS is built from five components, and a complete answer names all five: hardware, software, data, people and procedures. (NCERT, p. 48)
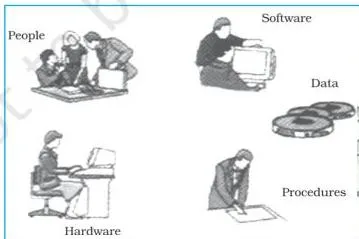
The role of each component:
- Hardware — the processing, storage, display, and input/output sub-systems.
- Software — modules for data entry, editing and maintenance; for analysis, transformation and manipulation; and for display and output.
- Data — spatial and related tabular data, the backbone of the system.
- People — a range that runs from hardware and software engineers to environmental scientists, policymakers and monitoring agencies.
- Procedures — how data will be retrieved, input, stored, managed, transformed, analysed and presented in the final output. (NCERT, p. 49)
Students routinely list only the first three. Keep people and procedures in your answer — the chapter treats all five as equal components.
Raster Data Format and Resolution
Raster and vector are the two formats in which GIS stores spatial data. The chapter teaches both with one running example: a diagonal line drawn on a sheet of paper. (NCERT, p. 49) A raster file represents that line by subdividing the paper into a matrix of small rectangles called cells.
Each cell is assigned a position in the data file and a value based on the attribute found there, and any individual pixel can be identified by its row and column coordinates. (NCERT, p. 49)
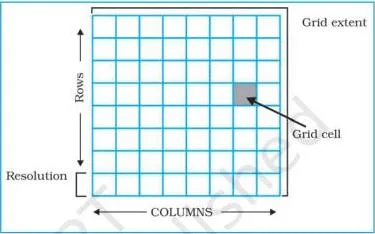
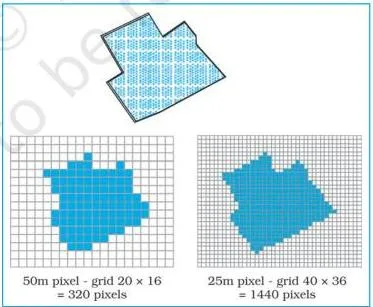
Resolution is the relationship between the cell size and the number of cells. Fig. 4.4 shows why it matters: the larger the cells, the blockier the line and the more detail is lost.
Raster formats are chosen for aerial photographs and satellite images, for scanned paper maps, when cost must stay low, when the map needs no analysis of individual features, and when a “backdrop” map is all that is required. (NCERT, p. 50)
Vector Data Format and Coordinates
A vector representation of the same diagonal line does something different: it records only the coordinates of the line’s starting and ending points. (NCERT, p. 50) Each point is stored as two or three numbers — X and Y, with Z added for elevation.
X measures distance from the left edge of the paper, Y the distance from the bottom, and Z the height above or below it. Joining the measured points forms the vector. (NCERT, p. 50)
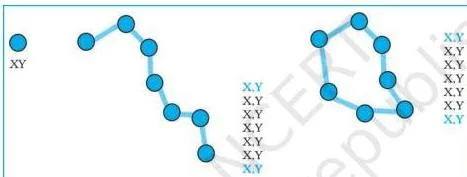
In the vector model, lines are built from ordered points and polygons from points or lines. Vectors can also store topology — the spatial relationships between features. Vector files are used for highly precise work, when file size matters, when individual features must be analysed, and when descriptive information must be stored. (NCERT, p. 51)
Raster vs Vector: The Trade-offs
Fig. 4.6 shows the same spatial entities stored both ways: the raster version is a blocky grid of cells, the vector version a clean set of lines. Neither is “better” — each wins on different tasks.
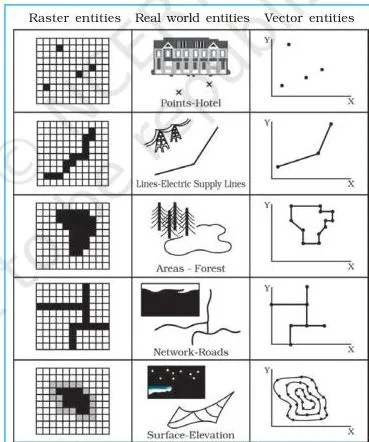
| Format | Advantages | Disadvantages |
|---|---|---|
| Raster | Simple data structure; easy and efficient overlaying; compatible with satellite imagery; high spatial variability efficiently represented | Inefficient use of computer storage; errors in perimeter and shape; difficult network analysis; loss of information when large cells are used |
| Vector | Compact data structure; efficient network analysis; efficient projection transformation; accurate map output | Complex data structure; difficult overlay operations; high spatial variability inefficiently represented; not compatible with satellite imagery |
These trade-offs come from Box 4.2 in the chapter (NCERT, p. 51), and the exercises test them from both directions: choose raster for overlay and imagery, vector for network analysis and precision.
The Sequence of GIS Activities
Every GIS project follows the same five-stage order, and the chapter asks you to reproduce it in a 125-word answer. The sequence is: (NCERT, p. 52)
- Spatial data input — getting the location data into the system;
- Entering the attribute data — adding the descriptive data that goes with each feature;
- Data verification and editing — finding and correcting errors;
- Spatial and attribute data linkages — joining the two kinds of data;
- Spatial analysis — running operations that answer the user’s question.
For the descriptive question, give each of the five steps one line of explanation, not just its name.
Spatial Data Input: Data Suppliers, Digitising and Scanners
Spatial data reaches a GIS from two directions: you acquire ready-made digital data sets from a supplier, or you create digital data by manual input — through digitising or scanning. (NCERT, p. 52) Buying ready-made data saves time, but the chapter warns that data from different suppliers must be checked for compatibility before they are combined in one project.
(NCERT, p. 53) The compatibility checks to remember:
- the scale of the data;
- the geo-referencing system used;
- the data collection techniques and sampling strategy;
- the quality of the data collected;
- the classification and interpolation methods used;
- the size and shape of the individual mapping units;
- the length of the record.
Scanners convert analogue maps into high-resolution raster images. Flatbed scanners move a light source over the document; drum types move the map past a fixed illumination source and camera array. Both rely on Charged Coupled Devices (CCDs), semiconductor sensors that turn incoming light photons into counts of electrons, recorded as digital values. (NCERT, pp. 53-54)
Attribute Data, Verification, Editing and Conversion
Attribute data define the properties of a spatial entity that are not themselves spatial. A road may be captured as a line; its width, surface type, estimated traffic and specific traffic regulations are attribute values stored separately from the line. (NCERT, p. 53) Once data are captured, errors must be found.
The chapter groups them into three kinds: spatial data that are incomplete or double, spatial data at the wrong scale, and spatial data that are distorted — often from aerial-photograph distortion or from paper maps damaged by rain and repeated folding.
(NCERT, p. 55) The checking method is simple: plot the data on a translucent sheet at the same scale as the original, lay it over the source map on a light table, and compare systematically from left to right and top to bottom. Correction happens on screen — moving, rotating, erasing, inserting or stretching entities with the cursor.
Data conversion exists because analysis needs all layers in one format. The usual change is vector to raster, since most analysis is done in the raster domain; raster may be converted back to vector when the goal is to reduce storage. (NCERT, p. 55)
Linking and Matching Geographic Data
Linking is what makes analysis possible. To find the mortality rate from malnutrition among children under 10, you need one file of children in that age group and another of malnutrition mortality figures — combine the two, then divide one by the other. (NCERT, p. 55) The chapter distinguishes three ways to match data sets:
- Exact matching — both files share a common key, such as the name of a town; records with the same town name are extracted, joined and stored together.
- Hierarchical matching — small-area data are aggregated until the grouped areas match larger ones, as when frequently collected land-use data are matched with less frequent land-transformation data.
- Fuzzy matching — the boundaries simply do not align, as crop field boundaries rarely match soil-type boundaries; the solution is to overlay the two sets and compute, for example, crop productivity for each soil type.
All three appear within two pages of the chapter (NCERT, pp. 55-56). A one-line example for each is the fastest way to prove you know the difference.
Spatial Analysis: Overlay and Buffer Operations
Analysis is the strength of GIS — the functions that turn stored data into answers about the real world. The chapter names four analysis operations and teaches two in detail: overlay and buffer. (NCERT, p. 56) Overlay analysis integrates two or more thematic layers of maps of the same area to obtain a new map layer.
The chapter compares it to sieve mapping — overlaying tracings on a light table to make comparisons and obtain an output map.
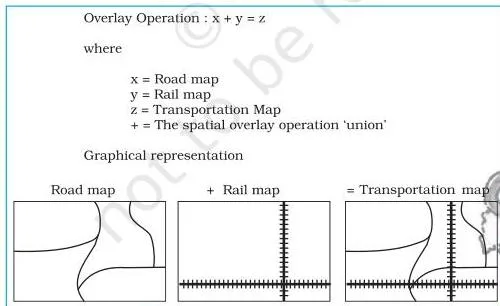
Buffer operation creates a zone of a specified distance around any point, line or area feature. It locates the areas or population benefited — or denied — by facilities such as hospitals, post offices and parks, and studies the impact of point sources of pollution. This is called proximity analysis.
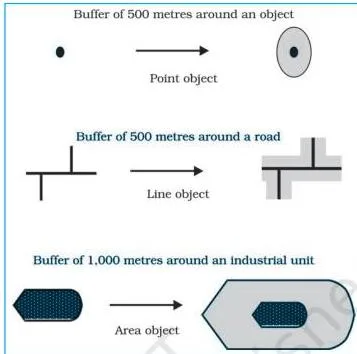
One detail to keep: the buffer operation generates polygon features no matter what the original feature was. The chapter’s example — households within a one-kilometre buffer of a chemical industrial unit are affected by the waste discharged from the unit. (NCERT, p. 59)
Figure Walkthrough: The Aligarh and Hospital Case Studies
The chapter’s two case studies put overlay and buffer onto real maps. Working through them is the fastest way to understand what the two operations actually do.
Overlay as change detection: Aligarh, 1974–2001
Fig. 4.8 maps urban land use in Aligarh City at two dates, 1974 and 2001. Side by side, the two maps show the built-up area expanding over the 27 years between them.
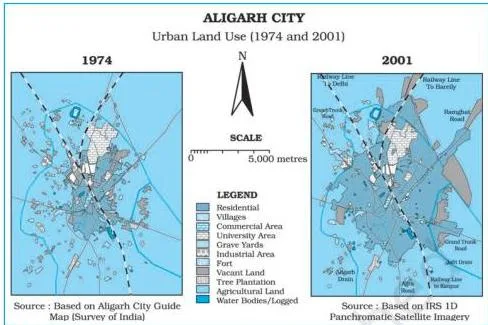
Overlaying the two maps brings the changes out as a new layer: Fig. 4.9 shows the urban land transformations of 1974–2001.
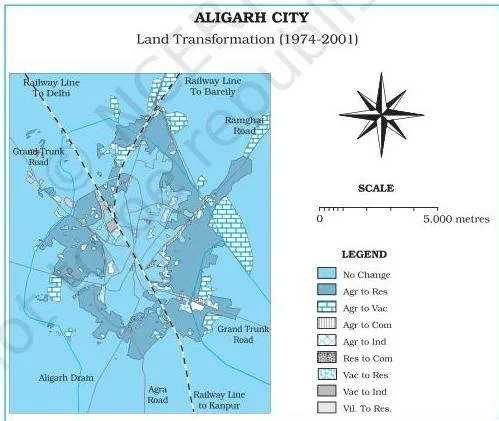
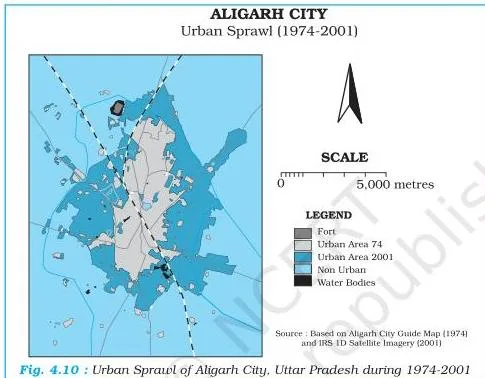
The third map, Fig. 4.10, shows the urban sprawl of Aligarh mapped across the period. The general lesson: map overlay can be used to study changes in land use and land cover between two points in time, and to analyse the resulting land transformations. (NCERT, p. 57)
Buffer as proximity analysis: hospitals in western Uttar Pradesh
Fig. 4.12 locates six cities of western Uttar Pradesh — Saharanpur, Muzaffarnagar, Meerut, Ghaziabad, Gautam Budh Nagar and Aligarh — the ones with major hospitals.
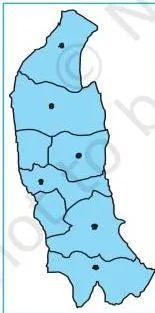
Fig. 4.13 draws buffers of specified distances around those cities. With GIS software you can create buffers of 2, 4, 6, 8 and 10 kilometres around each major-hospital city.
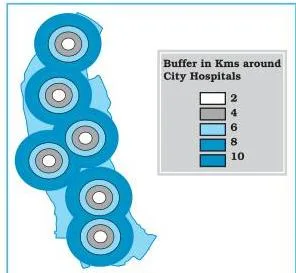
Read the result the way the chapter does: areas closer to the hospital cities are better served, people living further away must travel long distances to use the medical services, and those areas are least benefitted. (NCERT, p. 60) In short: the Aligarh maps demonstrate overlay; the hospital maps demonstrate buffer, or proximity, analysis.
Key Definitions From the Chapter
These are the terms a 30-word exam answer is built from. Learn each definition in your own words; page references follow the printed NCERT edition.
| Term | Meaning | NCERT page |
|---|---|---|
| Spatial | Distributed over a geographically definable space, with physically measurable dimensions | p. 45 |
| Spatial Information Technology | Using technology to collect, store, retrieve, display, manipulate, manage and analyse spatial information | p. 45 |
| GIS | A system for capturing, storing, checking, integrating, manipulating, analysing and displaying data spatially referenced to the Earth | p. 46 |
| Spatial data | Data with a definite map location, appearing in positional (point), linear and areal forms | p. 46 |
| Non-spatial / attribute data | Data that describe spatial data | p. 47 |
| Raster | A graphic feature stored as a pattern of grid cells; each pixel is identified by row and column coordinates | p. 49 |
| Resolution | The relationship between cell size and the number of cells in a raster | p. 50 |
| Vector | A graphic feature stored as coordinate pairs (X, Y, Z); points build lines, lines build polygons | p. 50 |
| Topology | The spatial relationships between features, storable in a vector database | p. 51 |
| Digitising | Manual input of spatial data using a digitiser | p. 53 |
| Attribute data | Properties of a spatial entity that are not themselves spatial, such as a road’s width and surface type | p. 53 |
| Overlay analysis | Integrating two or more thematic layers of the same area to obtain a new map layer | p. 56 |
| Buffer | A zone of a specified distance created along a point, line or area feature | p. 58 |
| Proximity analysis | Using buffers to locate areas or populations benefited or denied of facilities and services | p. 59 |
| Data matching (exact / hierarchical / fuzzy) | Joining data sets by a common key; by aggregating small areas; or by overlaying non-matching boundaries | pp. 55-56 |
Common Mistakes Students Make in This Chapter
These are the characteristic errors students make in this chapter, with the rule that fixes each one.
| Mistake | Correct rule | How to check your answer |
|---|---|---|
| Calling a GIS a map-drawing tool | GIS stores, analyses and supports decisions; mapping is only one of its functions | Ask: does the feature merely display data, or does it analyse it (query, overlay, buffer)? |
| Mixing up spatial and non-spatial data | Spatial data have a definite map location; attribute data merely describe spatial features | Ask: could this record be drawn at a definite point on a map? |
| Listing only hardware, software and data as GIS components | GIS has five components: hardware, software, data, people, procedures | After writing the list, count to five |
| Claiming raster is always better, or vector always better | Each format has trade-offs (Box 4.2): raster suits overlay and imagery, vector suits precision and networks | Name the task first; the better format follows from the task |
| Confusing overlay with buffer | Overlay combines layers of the same area into one new layer; buffer creates a distance zone around a feature | “Two maps merged” = overlay; “a 1 km zone around a point” = buffer |
| Thinking small grid cells mean low resolution | Resolution is the relationship between cell size and cell count; smaller cells give finer detail | Check Fig. 4.4: the coarse grid loses the diagonal line’s shape |
How the Chapter’s Exercises Test You
The chapter ends with three exercise sets on pages 60-61. They test three different skills: recognising concepts, writing short definitions, and writing longer explanatory answers.
Set 1 — choose the right answer. Five multiple-choice questions check whether you can recognise a concept. Each correct option sits in the chapter text:
| Question | Concept tested | Answer | Where the chapter says so |
|---|---|---|---|
| (i) Forms in which spatial data appear | Forms of geographical information | (d) All the above — positional, linear and areal | p. 46 |
| (ii) Operation that needs analysis-module software | GIS software functions | (d) Buffering | pp. 48-49, 56 |
| (iii) Disadvantage of raster format | Box 4.2 trade-offs | (d) Difficult network analysis | p. 51 |
| (iv) Advantage of vector format | Box 4.2 trade-offs | (d) Compact data structure | p. 51 |
| (v) Operation used for urban change detection | Overlay analysis | (a) Overlay operations | p. 57 |
Set 2 — answers in about 30 words. Six questions ask for definitions of raster vs vector, overlay analysis, GIS advantages, GIS components, ways of building spatial data, and Spatial Information Technology. A full answer needs two or three precise sentences: one defining the term, one stating its key point.
Set 3 — answers in about 125 words. Two questions test connected understanding. The first asks you to discuss raster and vector formats with an example; the second asks for an explanatory account of the sequence of GIS activities. Cover all five stages of the sequence, or both sides of the format trade-off, with a line of explanation for each.
Textbook contents and the examinable syllabus are not always identical — check the current official CBSE syllabus before the exam.
Chapter Recap: The Core Ideas in One Page
- Spatial Information Technology uses computers to collect, store, retrieve, display, manipulate, manage and analyse spatial information.
- SIT combines Remote Sensing, GPS, GIS, Digital Cartography and Database Management Systems.
- GIS is the decision-support application: a system for capturing, storing, checking, integrating, manipulating, analysing and displaying Earth-referenced data.
- Geographical information comes in two kinds: spatial data (point, line, area) and non-spatial attribute data that describes it.
- A GIS has five components: hardware, software, data, people and procedures.
- Raster stores features as grid cells; vector stores them as coordinate pairs. Each has clear trade-offs.
- The GIS work sequence runs: spatial data input, attribute data entry, verification and editing, data linkage, spatial analysis.
- Data errors are incomplete or double data, wrong-scale data and distorted data; they are found by light-table comparison and fixed by editing.
- Data sets link by exact, hierarchical or fuzzy matching.
- Overlay analysis combines layers of the same area into a new layer — the Aligarh land-use maps show it detecting change.
- Buffer analysis creates distance zones around features — the hospital maps show it measuring proximity.
Related Chapters and Resources
This listing is maintained for the 2026-27 academic session using the NCERT textbook information available to us. NCERT remains the authority for confirming the latest edition.
If this chapter is part of your revision run, these pages help you move across the syllabus:
- Class 12 Geography notes — all chapters of the Class 12 Geography books in one place.
- Graphical Representation of Data — the previous chapter in this practical work book, covering bar graphs, pie diagrams and other data display methods.
- Secondary Activities — a related chapter from the Class 12 Geography Fundamentals of Human Geography book.
- Class 12 notes hub — every subject in one place.
- CBSE Notes — the full notes index.
The chapter closes by pointing to official websites to explore spatial technology further: schoolgis.nic.in, Bhuvan, the government GIS portal for Indian maps and satellite data, and the Indian Institute of Remote Sensing (IIRS) website. (NCERT, p. 60)
Sources and Data Verification
This page describes Chapter 4 Spatial Information Technology of the NCERT Class 12 Geography textbook Practical Work in Geography Part-II, in the official edition published at ncert.nic.in. It covers this book and this chapter only, not the other two Class 12 Geography volumes.
The page is maintained for the current academic session against the NCERT edition available on the NCERT website. NCERT publishes and settles the textbook, its editions and the official PDF; the Central Board of Secondary Education settles the examinable syllabus, which is checked separately.
Reference: NCERT Class 12 Geography Practical Work in Geography Part-II textbook, chapter 4, official edition on ncert.nic.in.
Frequently Asked Questions About Spatial Information Technology
Direct answers to the questions students most often search for around this chapter.
What is the difference between spatial and non-spatial data in GIS?
Spatial data have a definite map location and appear in three forms — point, line and area. Non-spatial (attribute) data describe spatial data. The chapter’s example: a cycle-shop stock register is non-spatial, while literate population by state is spatial because each state occupies a definite place on a map. (NCERT, p. 46)
What is the difference between raster and vector data formats?
Raster stores a feature as a grid of cells identified by row and column; vector stores it as coordinates of points, with lines built from ordered points. Raster suits overlays and satellite imagery; vector suits precision, compact files and network analysis — Box 4.2 lists the trade-offs of both. (NCERT, pp. 49-51)
What are the five components of GIS?
Hardware, software, data, people and procedures. Hardware processes and stores; software handles entry, analysis and display; data are the spatial and tabular backbone; people range from engineers to policymakers; procedures define how data are retrieved, processed and presented. (NCERT, p. 48)
What is overlay analysis in GIS?
Overlay analysis integrates two or more thematic layers of maps of the same area to obtain a new map layer. The chapter compares it to sieve mapping on a light table, and uses it on the Aligarh maps to detect urban land transformation between 1974 and 2001. (NCERT, p. 57)
What is buffer analysis or proximity analysis in GIS?
Buffer analysis creates a zone of a specified distance around a point, line or area feature, and uses it to locate areas or populations benefited or denied of facilities. The chapter’s example: households within one kilometre of a chemical industrial unit are affected by its waste. It is also called proximity analysis. (NCERT, p. 59)
Is the Spatial Information Technology chapter part of the Class 12 Geography board exam syllabus?
Textbook contents and the examinable syllabus are not always identical. The chapter is part of the NCERT textbook used in CBSE schools, but whether every part of it is examinable this session is settled by the current official CBSE syllabus — check that before the exam.
Explore Class 12 Geography Books
- Previous: Graphical Representation of Data
- Next: Secondary Activities
Related chapters: