
The World Population Class 12 chapter from NCERT Geography is here as the official chapter PDF, with a section-by-section walkthrough of everything it teaches underneath it.
The chapter runs about six printed pages of the textbook Fundamentals of Human Geography and answers one question in three parts: where people live, how crowded those places are, and how and why populations change.
Download the World Population Class 12 Chapter PDF
The official NCERT Class 12 Geography Chapter 2 The World Population PDF is published on ncert.nic.in, the same source your school’s copy is printed from; keep it open to read the chapter in full, follow the maps in colour, or print a working copy for notes. This is the current NCERT reprint (2026-27) of Fundamentals of Human Geography.
| What the chapter holds | Count | Where it is used |
|---|---|---|
| Printed pages | 6 | |
| Figures with NCERT captions | 6 | |
| Exercise questions | 19 | answered in our NCERT Solutions |
| Official NCERT PDF | Download the chapter PDF | the chapter exactly as NCERT publishes it |
Chapter at a Glance: What Is Inside the PDF
The table below lists everything the file holds — its sections, figures, formulas and closing exercise set — so you can see the chapter’s size before you open it.
The chapter spans printed pages 7 to 12 of Fundamentals of Human Geography and moves in one argument: patterns of distribution, density as a ratio, the factors behind both, the mechanics of growth (rates, migration, demographic transition) and the case for population control.
What the World Population Chapter Covers, Section by Section
If you want to know where an idea sits in the PDF before reading it, here is the chapter’s order, with the printed page each part starts on.
- Patterns of population distribution in the world (p. 7) — the way people are spaced over the earth’s surface, the 90 per cent on 10 per cent fact, and the ten most populous countries.
- Density of population (p. 8) — the ratio of people to land, measured in persons per sq km.
- The three factor groups (pp. 8-9) — geographical, economic, and social and cultural reasons for uneven distribution.
- Population growth and its basic terms (p. 9) — growth, growth rate, natural growth, actual growth, positive and negative growth.
- CBR and CDR (p. 9) — the crude birth rate and crude death rate formulas, both expressed per thousand.
- Migration (p. 9) — place of origin and destination, immigrants and emigrants, push and pull factors.
- Demographic transition (p. 10) — the three-stage model from high-high to low-low rates.
- Population control measures (p. 11) — family planning, the chapter’s control measures, and Malthus’ 1798 warning.
- A closing exercise set (pp. 11-12) — objective, short-answer, distinction and long-answer questions, plus a map skill and a project activity.
Key Concepts of The World Population Chapter
This chapter asks why people live where they live, how geography measures crowding, and how and why populations change. Each idea below is what the chapter actually teaches, with the textbook page you will find it on.
Population Distribution: The Uneven 90-10 Pattern
Distribution is the way people are spaced over the earth’s surface, and the first fact the chapter gives is how uneven that spacing is (NCERT, p. 7).
- About 90 per cent of the world’s population lives on about 10 per cent of its land area.
- The ten most populous countries contribute about 60 per cent of the world’s population, and six of those ten are in Asia.
- George B. Cressey’s remark about Asia — many places where people are few, and few places where people are very many — is true of the world as a whole.
Fig 2.1 on the same page shows those ten countries; the figure walkthrough below reads it for you.

Density of Population: A Ratio, Not a Headcount
Each unit of land has a limited capacity to support the people living on it, so geography measures the ratio of people to land — not the raw headcount (NCERT, p. 8).
\[ \text{Density of Population} = \frac{\text{Population}}{\text{Area}} \]
The result is measured in persons per sq km.
Worked example (original values): a region of 250 sq km holds 5,00,000 people.
\[ \text{Density} = \frac{5,00,000}{250} = 2,000 \]
Final answer: 2,000 persons per sq km.
The number tells you how crowded the land is, not how many people live there. A small, crowded region and a large, empty one can easily have different densities and similar populations.
Why Population Is Uneven: Geographical, Economic and Social Factors
People cluster where life and work are easy and avoid places where life is hard; the chapter sorts the reasons into three factor groups (NCERT, pp. 8-9).
- Geographical factors: availability of fresh water (river valleys are among the most densely populated areas of the world); landforms (flat plains and gentle slopes win over mountains — the Ganga plains versus the Himalayas); climate (comfortable, low seasonal variation attracts, as in the Mediterranean); and fertile loamy soils that support intensive agriculture.
- Economic factors: mineral deposits draw industry and workers (the Katanga-Zambia copper belt in Africa); urbanisation offers jobs, education, medical care, transport and civic amenities, so mega cities keep attracting migrants; industrial belts such as the Kobe-Osaka region of Japan pull in factory workers and service providers alike.
- Social and cultural factors: religious or cultural significance attracts people; social and political unrest pushes them away; governments sometimes offer incentives to settle sparsely populated or overcrowded regions.
CBR and CDR: The Two Rate Formulas
Births and deaths are two of the three components of population change, and geography measures them as rates per thousand people so that a large and a small place can be compared fairly (NCERT, p. 9).
\[ \text{CBR} = \frac{B}{P} \times 1000 \]
Here CBR is the crude birth rate, B is the number of live births during the year, and P is the estimated mid-year population of the area.
Worked example (original values): a town of 50,000 people records 900 live births in a year.
\[ \text{CBR} = \frac{900}{50,000} \times 1000 = 18 \]
Final answer: 18 live births per thousand people.
\[ \text{CDR} = \frac{D}{P} \times 1000 \]
Here CDR is the crude death rate and D is the number of deaths in the year, again divided by the estimated mid-year population.
Worked example (original values): a district of 2,00,000 people records 1,600 deaths in a year.
\[ \text{CDR} = \frac{1,600}{2,00,000} \times 1000 = 8 \]
Final answer: 8 deaths per thousand people.
The per thousand unit is part of each formula — CBR and CDR are never written as percentages. Note also the chapter’s point that population grows not only from more births but also from fewer deaths: the death rate plays an active role in population change.
Migration: Push Factors, Pull Factors, Immigrants and Emigrants
Besides births and deaths, people themselves move — and one move changes two places at once (NCERT, p. 9).
- The place people move from is the place of origin (population falls); the place they move to is the place of destination (population rises).
- Migration may be permanent, temporary or seasonal, and may run rural to rural, rural to urban, urban to urban, or urban to rural.
- The same person is both an immigrant (moving into a new place) and an emigrant (moving out of the old place).
- Push factors make the origin less attractive: unemployment, poor living conditions, political turmoil, unpleasant climate, natural disasters, epidemics, socio-economic backwardness.
- Pull factors make the destination more attractive: better job opportunities and living conditions, peace and stability, security of life and property, pleasant climate.
- The chapter’s own insight: migration is a spontaneous effort to achieve a better balance between population and resources.
Demographic Transition: Why Growth Slows as Societies Change
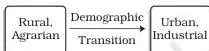
Demographic transition theory describes how a population shifts from high births and high deaths to low births and low deaths as a society moves from rural, agrarian and illiterate to urban, industrial and literate (NCERT, p. 10).
| Stage | Fertility and mortality | What happens to population |
|---|---|---|
| Stage 1 | Both high — people reproduce more to compensate for deaths from epidemics and variable food supply | Growth is slow; high births are cancelled by high deaths |
| Stage 2 | Fertility stays high at first, then declines; mortality falls with better sanitation and health | The gap between high births and falling deaths gives the highest net addition — the fastest growth |
| Stage 3 | Both rates decline considerably | Population is stable or grows slowly; family size is deliberately controlled |
Two cautions from the chapter: growth is fastest in stage two, not stage one, and two hundred years ago all countries of the world were in stage one. Fig 2.2 shows the model and is read in the figure walkthrough below.
Population Control Measures and the Malthus Warning
The chapter closes with how societies deliberately limit population growth (NCERT, p. 11).
- Family planning is the spacing or preventing of the birth of children; access to such services limits population growth and improves women’s health.
- The chapter’s control measures: propaganda, free availability of contraceptives, and tax disincentives for large families.
- Thomas Malthus in his theory (1798) stated that the number of people would increase faster than the food supply; any further increase would end in a population crash caused by famine, disease and war.
- Malthus held that preventive checks are better than physical checks — deliberate human choices to limit births beat the disasters that limit population after the fact.
The chapter ties this to sustainability: for the sustainability of our resources, the world will have to control rapid population increase. The Malthus figure is shown and read in the walkthrough below.
Figure Walkthrough: Reading the Maps and Models in This Chapter
Each figure in this chapter holds a fact the text repeats, so learning to read them means the whole argument comes back from the diagrams. The walkthrough below teaches each one.
Reading Fig 2.1: Most Populous Countries (NCERT page 7)
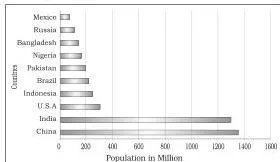
Fig 2.1 shows the ten most populous countries of the world. The chapter pairs this map with two facts: together these ten contribute about 60 per cent of the world’s population, and six of the ten are in Asia. The book’s own task is to identify those six Asian countries — try to find them on the map before you check an atlas.
Reading Fig 2.2: Demographic Transition Theory (NCERT page 10)
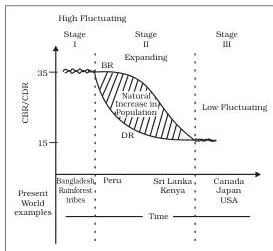
Fig 2.2 lays out the demographic cycle in three stages. In stage one the two rates are high and close together, so growth is slow — the chapter’s warning is not to read this stage as high growth.
In stage two deaths fall while births stay high for a time, and the gap between them is exactly the high net addition to population: this is where growth is fastest. In stage three both rates are low and close again, so the population is stable or grows slowly.
The chapter’s closing thought — that human beings are extremely flexible and adjust their fertility — is what the shift between stages demonstrates.
Reading the Malthus Figure: The 1798 Warning (NCERT page 11)

The Malthus figure carries the chapter’s key warning: Thomas Malthus in his theory (1798) stated that the number of people would increase faster than the food supply. His point is that unchecked growth must end badly — the population crash comes through famine, disease and war.
The chapter prefers preventive checks, the deliberate human choices that limit births, over physical checks, the disasters that limit population after the fact. This figure anchors the final argument: for the sustainability of resources, the world has to control rapid population increase.
Definitions: The Population Vocabulary You Must Keep Separate
The chapter defines six growth terms that differ by one word each, and keeping them apart is the whole game (NCERT, p. 9).
| Term | What it means | How it differs |
|---|---|---|
| Growth of population | Change of population in a particular area between two points of time | Expressed in absolute numbers (persons) |
| Growth rate of population | The same change expressed as a percentage | Percentage form of the same change |
| Natural growth | Births minus deaths | Ignores migration completely |
| Actual growth | Births minus deaths plus in-migration minus out-migration | The only one that includes migration |
| Positive growth | Birth rate above death rate, or people migrating permanently into a region | Population is rising |
| Negative growth | Population decreases — birth rate below death rate, or people migrating out | Population is falling |
Migration terms work the same way. A migrant moving into a new place is an immigrant; that same person, seen from the place they left, is an emigrant — one move makes the same person both, depending on which place you stand in (NCERT, p. 9). And the three components of population change are always births, deaths and migration.
| Push factors (make the origin unattractive) | Pull factors (make the destination attractive) |
|---|---|
| Unemployment, poor living conditions, political turmoil, unpleasant climate, natural disasters, epidemics, socio-economic backwardness | Better job opportunities and living conditions, peace and stability, security of life and property, pleasant climate |
Common Mistakes Students Make in This Chapter
Six errors recur in this chapter, and each is easy to fix once it has a name.
| Mistake | Correct rule | How to check your answer |
|---|---|---|
| Mixing natural growth with actual growth | Natural = births − deaths; actual = births − deaths + in-migration − out-migration (NCERT, p. 9) | Does your formula contain migration? If yes, it is actual growth, not natural. |
| Reading density as the total population | Density = population ÷ area, in persons per sq km (NCERT, p. 8) | Did you divide by area? A number with no division is a population size. |
| Confusing immigrant and emigrant | The same person is both — immigrant to the destination, emigrant from the origin (NCERT, p. 9) | Moving into the place = immigrant; moving out = emigrant. |
| Swapping push and pull factors | Medical and educational facilities are pull factors, because cities offer them (NCERT, p. 9) | Push = reasons to leave the origin; pull = attractions of the destination. |
| Calling stage one of demographic transition high-growth | Stage one is slow — high deaths cancel high births; growth is fastest in stage two (NCERT, p. 10) | If death rates are also high, growth cannot be fast. |
| Writing CBR and CDR as percentages | Both are rates per thousand of the mid-year population — the ×1000 is part of the formula (NCERT, p. 9) | A rate of 18 means 18 per thousand, not 18 per cent. |
The push-pull swap is worth extra care because the chapter’s own objective question tests it: medical and educational facilities are listed among what cities offer, which makes them pull factors, not push factors (NCERT, pp. 9, 11).
Exam Notes: How the Chapter’s Own Exercises Test These Ideas
The chapter ends with its own question set, and every question tests one of the ideas above — know which is which and your revision targets itself (NCERT, pp. 11-12).
| Exercise item | Concept it tests | What a full answer must include |
|---|---|---|
| Q1(i) MCQ — continent with highest growth | Population growth at the continental scale | Reason from the chapter’s growth discussion to eliminate the slower-growing continents. |
| Q1(ii) MCQ — not an area of sparse population | Recognising where people are actually dense | Spot which listed region is not sparse — the desert, equatorial and polar cases are the genuinely sparse ones named. |
| Q1(iii) MCQ — not a push factor | Push versus pull in a negative test | Medical and educational facilities are pull factors, so that option is the one that is not a push factor. |
| Q1(iv) MCQ — not a fact | Two “is it true?” traps | The tenfold rise in 500 years is stated in the chapter; “growth is high in stage one” contradicts it, so that is the not-a-fact. |
| Q2 — 30-word questions | Three geographical factors; why high-density areas exist; three components of change | Name any three of water, landforms, climate, soils; explain density through the factor groups; births, deaths and migration. |
| Q3 — distinguish | Birth rate versus death rate; push versus pull | Give CBR and CDR with their per-thousand rates; give the two factor lists with the chapter’s examples. |
| Q4 — 150-word questions | Factors influencing distribution and density; three stages of transition | Build the first from all three factor groups; describe each stage and why growth differs between them. |
| Map skill | Countries of Europe and Asia with negative growth rate | Read negative growth from the concepts on p. 9 and locate the countries on the outline map. |
| Project/activity | A family migration story; a report on your state’s distribution and density | Apply push/pull factors and the density ratio to real cases. |
Textbook contents and the examinable syllabus are not always identical — check the current official syllabus before deciding what to prepare.
The Whole Chapter in One Read: Distribution, Density and Growth
This condensation follows the chapter’s own argument from page 7 to page 11 — a one-minute read of the whole chapter.
- A country is known by its people — population is the real wealth that uses every other resource (p. 7).
- 90 per cent of the world’s people live on about 10 per cent of its land area (p. 7).
- The ten most populous countries hold about 60 per cent of the world’s population; six are in Asia (p. 7).
- Density of population = population ÷ area, measured in persons per sq km (p. 8).
- Distribution is explained by three factor groups — geographical, economic, social and cultural (pp. 8-9).
- Population change can be positive or negative, in absolute numbers or percentages (p. 9).
- Natural growth ignores migration; actual growth includes it (p. 9).
- CBR and CDR are rates per thousand of the mid-year population (p. 9).
- Migration moves people from place of origin to destination under push and pull factors (p. 9).
- Demographic transition runs in three stages from high-high to low-low; growth is slow in stage one and fastest in stage two (p. 10).
- Family planning and Malthus’ 1798 warning frame the case for controlling population growth (p. 11).
Related Resources: The Book, the Class Hub and Neighbouring Chapters
If you need the rest of the Class 12 Geography study material, these pages sit next to this chapter.
- the Class 12 Geography notes hub — chapter-wise notes for this subject.
- the Class 12 study hub — notes across all Class 12 subjects.
- CBSE Notes for all classes — the full notes directory.
- the previous chapter page — the chapter that precedes this one in the notes series.
- the next chapter page — the chapter that follows this one in the notes series.
Sources and Data Verification
This page describes the NCERT Class 12 Geography textbook Fundamentals of Human Geography, chapter 2, “The World Population: Distribution, Density and Growth”, official NCERT edition, reprint 2026-27, published at ncert.nic.in.
It covers that single chapter of that book, not the other Class 12 Geography books — India: People and Economy and Practical Work in Geography.
The listing is maintained for the 2026-27 academic session.
NCERT settles textbooks, editions and PDFs; CBSE settles curriculum, syllabus and examinations — and because textbook contents and the examinable syllabus are not always identical, check the current official syllabus.
Reference: NCERT Class 12 Geography textbook (Fundamentals of Human Geography), chapter 2, official edition on ncert.nic.in.
Frequently Asked Questions About The World Population Class 12
Here are the long-tail versions of the questions this chapter answers.
Why do 90 per cent of the world’s people live on only 10 per cent of the land area?
Because people settle where life is sustainable and work is possible: near fresh water, on flat and fertile land, in comfortable climates, and where cities and industries offer employment. Mountainous, extremely dry, very hot or very cold areas, and regions cut off by poor transport, stay thinly populated (NCERT, pp. 7-9).
What is the difference between natural growth and actual growth of population?
Natural growth is births minus deaths — it ignores migration. Actual growth is births minus deaths plus in-migration minus out-migration, so it is the one that accounts for people moving in and out of a region (NCERT, p. 9).
What is the difference between push factors and pull factors of migration?
Push factors make people want to leave the place of origin: unemployment, poor living conditions, political turmoil, unpleasant climate, natural disasters, epidemics, socio-economic backwardness. Pull factors make the destination attractive: better job opportunities and living conditions, peace and stability, security of life and property, pleasant climate (NCERT, p. 9).
Why is population growth slow in the first stage of demographic transition but fastest in the second stage?
In stage one both fertility and mortality are high, so the many births are cancelled by the many deaths and growth is slow. In stage two mortality falls — better sanitation and health conditions — while fertility stays high for a time, and the gap between high births and falling deaths is the high net addition to population (NCERT, p. 10).
What is the formula used to calculate the density of population?
Density of population equals population divided by area, measured in persons per sq km. A region of 250 sq km holding 5,00,000 people, for example, has a density of 2,000 persons per sq km (NCERT, p. 8).
Why is the same person both an immigrant and an emigrant?
Because the terms depend on viewpoint. A migrant who moves into a new place is an immigrant there; that same person, seen from the place they left, is an emigrant — one move, two labels (NCERT, p. 9).
Explore Class 12 Geography Books
Related chapters: