
International trade class 12 — Chapter 8 of the NCERT Geography book India: People and Economy — is a nine-page chapter on what India trades, with whom, through which ports and airports, and how that pattern has changed since 1950-51. The official NCERT PDF for this chapter is right below; the rest of this page is a guided tour of its tables, maps and exercises.
The chapter has no formulas. Its content is six tables and four labelled figures, so the skill it really teaches is reading percentage shares and port locations. Keep this page open beside the PDF and you will know what each section is doing before you read it.
Download International Trade Class 12 Chapter 8 PDF
This is the official NCERT chapter file, not a scanned copy or a third-party upload. If you are preparing international trade class 12 from the prescribed book, open the chapter from the source CBSE schools use so that every table value, figure label and exercise matches the printed edition.
Download the International Trade Class 12 Geography Chapter 8 PDF from the NCERT portal to keep the exact nine pages — including Tables 8.1 to 8.6 and Figures 8.1, 8.3, 8.4 and 8.5 — in front of you while you work.
| What the chapter holds | Count | Where it is used |
|---|---|---|
| Printed pages | 9 | |
| Figures with NCERT captions | 8 | |
| Tables | 6 | |
| Exercise questions | 3 | answered in our NCERT Solutions |
| Activities | 4 | |
| Official NCERT PDF | Download the chapter PDF | the chapter exactly as NCERT publishes it |
International Trade Chapter 8 at a Glance
The table below shows how much the chapter holds — its sections, tables, labelled figures, activities and exercise questions — so you can gauge the file before opening it.
What This Chapter Covers: Trade, Composition, Direction, Ports, Airports
This chapter looks at India’s international trade from four angles: what India trades, with whom, through which routes, and through which gateways. Each part of the chapter handles one of those angles.
- International Trade — the opening section frames the whole chapter. India’s external trade grew from Rs 1,214 crore in 1950-51 to Rs 77,19,796 crore in 2026-27, yet India still holds roughly one per cent of world trade. Imports have stayed higher than exports in every year the chapter’s table lists.
- Changing Pattern of the Composition of India’s Exports — manufactured goods dominate at 67.8 per cent of exports in 2026-27. Agriculture’s share is squeezed by tough international competition, while crude and petroleum products are gaining share.
- Changing Patterns of the Composition of India’s Import — food grains led imports in the 1950s, then petroleum took over after the 1973 oil crisis. Fuel’s share of imports rose to 31.6 per cent in 2026-27 while capital goods fell to 10.1 per cent.
- Direction of Trade — Table 8.6 shows region-wise imports led by Asia and ASEAN. The chapter states India’s aim to double its share in world trade within five years.
- Sea Ports as Gateways of International Trade — the longest section: 12 major and about 200 minor ports, the idea of a hinterland, and thirteen port facilities described from Kandla to Tuticorin.
- Airports — air cargo suits high-value and perishable goods. There were 25 major airports, and since 2017, 73 unserved or underserved airports — including 9 heliports and 2 water aerodromes — have been operationalised under the UDAN scheme.
The chapter closes with three exercise blocks: multiple-choice questions, five short answers of about 30 words, and two long answers of about 150 words.
Key Concepts: Composition, Trade Balance, Direction and Hinterland
These four ideas unlock every table in the chapter. Once you know what a trade balance is, Table 8.1 stops being a wall of numbers.
Composition of trade means the share each commodity group holds in exports or imports. It is read from Tables 8.2 and 8.4, which give percentage shares for the same groups across several years. A rising or falling percentage is the chapter’s main evidence that India’s trade pattern is changing.
Trade balance is exports minus imports. Table 8.1 prints a negative balance for every listed year from 2004-05 to 2026-27 — the largest, at −14,25,753 crore, in 2026-27. The chapter’s own phrase is that the value of imports continued to be higher than that of exports.
The opening section asks you to calculate the percentage growth in India’s foreign trade from 1950-51 to 2026-27. Here is that calculation worked from the chapter’s own figures.
Step 1: Find the increase in trade value.
\[ 77,19,796 – 1,214 = 77,18,582\ \text{crore} \]
Step 2: Divide the increase by the 1950-51 value.
\[ \frac{77,18,582}{1,214} \approx 6,358 \]
Step 3: Convert to a percentage.
\[ 6,358 \times 100 \approx 6,35,800\% \]
Final answer: India’s foreign trade grew by roughly 6,35,800 per cent between 1950-51 and 2026-27.
Direction of trade means which regions India trades with. Table 8.6 compares imports from each region in 2026-27 and 2026-27. Asia and ASEAN lead by a wide margin, and the growth gap between regions is striking.
Step 1: Asia and ASEAN imports rose from 15,44,520 to 29,18,577 crore.
\[ \frac{29,18,577 – 15,44,520}{15,44,520} \times 100 \approx 89\% \]
Step 2: Europe’s imports rose from 4,03,972 to 6,40,577 crore.
\[ \frac{6,40,577 – 4,03,972}{4,03,972} \times 100 \approx 59\% \]
Final answer: Between 2026-27 and 2026-27, imports from Asia and ASEAN grew by about 89 per cent, while imports from Europe grew by about 59 per cent — Asian imports grew roughly 30 percentage points faster.
The measures the chapter lists for raising India’s share in world trade are import liberalisation, reduction in import duties, delicensing, and a change from process to product patents.
Hinterland is the region a port serves — the area whose goods flow through it. The chapter warns that demarcating a hinterland is difficult because its boundary is not fixed over space, and one port’s hinterland often overlaps another’s.
Reading the Chapter’s Figures: Trade Gap, Ports and Air Routes
Four labelled figures carry the chapter’s visual argument. Learning to read them is most of the map skill this chapter expects.
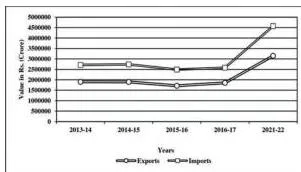
Figure 8.1 is the chapter’s summary picture. Imports run above exports in every year shown, and the gap between the two lines widens over time. Read it together with Table 8.1’s trade balance column: every listed year is negative, and 2026-27, with its printed balance of −14,25,753 crore, is the widest deficit of the five years shown.
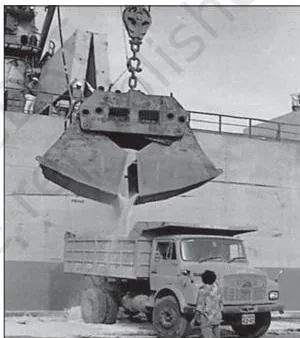
Figure 8.3 grounds the phrase “gateways of international trade”. A port’s job is to move goods between land and water, and the chapter notes that water is a cheap transport surface provided there is no turbulence. This photograph is the anchor for the entire ports section.
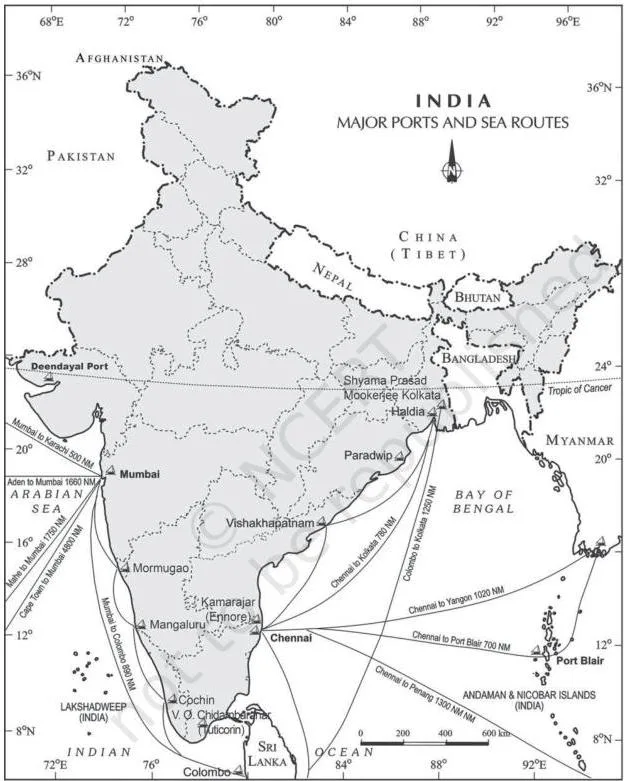
Figure 8.4 is the most important map in the chapter. Look for two things. First, the west coast has a denser cluster of ports, from Kandla down to Cochin. Second, the east coast forms a chain running from Kolkata in the north to Tuticorin in the south.
The sea routes drawn towards the Middle East, Europe and East Asia explain Mumbai’s advantage: it lies closer to the routes on which most of India’s overseas trade moves.
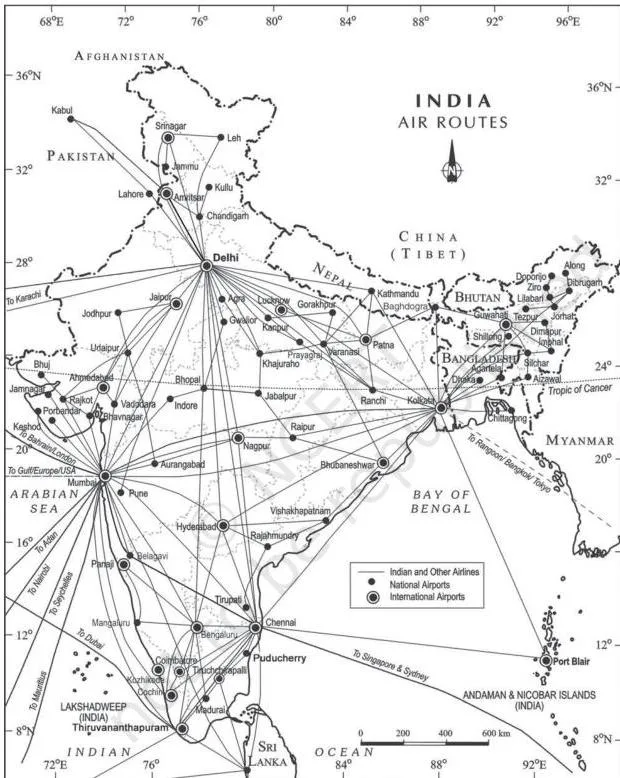
Figure 8.5 shows air routes converging on the big metros — Delhi, Mumbai, Kolkata and Chennai stand out as hubs. The chapter’s activity asks you to identify the four cities where the maximum number of air routes converge and to give reasons; the map itself supplies the first part of the answer.
Definitions: Port, Harbour, Hinterland and Satellite Port
The exercises test these terms directly, and the port-versus-harbour distinction is the one students find hardest. The difference: a harbour is the sheltered water body where ships can anchor safely, while a port is the facility with berths and machinery for loading and unloading cargo.
| Type of harbour | Feature | Chapter example |
|---|---|---|
| Natural harbour | Sheltered coast that needs little artificial protection | Mumbai, Cochin, Mormugao |
| Artificial harbour | Built with constructed protection where the coast offers little shelter | Chennai, built in 1859 |
| Riverine port | Port located inland on a river, not on the open coast | Kolkata, 128 km up the Hugli |
| Land-locked harbour | Inland harbour joined to the sea by a channel cut through solid rock and sand | Visakhapatnam |
Hinterland — the region a port serves. The chapter is explicit that its boundary is not fixed over space and that hinterlands often overlap, so demarcation is difficult.
Satellite port — a port built near an existing port to absorb some of its traffic. The chapter’s examples: Jawaharlal Nehru Port at Nhava Sheva for Mumbai, Haldia for Kolkata, and Kamarajar (Ennore) and V.O. Chidambaranar (Tuticorin) for Chennai.
Major versus minor ports — the central government decides policy and regulates the 12 major ports; state governments regulate the minor ones. The major ports handle the larger share of total traffic.
Composition versus direction — composition answers what is traded (commodity groups); direction answers with whom (regions and countries).
Activities in the Chapter and What They Practise
The chapter uses four activities to push you to calculate and reason from the tables — the same skills the 30-word and 150-word answers need.
- Bar diagram of export trends from Table 8.2 — practises reading percentage shares of each commodity group across years.
- Bar diagram of principal exports from Table 8.3 — practises reading value-based export data for 2026-27.
- Multiple bar diagram of trading partners using Table 8.6 — practises comparing regions; it follows the chapter’s note that most trade moves by sea and air, with only a small portion by land to Nepal, Bhutan, Bangladesh and Pakistan.
- Import tasks from Table 8.5 — arrange items in ascending or descending order, select the five most important, represent them in a bar diagram, and identify items for which substitutes can be developed in India.
The edible oil question. The chapter asks why India imports edible oil despite being an agriculturally rich country. The chapter’s own Table 8.5 shows edible oils among the largest import items — only petroleum, oil and lubricants, non-ferrous metals, chemical products, and pearls and precious stones have higher printed values.
The chapter links rising imports generally to growing industrialisation and a better standard of living, and it invites you to think about import substitution: which of these items could be produced more in India?
The two-coast port question. The chapter asks you to find reasons for the variation in port location along the two coasts. Its own descriptions supply the answer: the west coast has natural harbours such as Mumbai, Cochin and Mormugao, while the east coast is handicapped by shallow waters near Chennai and silt accumulation in the Hugli near Kolkata.
Common Mistakes Students Make in This Chapter
This chapter trips students on specific, predictable points. Naming them in advance is the fastest way to avoid them.
| Mistake | Correct rule | How to check your answer |
|---|---|---|
| Choosing Haldia or Mumbai as the land-locked harbour | Visakhapatnam is the land-locked harbour, connected to the sea by a channel cut through solid rock and sand | Ask: is the port on an open coast, a river, or inland behind a cut channel? |
| Answering “sea” for India’s main trade route | The chapter’s answer is sea and air; only a small portion of trade moves by land | Re-read the chapter’s note beside the trading-partners activity |
| Treating hinterland boundaries as fixed | The hinterland is not fixed over space, and hinterlands of different ports overlap | The chapter says demarcation is difficult — that is the point to quote |
| Reading a falling percentage share as a falling value | A share can fall while the actual value rises — manufactured goods fell from 72.9 per cent to 67.8 per cent | Separate “share of exports” from “value of exports” in your sentence |
| Transposing the two coasts | Cochin is on the west (Arabian Sea) coast; V.O. Chidambaranar (Tuticorin) is on the east | Put a finger on Figure 8.4 and trace the coastlines |
| Quoting 13 major ports | The chapter states 12 major ports but describes thirteen facilities, counting Kolkata and Haldia separately | Quote the chapter’s stated number, 12 |
How to Answer the Chapter’s Exercise Questions
The chapter’s three exercise blocks map directly onto its sections, so knowing that map is the fastest way to prepare. Write the short answers first, then the two long answers.
Question 1 — three MCQs.: (i) Trade between two countries is international trade. (ii) The land-locked harbour is Visakhapatnam. (iii) Most of India’s foreign trade is carried through sea and air.
Question 2 — five answers of about 30 words.: Each answer needs two or three precise points:
- Characteristics of India’s foreign trade: growth from Rs 1,214 crore to Rs 77,19,796 crore; imports exceeding exports; roughly one per cent of world trade; and a changed composition and direction over the years.
- Port versus harbour: harbour is the sheltered water body; port is the facility with berths and loading equipment.
- Hinterland: the region a port serves; its boundary is not fixed and may overlap another port’s hinterland.
- Important imports: petroleum products, pearls and precious stones, non-ferrous metals, chemical products, edible oils and fertilisers — in the order of the values printed in Table 8.5.
- East-coast ports: Kolkata (with Haldia), Paradwip, Visakhapatnam, Chennai, Kamarajar (Ennore) and V.O. Chidambaranar (Tuticorin), from north to south.
Use the mnemonic “Kittens Play Very Carefully Every Time” to recall the east coast order: Kolkata-Haldia, Paradwip, Visakhapatnam, Chennai, Ennore (Kamarajar), Tuticorin (V.O. Chidambaranar).
Question 3 — two answers of about 150 words.: For the composition of exports and imports, quote at least two percentages (manufactured goods at 67.8 per cent of exports, fuel at 31.6 per cent of imports) and name specific items from Tables 8.3 and 8.5. For the changing nature of India’s international trade, use the chapter’s arc: the food-grain crisis of the 1950s made foodgrains the major import; the Green Revolution ended food-grain imports; the 1973 oil crisis pushed up the petroleum bill; and today engineering goods and gems and jewellery lead a growing export basket, while imports still exceed exports.
One honest caution: textbook contents and the examinable syllabus are not always identical — check the current official CBSE syllabus for what is examinable this year.
The Chapter’s Key Points in Brief
This chapter prints no closing summary, so this digest collects the section contents in our own words.
- India’s foreign trade grew from Rs 1,214 crore in 1950-51 to Rs 77,19,796 crore in 2026-27 — a rise of about 6,35,800 per cent.
- India contributes roughly one per cent of world trade, and imports have exceeded exports in every year the chapter lists.
- Exports: manufactured goods lead at 67.8 per cent; agriculture is squeezed by international competition; petroleum products rose to 16.4 per cent.
- Imports: fuel-led, with fuel at 31.6 per cent, while capital goods declined to 10.1 per cent.
- Direction of trade: imports from Asia and ASEAN dominate and are growing faster than imports from Europe.
- India aims to double its share in world trade using import liberalisation, lower import duties, delicensing and product patents.
- India has 12 major and about 200 minor ports; port cargo capacity grew from 20 million tonnes in 1951 to over 837 million tonnes in 2016.
- The east coast ports form a chain from Kolkata to Tuticorin; the west coast ports sit in natural harbours such as Mumbai, Cochin and Mormugao.
- Airports handle high-value and perishable goods; 25 major airports were functioning, and since 2017, 73 unserved or underserved airports — including 9 heliports and 2 water aerodromes — have been operationalised under UDAN.
Related Resources
Reference: NCERT Class 12 Geography textbook, chapter 8, official edition on ncert.nic.in.
Continue with the other chapters of the same book. The chapter itself points you to the previous chapter on transport and communication for the main features of air transport in India. The CBSE notes hub collects study material by subject, and the Class 12 Geography notes page groups the geography chapters together.
For everything else in the year, start from the Class 12 study resources page. A later chapter, Geographical Perspective on Selected Issues and Problems, takes up the environmental consequences of the economic activity this chapter describes. The official NCERT portal, ncert.nic.in, is the authoritative source for the textbook PDFs.
Sources and Data Verification
This page describes the NCERT Class 12 Geography textbook India: People and Economy, Chapter 8, “International Trade”, official edition on ncert.nic.in. It covers that one chapter only, not the full CBSE Class 12 Geography syllabus.
The listing is maintained for the current academic session using the NCERT information available to us. NCERT settles textbook content, editions and PDFs; CBSE settles curriculum, syllabus and examinations. Because the two are set by different authorities, textbook contents and the examinable syllabus are not always identical — check the current official CBSE syllabus.
Frequently Asked Questions on International Trade
What is the difference between a port and a harbour?
A harbour is the sheltered water body where ships can anchor safely. A port is the facility built there — with berths and equipment — for loading and unloading cargo. The chapter’s harbour types (natural, artificial, riverine, land-locked) describe the shelter; the port descriptions talk about berths, cargo and hinterland.
Which are the major ports on the east coast of India?
From north to south: Shyama Prasad Mookerjee (Kolkata) with its satellite Haldia, Paradwip in Odisha, Visakhapatnam in Andhra Pradesh, and Chennai, Kamarajar (Ennore) and V.O. Chidambaranar (Tuticorin) in Tamil Nadu.
Why is Visakhapatnam called a land-locked harbour?
Because it is not on the open coast. Visakhapatnam is connected to the sea by a channel cut through solid rock and sand, which is the chapter’s defining feature of a land-locked harbour. That is also why it is the correct answer in the chapter’s MCQ.
Why does the west coast of India have more ports than the east coast?
The chapter’s own descriptions point to physical reasons. The west coast has natural harbours — Mumbai, Cochin and Mormugao. The east coast has problems: shallow waters near Chennai and silt accumulation in the Hugli near Kolkata, which reduce the number of good natural sites.
Which is the largest container port in India?
Jawaharlal Nehru Port at Nhava Sheva. It was developed as a satellite port to relieve pressure at Mumbai, and the chapter states it is the largest container port in India.
Why does India import more than it exports?
The chapter’s trade balance table shows a deficit in every listed year. The main push came after the 1973 energy crisis, which raised the petroleum import bill. Imports also serve industry — petroleum is used both as fuel and as an industrial raw material — so rising industrialisation and a better standard of living keep import value above export value.
Explore Class 12 Geography Books
- Previous: Transport and Communication
- Next: Geographical Perspective on Selected Issues and Problems
Related chapters: