
This is Chapter 3 of the NCERT Class 12 Geography textbook India: People and Economy — “Land Resources and Agriculture” — about 20 printed pages of land resources class 12 material: the nine land-use categories, how land use changed between 1950–51 and 2026-27, cropping seasons, the major crops of India, agricultural development and the problems Indian agriculture faces.
The official NCERT PDF for this chapter is linked right below; the rest of this page explains what the chapter contains, section by section, using the book’s own figures.
If you want the complete chapter text, tables and distribution maps in a single official file, download the land resources class 12 NCERT chapter 3 PDF from ncert.nic.in — it is the same file the printed textbook is made from.
| What the chapter holds | Count | Where it is used |
|---|---|---|
| Printed pages | 20 | |
| Figures with NCERT captions | 19 | |
| Tables | 2 | |
| Exercise questions | 3 | answered in our NCERT Solutions |
| Activities | 4 | |
| Official NCERT PDF | Download the chapter PDF | the chapter exactly as NCERT publishes it |
Land Resources Class 12: Chapter 3 at a Glance
The table below lists the contents of the official chapter PDF at a glance — its sections, figures, tables, activities and exercise questions.
In substance, the chapter moves through the nine land-use categories recorded in land revenue records, the land-use shift between 1950–51 and 2026-27, common property resources, cropping intensity, cropping seasons and types of farming, crop-by-crop accounts from rice to coffee, agricultural development, the problems of Indian agriculture, and a closing exercise set.
What This Chapter Covers: From Land Records to Agricultural Problems
The chapter is built like a journey: it starts with land as a fixed resource, moves to how India records and changes land use, then to agriculture — the dominant land use — and finally to how agriculture developed and the problems it faces. That order matters for revision.
- The nine land-use categories maintained in land revenue records.
- How land use changed between 1950–51 and 2026-27.
- Common property resources and who depends on them.
- Agricultural land use, total cultivable land and cropping intensity.
- Cropping seasons (kharif, rabi, zaid) and types of farming.
- The major crops of India — foodgrains, oilseeds, fibres and plantation crops.
- Agricultural development from the Green Revolution to the National Mission for Sustainable Agriculture.
- Problems of Indian agriculture.
- A closing exercise set with five MCQs and short and long answer questions.
The parts most often asked about are the land-use categories, the cropping seasons, the leading crop-producing states and the problems list — all four appear in the chapter’s own exercises.
The Nine Land Use Categories and the Time Thresholds That Separate Them
These categories are the chapter’s foundation. The land revenue department maintains them, and they add up to the reporting area — the area India’s land-use statistics are calculated on. Two measurement concepts come first:
- Geographical area is measured by the Survey of India and stays fixed; it does not change.
- Reporting area comes from land revenue records and shifts somewhat with their estimates.
So the same country can show two different “areas.” Remember which one the chapter’s percentages use — every percentage in Fig. 3.1 is of the reporting area.
The table sorts all nine categories. Read the third column closely: the three categories that deal with left-uncultivated land are distinguished purely by time.
| Land-use category | What it means | Threshold that matters |
|---|---|---|
| Forests | Area the government has identified and demarcated for forest growth | No time rule; can rise without any increase in actual forest cover |
| Barren and Wastelands | Barren hilly terrain, desert lands, ravines | Cannot normally be brought under cultivation with available technology |
| Land put to Non-agricultural Uses | Settlements, roads, canals, industries, shops | Grows with expansion of secondary and tertiary activities |
| Permanent Pastures and Grazing Lands | Mostly owned by panchayat or government | Panchayat-owned portion is a Common Property Resource |
| Miscellaneous Tree Crops and Groves | Orchards and fruit trees; not included in net sown area | Mostly privately owned |
| Culturable Wasteland | Land left fallow beyond five years | More than 5 years fallow; reclaimable through reclamation |
| Current Fallow | Land left uncultivated for one agricultural year or less | 1 year or less; fallowing lets the land recoup fertility |
| Fallow other than Current Fallow | Cultivable land left uncultivated for more than one year | Between 1 and 5 years; beyond 5 it becomes culturable wasteland |
| Net Area Sown | Physical extent of land on which crops are sown and harvested | The ninth category — the actual cropped physical extent |
Common property resources (CPRs) are owned by the state and meant for community use. They provide fodder, fuel and minor forest products, and matter most for landless and marginal farmers and for women, who do most of the fodder and fuel collection in rural areas.
In the chapter’s definition, a CPR is a community’s natural resource where every member has the right of access and use with specified obligations, but nobody has property rights over it. Examples are community forests, pasture lands and village water bodies.
Trap: “marginal land” is not one of the nine categories — exercise question 1(i) tests exactly this.
Land Use in India: What Grew and What Shrank Between 1950-51 and 2026-27
Land is fixed while the economy changes, so land use must change too. The chapter names three kinds of economic change that affect land: the size of the economy grows, its composition shifts toward secondary and tertiary activities, and the pressure on agricultural land stays because the farm-dependent population falls slowly while the number of mouths to feed rises.

Two rules help you read this chart. First, all percentages are of the reporting area. Second, because even the reporting area has stayed nearly constant, a rise in one category usually means a fall in another.
Five categories increased:
- Forest category — the increase is in demarcated area, not actual forest cover.
- Non-agricultural uses — the fastest increase, because industry, services, infrastructure and settlements are expanding at the expense of wastelands and agricultural land.
- Permanent pastures and grazing land — up; the chapter records the rise but adds no separate reason for it.
- Current fallow — fluctuates a great deal with rainfall variability and cropping cycles.
- Net area sown — a recent rise from bringing culturable wasteland under cultivation; earlier it was slowly declining, mostly into non-agricultural use.
Four categories declined:
- Barren and wasteland — pressure on land from both agricultural and non-agricultural sectors.
- Culturable wasteland — the same pressure.
- Tree crops and groves — pressure from agricultural land demand.
- Fallow other than current fallow — declined with the group; the book’s explanations centre on the two wasteland categories and tree crops.
The chapter’s Activity asks a sharp question: what is the difference between actual increase and rate of increase? Actual increase is the simple difference between the two years; rate of increase uses the simple growth rate formula, (terminal value − base value) ÷ base value × 100. The next section works a full example.
Agricultural Land Use: Total Cultivable Land and Cropping Intensity
Land matters more to agriculture than to any other sector for three reasons: agriculture is a purely land-based activity, land quality directly drives agricultural productivity, and in rural areas land ownership carries social value, credit security and status.
Total cultivable land = net sown area + all fallow lands + culturable wasteland. The chapter’s Table 3.1, reproduced below, tracks this stock.
| Agricultural land-use categories | % of reporting area, 1950-51 | % of reporting area, 2026-27 | % of total cultivable land, 1950-51 | % of total cultivable land, 2026-27 |
|---|---|---|---|---|
| Culturable Waste land | 8.0 | 3.9 | 13.4 | 6.8 |
| Fallow other than Current Fallow | 6.1 | 3.7 | 10.2 | 6.4 |
| Current Fallow | 3.7 | 4.5 | 6.2 | 7.8 |
| Net Area Sown | 41.7 | 45.6 | 70.0 | 79.0 |
| Total Cultivable Land | 59.5 | 57.7 | 100.00 | 100.00 |
Watch the bottom row: total cultivable land fell marginally from 59.5% to 57.7% of reporting area. The scope for adding new cultivated land is limited, so the chapter argues India must adopt land-saving technologies instead.
One such technology is raising cropping intensity (CI), calculated as:
\[ \text{Cropping Intensity in }\% = \frac{\text{GCA}}{\text{NSA}} \times 100 \]
Here NSA (net sown area) is the physical extent of land sown once, while GCA (gross cropped area) counts every sowing in a year — the same plot sown with two crops counts twice. That is why CI can exceed 100%.
Worked example with new numbers:
Step 1: A district has a net sown area of 4.2 lakh hectares, and farmers raise crops on 5.6 lakh hectare-equivalents in one agricultural year.
\[ CI = \frac{5.6}{4.2} \times 100 = 1.333 \times 100 = 133.3\% \]
Final answer: The district’s land is used like 1.33 times its physical extent because of multiple cropping.
Growth-rate example with new numbers:
Step 1: Net sown area was 38% of reporting area in the base year and 44% in the terminal year.
\[ \frac{44-38}{38} \times 100 = \frac{6}{38} \times 100 \approx 15.8\% \]
Final answer: The rate of increase of net sown area is about 15.8%.
Why does high cropping intensity suit India? The country is land scarce but labour abundant. Growing more crops per unit of land raises output from limited land while also absorbing more rural labour — it cuts underemployment as well as raising production.
Cropping Seasons in India: Kharif, Rabi and Zaid
A cropping season is a period of the agricultural year defined by the moisture and temperature available. Northern and interior India have three distinct seasons; southern India does not.
- Kharif (June–September) — coincides with the southwest monsoon; grows tropical crops such as rice, cotton, jute, jowar, bajra and tur.
- Rabi (October–March) — winter; low temperatures suit temperate and subtropical crops such as wheat, gram and mustard.
- Zaid (April–June) — a short summer season after rabi; watermelons, cucumbers, vegetables and fodder are grown on irrigated land.
The exception matters: in southern India this seasonal split does not exist. Temperatures stay high enough all year, so the same crops can be grown three times in an agricultural year if soil moisture is sufficient.
| Cropping season | Months | Northern states grow | Southern states grow |
|---|---|---|---|
| Kharif | June–September | Rice, Cotton, Bajra, Maize, Jowar, Tur | Rice, Maize, Ragi, Jowar, Groundnut |
| Rabi | October–March | Wheat, Gram, Rapeseeds and Mustard, Barley | Rice, Maize, Ragi, Groundnut, Jowar |
| Zaid | April–June | Vegetables, Fruits, Fodder | Rice, Vegetables, Fodder |
Types of Farming: Irrigated, Dryland and Wetland
The chapter classifies farming by its main source of moisture: irrigated or rainfed (barani). Irrigated farming then splits by objective.
- Protective irrigation — supplements rainfall to protect crops from moisture deficiency; water is spread over the maximum possible area.
- Productive irrigation — supplies full water through the cropping season for high productivity; water input per unit area is higher.
Rainfed farming splits by the adequacy of soil moisture during the cropping season into dryland and wetland farming.
| Aspect | Dryland farming | Wetland farming |
|---|---|---|
| Rainfall | Annual rainfall below 75 cm | Rainfall in excess of plant needs in the rainy season |
| Crops | Hardy, drought-resistant: ragi, bajra, moong, gram, guar | Water-intensive: rice, jute, sugarcane; aquaculture in freshwater bodies |
| Main risks | Drought; countered by soil moisture conservation and rainwater harvesting | Floods and soil erosion |
| Regions | Dry tracts of central and western India | High-rainfall areas such as eastern India |
Correct the likely confusion: dryland farming does not mean desert farming. It simply means the region receives less than 75 cm of rain a year.
Foodgrains of India: Rice, Wheat, Coarse Cereals and Pulses
Foodgrains occupy about two-thirds of India’s cropped area, so the book treats them first. Cereals alone take about 54%, and India produces about 11% of the world’s cereals, ranking third after China and the USA. Cereals split into fine grains (rice, wheat) and coarse grains (jowar, bajra, maize, ragi).
Rice
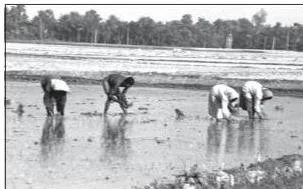
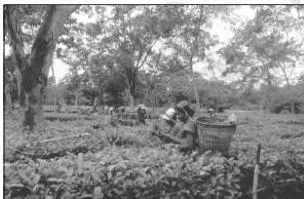
The photo shows rice as it is actually established in southern India — seedlings raised in a nursery and transplanted into standing water, the method behind the region’s two or three rice crops a year. Rice is the staple food of the overwhelming majority of Indians.
- About one-fourth of total cropped area; 22.07% of world production — second after China (2018).
- Leading states: West Bengal, Uttar Pradesh, Punjab. In West Bengal farmers grow three crops — aus, aman and boro.
- High yield in Punjab, Tamil Nadu, Haryana, Andhra Pradesh, Telangana, West Bengal and Kerala; low yield in rainfed Madhya Pradesh, Chhattisgarh and Odisha.
- Punjab and Haryana are not traditional rice areas — rice reached them in the 1970s after the Green Revolution, using irrigation and improved seeds.
Wheat
Wheat is the second most important cereal. It is a temperate crop grown in the rabi season, and about 85% of its area lies in the north and central regions — the Indo-Gangetic Plain, the Malwa Plateau and the Himalayas up to 2,700 m altitude.
- About 14% of cropped area; 12.8% of world production (2017).
- Leading states: Uttar Pradesh, Madhya Pradesh, Punjab, Haryana, Rajasthan.
- Yield above 4,000 kg per hectare in Punjab and Haryana; low yield where it is rainfed in Madhya Pradesh, Himachal Pradesh and Jammu and Kashmir.
Coarse cereals
Together the coarse cereals occupy about 16.5% of cropped area. Each has a one-line identity:
- Jowar (sorghum) — 5.3% of cropped area; the main food crop of semi-arid central and southern India; Maharashtra alone produces more than half of India’s output.
- Bajra — 5.2%; a hardy crop that resists dry spells in the hot, dry northwest and west; leading states Rajasthan, Maharashtra, Gujarat, Uttar Pradesh and Haryana.
- Maize — 3.6%; a food and fodder crop grown all over India except Punjab and the eastern and north-eastern regions; lead by Karnataka, Madhya Pradesh, Bihar and others.
Pulses
Pulses are rich in protein and are legume crops that raise soil fertility through nitrogen fixation. They occupy about 11% of cropped area, mostly in the drylands of the Deccan, central plateaus and northwest, so yields are low and fluctuate.
- Gram — 2.8%; a rabi crop displaced by wheat in Haryana, Punjab and northern Rajasthan after the Green Revolution; lead by Madhya Pradesh, Uttar Pradesh, Maharashtra and Rajasthan.
- Tur (Arhar) — 2%; red gram or pigeon pea, grown on marginal land under rainfed conditions; Maharashtra contributes about one-third of production.
The chapter’s Activity here is physical: mix different grains and separate cereals from pulses, then fine from coarse cereals — doing it once makes the classification unforgettable.
Oilseeds, Fibre Crops and Plantation Crops
These groups supply edible oils, cloth, sacks and beverages, and each carries famous world-rank facts that examiners reuse. The crop-by-crop table below maps every major crop to its season, leading states and share of cropped area.
| Crop | Season | Share of cropped area | Leading states | Notable fact |
|---|---|---|---|---|
| Rice | Kharif; two or three crops in south and West Bengal | About 25% | West Bengal, Uttar Pradesh, Punjab | 2nd in world, 22.07% (2018) |
| Wheat | Rabi | About 14% | Uttar Pradesh, Madhya Pradesh, Punjab, Haryana, Rajasthan | Yield above 4,000 kg/ha in Punjab, Haryana |
| Jowar | Kharif and rabi in south; kharif fodder in north | 5.3% | Maharashtra (over half), Karnataka, Madhya Pradesh, Andhra Pradesh, Telangana | Main food crop of semi-arid regions |
| Bajra | Kharif | 5.2% | Rajasthan, Maharashtra, Gujarat, Uttar Pradesh, Haryana | Hardy, drought-resistant |
| Maize | Kharif | 3.6% | Karnataka, Madhya Pradesh, Bihar, Andhra Pradesh, Telangana, Rajasthan, Uttar Pradesh | Food and fodder; absent from Punjab and east/north-east |
| Gram | Rabi | 2.8% | Madhya Pradesh, Uttar Pradesh, Maharashtra, Andhra Pradesh, Telangana, Rajasthan | Displaced by wheat in Haryana, Punjab, northern Rajasthan |
| Tur (Arhar) | Kharif, rainfed | About 2% | Maharashtra (about one-third), Uttar Pradesh, Karnataka, Gujarat, Madhya Pradesh | Red gram / pigeon pea |
| Groundnut | Kharif; rabi in southern India | 3.6% | Gujarat, Rajasthan, Tamil Nadu, Telangana, Andhra Pradesh, Karnataka, Maharashtra | 18.8% of world production (2018) |
| Rapeseed and mustard | Rabi | 2.5% | Rajasthan (about one-third), Haryana, Madhya Pradesh | Frost-sensitive; two-thirds of area irrigated |
| Cotton | Kharif | 4.7% | Gujarat, Maharashtra, Telangana | India ranks 2nd after China |
| Jute | Kharif cash crop | 0.5% | West Bengal (about three-fourths), Bihar, Assam | India makes about three-fifths of world output |
| Sugarcane | Largely irrigated | 2.4% | Uttar Pradesh (about two-fifths), Maharashtra, Karnataka, Tamil Nadu, Andhra Pradesh | 2nd after Brazil, 19.7% of world (2018) |
| Tea | Plantation | — | Assam (over half), West Bengal, Tamil Nadu | 21.22% of world production (2018) |
| Coffee | Plantation | — | Karnataka (over two-thirds), Kerala, Tamil Nadu | India ranks 8th in the world (2018) |
Oilseeds occupy about 14% of cropped area, concentrated in the drylands of the Malwa plateau, Marathwada, Gujarat, Rajasthan, Telangana, Rayalseema and the Karnataka plateau. Besides groundnut and rapeseed-mustard, soyabean is grown mostly in Madhya Pradesh and Maharashtra — together about 90% of output — and sunflower in Karnataka, Andhra Pradesh, Telangana and adjoining Maharashtra.
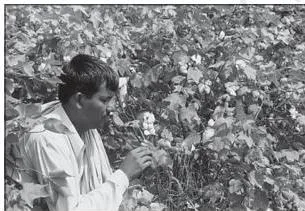
Cotton is the leading fibre crop — a kharif, tropical crop for which India grows both short-staple Indian cotton and long-staple American cotton called narma in the northwest. Yield is high under irrigation in the northwest and very low in rainfed Maharashtra.
Two plantation facts anchor this section: tea started in the 1840s in the Brahmaputra valley of Assam — black tea is fermented, green tea unfermented — and coffee’s three varieties are arabica, robusta and liberica, with arabica in greatest international demand.
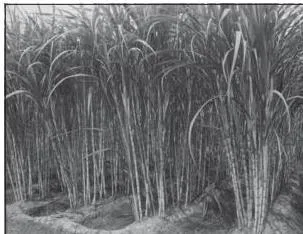
The sugarcane and tea photographs show the two crop forms the chapter contrasts: sugarcane as a tall field crop of the plains, tea as a slope crop of the hills.
Reading the Distribution Maps: A Figure Walkthrough



The chapter’s distribution maps are shaded maps of India — darker shading means greater concentration of that crop. Read them with the text beside them: the caption names the crop, and the text names the leading states and the reasons behind the pattern. This is the skill a locate-and-describe answer needs.
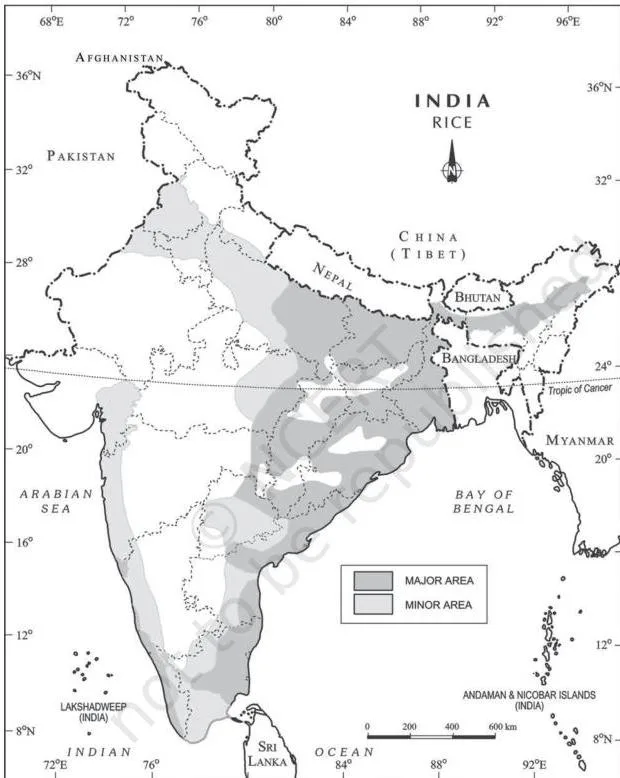
The rice map’s densest shading follows the eastern Gangetic belt — West Bengal, Bihar and eastern Uttar Pradesh — with a second dark patch in the irrigated northwest. The text explains that northwest patch: Punjab and Haryana are not traditional rice areas, but irrigation and improved seeds after the Green Revolution made high-yield rice possible there.

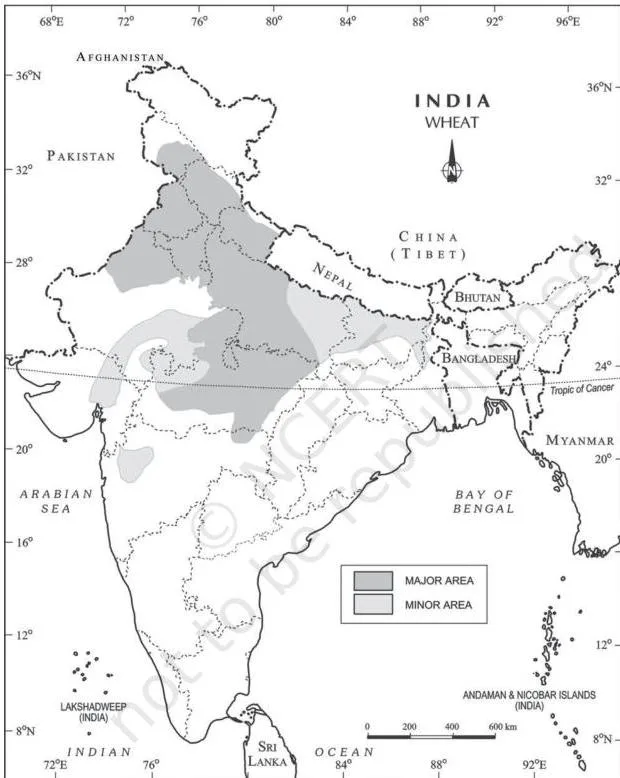
Wheat hugs the Indo-Gangetic Plain — Punjab, Haryana, western Uttar Pradesh and into Madhya Pradesh. Connect the shading to the crop’s nature: wheat is a temperate rabi crop, and 85% of its area lies in the north and central regions.
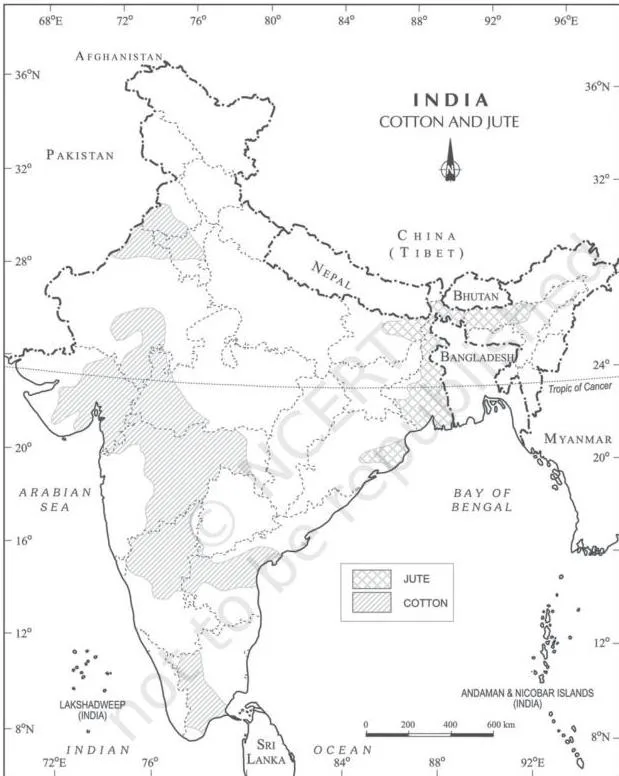
Cotton appears in three separate belts: northwest (Punjab, Haryana, northern Rajasthan), west (Gujarat, Maharashtra) and the southern plateaus (Andhra Pradesh, Karnataka, Tamil Nadu). Jute is the opposite — tiny in area (0.5% of cropped area), dark and concentrated in West Bengal with some in Bihar and Assam.
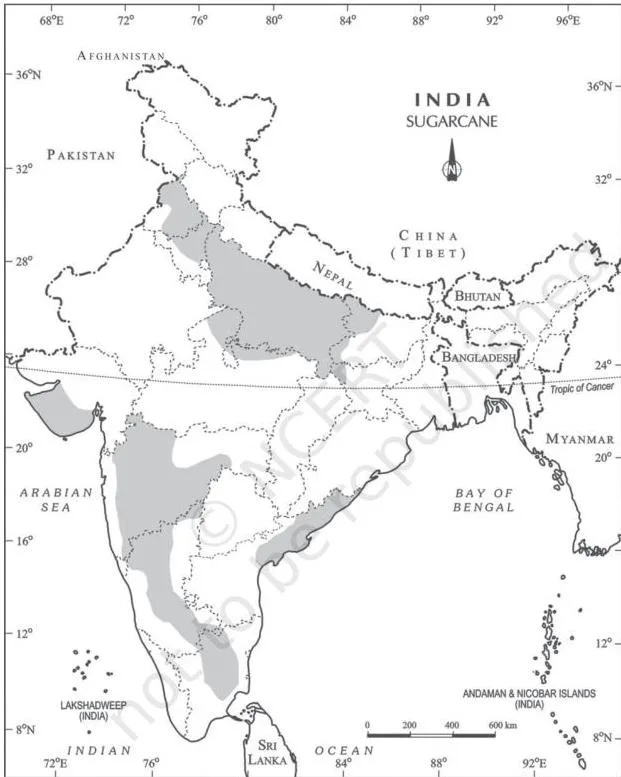
Sugarcane runs in a broad belt from Uttar Pradesh through Maharashtra and into the south. The dark north corresponds to Uttar Pradesh’s two-fifths share of production; the southern patch is smaller but its yields are higher.
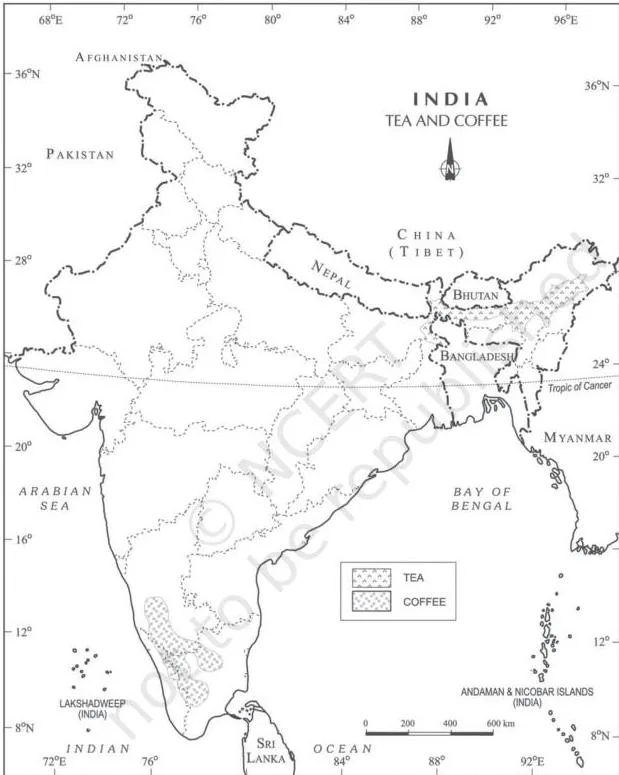
Tea sits in the northeast — Assam and sub-Himalayan West Bengal — and on the lower slopes of the Nilgiri and Cardamom hills. Coffee is confined to the Western Ghats highlands of Karnataka, Kerala and Tamil Nadu, and Karnataka alone grows more than two-thirds of India’s coffee.
A good locate-and-describe answer combines four things: which region is shaded darkest, which states lead, one reason (moisture, irrigation or relief), and one yield or rank fact from the text.
Key Terms and Definitions From This Chapter
This chapter packs paired terms that examiners love to ask as “differentiate” questions. Each definition below carries the detail that matters.
- Geographical area — the fixed area of an administrative unit as measured by the Survey of India.
- Reporting area — the area as per land revenue records; it changes somewhat with those estimates.
- Net sown area (NSA) — the physical extent of land on which crops are sown and harvested.
- Gross cropped area (GCA) — the total area sown in a year, counting a plot twice if two crops are grown on it.
- Total cultivable land — net sown area + all fallow lands + culturable wasteland.
- Culturable wasteland — land left fallow for more than five years but reclaimable through reclamation practices.
- Current fallow — land left uncultivated for one agricultural year or less, to recoup fertility.
- Fallow other than current fallow — cultivable land left fallow for more than one year but less than five.
- Common property resources (CPRs) — state-owned land for community use, with rights of access for every member and no individual property rights.
- Protective irrigation — irrigation that supplements rainfall to protect crops from moisture deficiency over the maximum possible area.
- Productive irrigation — irrigation that supplies full soil moisture through the cropping season for high productivity.
- Dryland farming — rainfed farming in regions with annual rainfall below 75 cm, using hardy crops and moisture conservation.
- Wetland farming — rainfed farming where rainfall exceeds plant needs, facing flood and erosion hazards.
- Cropping intensity — gross cropped area divided by net sown area, times 100; a measure of how intensively land is used in a year.
- High yielding varieties (HYVs) — improved seed varieties, of wheat from Mexico and rice from the Philippines, that powered the Green Revolution.
Agricultural Development in India: From Food Imports to Self Reliance
Before Independence, Indian agriculture was largely subsistence and performed poorly in the first half of the twentieth century, with severe droughts and famines. Partition also took about one-third of undivided India’s irrigated land to Pakistan. From that start, the chapter builds a clear timeline.
- Three immediate goals after Independence: switch from cash crops to food crops, intensify cropping on already cultivated land, and bring cultivable and fallow land under the plough.
- Production stagnated in the late 1950s → the Intensive Agricultural District Programme (IADP) and Intensive Agricultural Area Programme (IAAP) were launched.
- Two consecutive droughts in the mid-1960s caused a food crisis → foodgrains were imported.
- New high yielding varieties (HYVs) — wheat from Mexico, rice from the Philippines — became available by the mid-1960s.
- Package technology (HYVs plus chemical fertilisers) was introduced in the irrigated areas of Punjab, Haryana, western Uttar Pradesh, Andhra Pradesh and Gujarat → the Green Revolution.
- The Green Revolution made India self-reliant in foodgrains, but was initially confined to irrigated areas, creating regional disparities until the 1970s.
- Agro-climatic planning began in 1988 for regionally balanced development; attention turned to diversification into dairy, poultry, horticulture, livestock and aquaculture.
- Liberalisation and the free market economy from the 1990s reshaped Indian agriculture.
- Today the National Mission for Sustainable Agriculture (NMSA) aims for productive, sustainable, remunerative and climate-resilient farming through location-specific integrated farming systems and soil and moisture conservation; organic farming is promoted through Paramparagat Krishi Vikas Yojana (PKVY) and Rashtriya Vikas Yojana (RKVY).
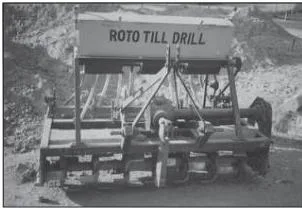
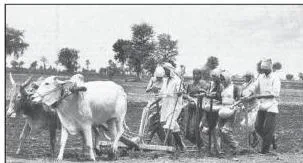
The roto-till drill is the chapter’s visual evidence of mechanisation — as its name suggests, it combines soil preparation with seed drilling in a single pass. The chapter pairs this with numbers: chemical fertiliser consumption has increased 15 times since the mid-sixties, and pesticide use rose because HYVs are highly susceptible to pests and diseases.
Information support now reaches farmers through the Farmer’s Portal, a platform for anything from insurance and market prices to soil fertility maps.
Problems of Indian Agriculture: The Chapter’s Diagnosis
Most agricultural problems are region-specific, but the chapter lists eight that are common across India, ranging from physical constraints to institutional hindrances. A long answer should name all eight.
- Dependence on erratic monsoon — only about 33% of cultivated area is irrigated; the rest depends on rain. Droughts and floods are the twin menace, as flash floods in Maharashtra, Gujarat and Rajasthan in 2006 and 2017 showed.
- Low productivity — per-hectare yields of rice, wheat, cotton and oilseeds are below those of the USA, Russia and Japan, and labour productivity is low under heavy population pressure.
- Constraints of financial resources and indebtedness — modern inputs are expensive; marginal and small farmers borrow from institutions and moneylenders, and crop failures trap them in debt.
- Lack of land reforms — of the three British revenue systems (Mahalwari, Ryotwari, Zamindari), Zamindari was the most exploitative; reforms after Independence lacked strong political will.
- Small farm size and fragmentation of landholdings — holdings shrink under population pressure and fragment again every generation; some states have never carried out consolidation even once. Small fragmented holdings are uneconomic.
- Lack of commercialisation — most small and marginal farmers grow foodgrains for their own family consumption; commercialisation has occurred only in irrigated areas.
- Vast underemployment — unirrigated tracts face seasonal unemployment of 4 to 8 months, and even in the cropping season work is not available throughout.
- Degradation of cultivable land — salinisation, alkalisation and waterlogging in irrigated areas; toxic build-up of chemicals; loss of nitrogen fixation as leguminous crops are displaced and fallow shortens; and soil erosion by water and wind in rainfed areas.
Common Mistakes Students Make in This Chapter
This chapter’s trap is vocabulary: several pairs of terms look alike but mean different things. The table names each confusion before you make it.
| Mistake | Correct rule | How to check your answer |
|---|---|---|
| “The forest category increased, so forest cover grew” | The increase is in the area demarcated by the government, not in actual forest cover | In the MCQ, the right reason is “increase in notified area allocated for forest growth” |
| “Reporting area and geographical area are the same” | Geographical area is fixed by the Survey of India; reporting area shifts with land revenue estimates | All percentages in Fig. 3.1 are of reporting area, not geographical area |
| “Current fallow and fallow other than current fallow are the same thing” | One year or less vs more than one but less than five years; beyond five years it becomes culturable wasteland | Ask: how many years was the land left unplanted? |
| “Net sown area and gross cropped area are the same” | NSA is physical extent sown once; GCA counts every sowing in a year | Cropping intensity = GCA/NSA × 100 can exceed 100%, proving GCA is larger |
| “Marginal land is a land-use category” | The chapter lists nine categories; marginal land is not among them | Exercise 1(i) asks which option is NOT a category — it is marginal land |
| “Dryland farming means no irrigation in desert areas” | Dryland means annual rainfall below 75 cm, with hardy crops like ragi, bajra, moong, gram and guar | Sugarcane is not a dryland crop — exercise 1(iv) |
| “All three crop seasons exist everywhere in India” | The kharif–rabi–zaid split applies in northern and interior India; southern India can grow tropical crops thrice a year | Check for the chapter’s southern exception before answering a seasons question |
Exam Notes: How This Chapter Gets Asked
No one can promise what will appear, but the chapter’s own exercises show the question forms this chapter supports. Remember that textbook contents and the examinable syllabus are not always identical — check the current official CBSE syllabus.
The five MCQs in Exercise 1 test exactly the concepts in the mistake table above.
The answers, from the chapter text: (i) (b) Marginal land is NOT a land-use category; (ii) forest share rose mainly because of (c) increase in notified area allocated for forest growth; (iii) the main degradation in irrigated areas is (c) salinisation of soils; (iv) the crop not cultivated under dryland farming is (d) sugarcane; (v) HYVs of wheat and rice were developed in (c) Mexico and Philippines.
The 30-word “differentiate” questions each need one defining threshold, not a paragraph:
- Barren vs culturable wasteland — barren land cannot be brought under cultivation with available technology; culturable wasteland was left fallow over five years but is reclaimable.
- Net sown area vs gross cropped area — physical extent sown vs total sowings in a year.
- Why cropping intensity matters — India is land scarce and labour abundant; higher intensity raises output per unit of land and absorbs rural labour.
- Measuring total cultivable land — add net sown area, all fallow lands and culturable wasteland.
- Dryland vs wetland farming — the 75 cm rainfall threshold and the crops each supports.
The 150-word questions map to two sections of this page: environmental problems of land resources draws on the degradation item in the problems list, and post-Independence development strategies is the timeline from the three immediate goals to the Green Revolution, agro-climatic planning and NMSA. Map-reading and leading-state identification are natural extensions of the distribution maps.
Revision Summary: Land Resources in One Page
This is the chapter in miniature, for the night before — a compressed recap, not a substitute for the PDF.
- Nine categories — forests; barren and wasteland; non-agricultural uses; permanent pastures; tree crops and groves; culturable wasteland (over 5 years); current fallow (up to 1 year); other fallow (1–5 years); net area sown. They add up to the reporting area, not the fixed geographical area.
- The 1950–51 to 2026-27 shift — five up (forest category, non-agricultural uses, pastures, current fallow, net sown area), four down (barren, culturable wasteland, tree crops, other fallow); fastest rise in non-agricultural uses.
- Measurements — total cultivable land = NSA + all fallows + culturable wasteland (fell from 59.5% to 57.7% of reporting area); cropping intensity = GCA/NSA × 100.
- Seasons — kharif (June–September), rabi (October–March), zaid (April–June); no such split in southern India.
- Farming types — protective vs productive irrigation; dryland (below 75 cm rain) vs wetland farming.
- Crops, one exam fact each — rice: one-fourth of cropped area, 2nd in world; wheat: 85% in north-central India; jowar: Maharashtra over half; bajra: hardy, drought-resistant; maize: food and fodder; gram: displaced by wheat in the northwest; tur: Maharashtra one-third; groundnut: 18.8% of world output; rapeseed-mustard: Rajasthan one-third; cotton: 2nd after China, three belts; jute: West Bengal three-fourths; sugarcane: UP two-fifths, 2nd after Brazil; tea: Assam over half, 21.22% of world; coffee: Karnataka over two-thirds, 8th in world.
- Development timeline — subsistence start with famines → three post-Independence goals → stagnation → IADP and IAAP → mid-1960s food crisis and imports → HYVs → Green Revolution → agro-climatic planning (1988) → diversification → liberalisation (1990s) → NMSA, PKVY and RKVY.
- Eight problems — erratic monsoon, low productivity, indebtedness, lack of land reforms, small fragmented holdings, lack of commercialisation, underemployment, degradation of cultivable land.
Activities in This Chapter and How to Use Them for Revision
NCERT placed four activities inside the text, and each one previews an exam skill. Treat them as practice questions.
- Compare land-use between 1950–51 and 2026-27 — practising reading Fig. 3.1 is practising the five-up, four-down list.
- Actual increase vs rate of increase — use the data in Appendix (vi) and the simple growth rate formula (terminal − base) ÷ base × 100; invent your own numbers after the worked example in this page’s cropping intensity section.
- Separate cereals from pulses, and fine from coarse grains — a hands-on way to fix the chapter’s grain classification: rice and wheat are fine cereals; jowar, bajra, maize and ragi are coarse; gram and tur are pulses.
- List agricultural problems of your own region and compare them with the chapter’s list — this reasoning skill is exactly what the 150-word questions demand.
Sources and Data Verification
Four things, stated plainly:
- The figures on this page describe the NCERT Class 12 Geography textbook India: People and Economy, Chapter 3 “Land Resources and Agriculture,” official edition published on ncert.nic.in.
- This page covers that one chapter of that one book — not other Class 12 Geography books, and not other chapters of this book.
- This listing is maintained for the current academic session using the NCERT information available to us.
- NCERT settles textbooks, editions and PDFs; CBSE settles the curriculum, syllabus and examinations.
Related Resources
For the rest of this book, the Class 12 Geography notes hub gathers chapter-wise help, and the Class 12 notes for all subjects page links everything else on the site. To verify editions and download any chapter, use the official NCERT textbook page for India: People and Economy.
FAQs on Land Resources Class 12
Why has the area under forest increased even though forest cover has not increased?
Because the two are measured differently. The forest land-use category counts the area the government has identified and demarcated for forest growth, and that notified area can expand without new trees being planted. The chapter says this explicitly — which is why the exercise’s correct option is “increase in notified area allocated for forest growth.”
What is the difference between net sown area and gross cropped area?
Net sown area is the physical extent of land on which crops are sown and harvested — a plot counts once, however many crops it grows in a year. Gross cropped area counts every sowing: a plot growing rice and then wheat in the same year contributes twice. Because of this, cropping intensity = GCA/NSA × 100 can exceed 100% wherever multiple cropping happens.
What is the difference between current fallow and fallow other than current fallow?
Only time separates them. Current fallow is land left uncultivated for one agricultural year or less; fallow other than current fallow is left uncultivated for more than one year but less than five. Beyond five years, the land is categorised as culturable wasteland. Fallowing is a deliberate practice that lets the land recoup lost fertility through natural processes.
How is cropping intensity calculated and why does it matter for India?
Cropping intensity = (Gross Cropped Area ÷ Net Sown Area) × 100. In the worked example on this page, an NSA of 4.2 lakh hectares with 5.6 lakh hectare-equivalents of sowing gives a CI of 133.3%. It matters because India is land scarce but labour abundant: a high CI raises output per unit of land and absorbs rural labour, reducing unemployment.
Which of these is NOT a land-use category: fallow land, marginal land, net area sown, or culturable wasteland?
Marginal land. The chapter lists nine categories maintained in land revenue records — among them fallow land (both current and other), net area sown and culturable wasteland — and marginal land is not one of them. This is the exact point of exercise question 1(i).
What is the difference between dryland and wetland farming?
Dryland farming is rainfed farming in areas with annual rainfall below 75 cm; it grows hardy, drought-resistant crops such as ragi, bajra, moong, gram and guar, and relies on soil moisture conservation and rainwater harvesting. Wetland farming happens where rainfall exceeds plant needs; it grows water-intensive crops such as rice, jute and sugarcane and may face flood and soil erosion hazards.
Reference: NCERT Class 12 Geography textbook, chapter 3, official edition on ncert.nic.in.
Explore Class 12 Geography Books
Related chapters: