
Population Class 12 — Chapter 1 of the NCERT Geography textbook India: People and Economy — studies the distribution, density, growth and composition of India’s population using 2011 Census data.
India is the second most populous country in the world, after China, with 1,210 million people. The official chapter PDF from the current NCERT edition is right below, and the rest of this page explains what the chapter teaches.
Population Class 12 NCERT PDF Download
The chapter runs from the opening Census figures to the exercises at the end, and reading it from the official file keeps its maps and tables sharp on any screen.
The Population Class 12 NCERT Chapter 1 PDF on ncert.nic.in is the official NCERT edition of India: People and Economy, so every figure, map and exercise in it matches the printed textbook you are studying from.
| What the chapter holds | Count | Where it is used |
|---|---|---|
| Printed pages | 14 | |
| Figures with NCERT captions | 10 | |
| Tables | 2 | |
| Exercise questions | 3 | answered in our NCERT Solutions |
| Activities | 5 | |
| Official NCERT PDF | Download the chapter PDF | the chapter exactly as NCERT publishes it |
Chapter at a Glance
The table below lists what this chapter holds — its sections, maps, tables, activities and exercise questions — so you can see at a glance how much material there is to revise.
In substance, the chapter answers four questions about India’s people: where they live (distribution), how crowded the land is (density), how fast the number is changing (growth) and who the people are (composition by residence, language, religion and work).
What the NCERT Population Chapter Covers
This section is a guided tour of the chapter’s order, so you can locate any topic in the book or your class notes without re-reading everything. The chapter moves in a deliberate chain: each idea builds on the last.
- Sources of population data — the Census, held every ten years. The first Census was conducted in 1872; the first complete Census in 1881.
- Distribution of population — where people live, why the pattern is so uneven, and the physical, socio-economic and historical factors behind it.
- Density of population — persons per square kilometre, plus the sharper physiological and agricultural densities that measure pressure on farmland.
- Growth of population — natural and induced growth, population doubling time, the four phases of growth from 1901 to 2011, and regional variation.
- Population composition — the rural–urban, linguistic and religious make-up of the population, including the “religion and landscape” idea.
- Composition of working population — main, marginal and non-workers, work participation rate, the four occupational categories and the sectoral shift away from agriculture.
The chapter also pauses for several short activities — comparing appendix data, preparing composite bar graphs and similar map-reading tasks — and closes with exercises in three forms: multiple-choice questions, answers of about 30 words, and answers of about 150 words.
Key Concepts in the Population Chapter
The ideas below are the chapter’s spine. If you can explain each one in your own words, you have understood the chapter — the exercises at the end only re-check these same ideas in different forms.
Sources of Population Data: The Census
Every number in this chapter comes from one source, so it matters to know what that source is before you meet any figure. The Census is a full official headcount of the population, conducted every ten years in India.
The first Census in India was conducted in 1872; the first complete Census followed only in 1881. All the population figures quoted in this chapter are from Census 2011.
Why a decennial count matters: a headcount every ten years lets you measure change — how many people were added, where they were added, and how the composition of the population shifted in between.
Distribution of Population: Where Indians Live
Distribution answers the first question — where people actually live. The chapter’s central claim is that India’s population is spread highly unevenly: a few states hold most of the people, and vast areas hold very few.
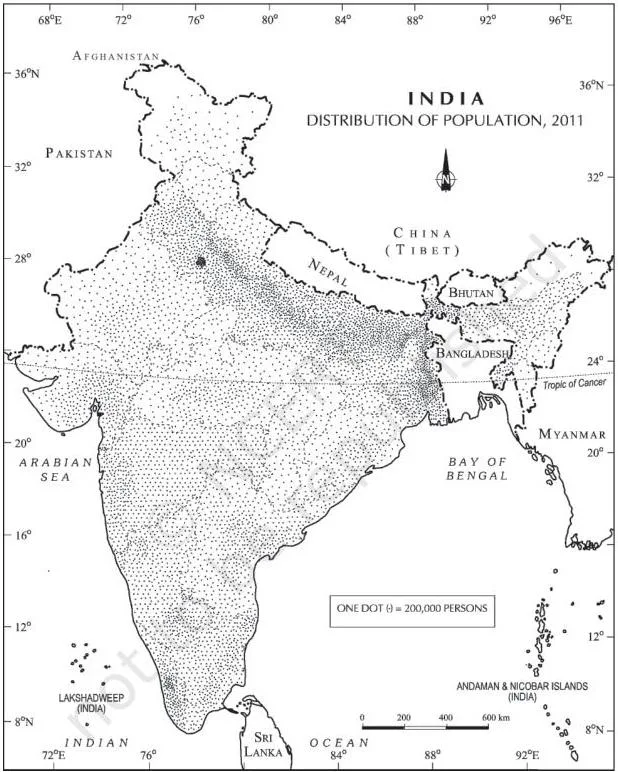
Read Fig 1.1 the way the chapter asks you to: the shading shows where people are concentrated, not where the land is large. Uttar Pradesh has the highest population, followed by Maharashtra, Bihar and West Bengal.

Ten states — Uttar Pradesh, Maharashtra, Bihar, West Bengal, Andhra Pradesh, Tamil Nadu, Madhya Pradesh, Rajasthan, Karnataka and Gujarat — together hold about 76 per cent of the country’s people. By contrast, large-area states such as Arunachal Pradesh (0.11 per cent), Uttarakhand (0.84 per cent) and Jammu and Kashmir (1.04 per cent) hold tiny shares.
Three groups of factors explain the pattern:
- Physical — climate, terrain and the availability of water. The North Indian Plains, deltas and coastal plains carry the most people; the Himalayas, parts of the north-east and some western states carry the fewest.
- Socio-economic — settled agriculture and its development, patterns of human settlement, transport networks, industrialisation and urbanisation.
- Historical — the early history of settlement in the river plains and coastal areas keeps population concentration high there even today.
Development has also shifted the map: irrigation in Rajasthan, mineral and energy resources in Jharkhand, and transport networks in the peninsular states have raised population in areas that were once thinly populated. The rule to remember: people cluster where water, fertile land and connectivity are available.
Density of Population: Crude, Physiological and Agricultural
Distribution tells you where people are; density tells you how crowded the land is. Density is the number of persons per unit area, and it lets you compare the human–land relationship across states of very different sizes.
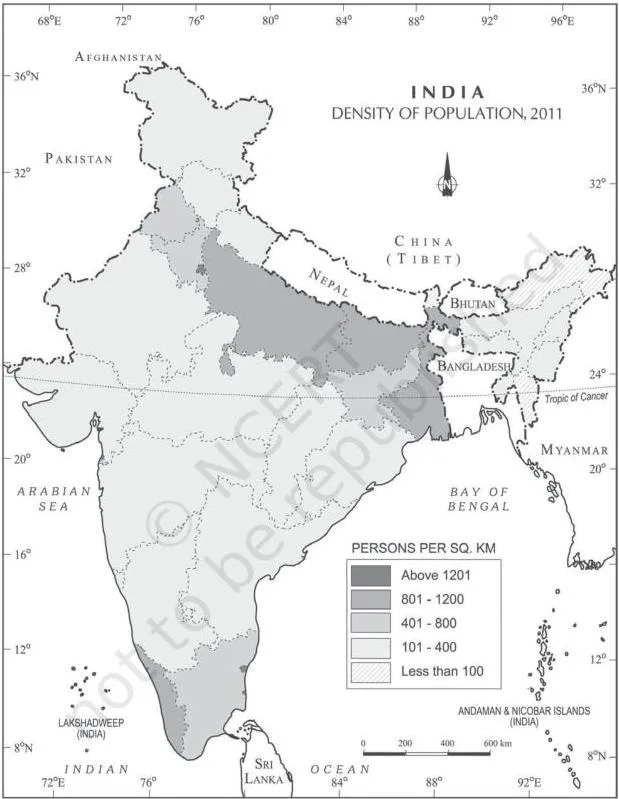
The national density for 2011 is 382 persons per sq km, up from 117 in 1951 — an increase of more than 200 persons per sq km in fifty years. The range across the country is enormous: from just 17 persons per sq km in Arunachal Pradesh to 11,297 in the National Capital Territory of Delhi.
Among states, the chapter names Bihar (1,102), West Bengal (1,029), Uttar Pradesh (828), Kerala (859) and Tamil Nadu (555) as high-density states. Assam, Gujarat, Andhra Pradesh, Haryana, Jharkhand and Odisha have moderate densities; the Himalayan hill states and most of the north-east, excluding Assam, have low densities.
This simple figure is called a crude measure because it divides all people by all land. For a country with a large agricultural population, pressure on farmland matters more, so the chapter adds two sharper measures:
\[ \text{Physiological density} = \frac{\text{total population}}{\text{net cultivated area}} \]
\[ \text{Agricultural density} = \frac{\text{total agricultural population}}{\text{net cultivable area}} \]
Agricultural population means cultivators, agricultural labourers and their family members. The point of both measures: crude density hides how much pressure falls on farmland — two states can have the same crude density while one has far more people pressing on each hectare of cultivated land.
Growth of Population: The Four Phases
Growth is the change in the number of people living in a particular area between two points of time, expressed as a percentage. It has two components: natural growth, analysed through crude birth and death rates, and induced growth, explained by migration. This chapter concentrates on natural growth.
Related idea — population doubling time: the time a population takes to double itself at its current annual growth rate. India’s annual growth rate was 1.64 per cent in 2011.
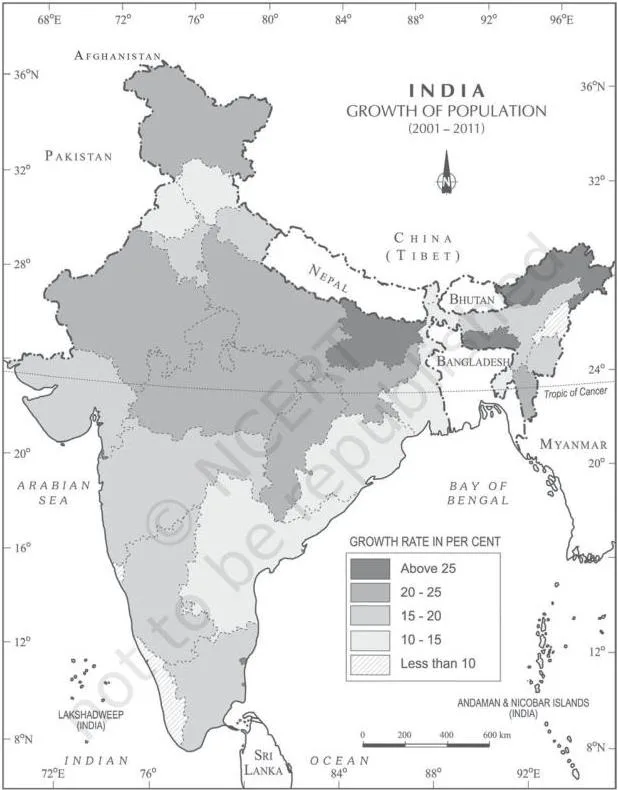
Over the last century, growth moved through four distinct phases. Table 1.1 in the book gives the full decadal figures, and Fig 1.3 maps how growth varied across the country:
| Phase | Period | Character of growth | Main causes |
|---|---|---|---|
| I | 1901–1921 | Stagnant or stationary; growth very low, negative in 1911–1921 | Both birth and death rates high; poor health services, widespread illiteracy, inefficient distribution of food |
| II | 1921–1951 | Steady growth | Better health and sanitation cut mortality; better transport improved food distribution; birth rate stayed high |
| III | 1951–1981 | Population explosion; average annual growth about 2.2 per cent | Mortality fell rapidly while fertility stayed high; post-Independence planned development; international migration |
| IV | Post-1981 | Growth high but slowing — decadal rate fell from a peak of 24.80 per cent (1971) to 17.64 per cent (2011) | Crude birth rate declined; later age at marriage and better education, especially of females |
Worked example — decadal growth rate, using original numbers and the chapter’s formula:
Step 1: Identify the two populations.
Suppose a state’s population rose from 40 million (\(p_1 = 40\)) to 46 million (\(p_2 = 46\)) in one decade.
Step 2: Apply the formula \(g = \frac{p_2 – p_1}{p_1} \times 100\).
\[ g = \frac{46 – 40}{40} \times 100 = \frac{6}{40} \times 100 = 15\% \]
Final answer: the decadal growth rate is 15 per cent — the same calculation that produced Table 1.1’s 17.64 per cent for 2001–2011.
Regional variation cuts across the national averages. In 1991–2001, growth was low in the southern states — Kerala recorded the country’s lowest at 9.4 per cent — while a west-to-east belt of states (Gujarat, Maharashtra, Rajasthan, Punjab, Haryana, Uttar Pradesh, Bihar and others) ran at 20–25 per cent.
In 2001–2011, growth fell in almost every state. Among the six most populous states, the fall ranged from 3.5 percentage points (Andhra Pradesh) to 6.7 percentage points (Maharashtra); only Tamil Nadu and Puducherry recorded increases over the previous decade.
Population Composition: Rural-Urban, Linguistic and Religious
A headcount alone does not tell you how a population lives. Composition breaks the population down by residence, language, religion and occupation — which is what makes these sections different from a list of totals.
Rural–urban composition. About 68.8 per cent of Indians live in villages and 31.16 per cent in towns (2011). India has 640,867 villages, of which about 93.2 per cent (597,608) are inhabited, yet the rural population is spread unevenly.
Himachal Pradesh and Bihar have very high rural shares, while Goa and Mizoram have only a little over half their population in villages. Village size ranges from under 200 people in the north-eastern hill states, Western Rajasthan and the Rann of Kutch to as many as 17,000 in parts of Kerala and Maharashtra.
Urban population is growing faster, driven by economic development, better health and hygiene, and rural-urban migration — most visible along the main roads and rail lines of the North Indian Plains and around industrial centres such as Kolkata, Mumbai, Bengaluru–Mysuru and Ahmedabad–Surat.
Linguistic composition. India is a land of linguistic diversity. Grierson’s Linguistic Survey of India (1903–1928) recorded 179 languages and 544 dialects; modern India has about 22 scheduled languages, with Hindi the most spoken and Sanskrit, Bodo and Manipuri the smallest groups (2011). Language regions do not have sharp boundaries; they merge and overlap at their frontiers. The major languages belong to four families (Table 1.2):
- Indo-Aryan (about 73 per cent) — the largest group, covering most of northern, western and central India.
- Dravidian (about 20 per cent) — mainly the southern states.
- Austric (about 1.38 per cent) — Meghalaya, the Nicobar Islands and pockets of eastern and central India.
- Sino-Tibetan (about 0.85 per cent) — the Himalayan and north-eastern states.
Religious composition. Religion permeates family and community life in India, and it shows on the landscape. Table 1.3 gives the 2011 shares:
| Religious community | Population (million), 2011 | Per cent of total |
|---|---|---|
| Hindus | 966.3 | 79.8 |
| Muslims | 172.2 | 14.2 |
| Christians | 27.8 | 2.3 |
| Sikhs | 20.8 | 1.7 |
| Buddhists | 8.4 | 0.7 |
| Jains | 4.5 | 0.4 |
| Other religions | 7.9 | 0.7 |
| Religion not stated | 2.9 | 0.2 |
Muslims, the largest minority, form majorities in the Kashmir valley and Lakshadweep, and are concentrated in Jammu and Kashmir, districts of West Bengal and Kerala, much of Uttar Pradesh and around Delhi. Christians are mostly rural, concentrated on the western coast (Goa, Kerala) and in the hill states of the north-east.
Sikhs cluster in Punjab, Haryana and Delhi. Jains concentrate in the urban areas of Rajasthan, Gujarat and Maharashtra, while Buddhists are found mainly in Maharashtra, Sikkim, Arunachal Pradesh, Ladakh, Tripura and Lahul and Spiti.
The chapter’s “Religion and Landscape” point: religion expresses itself on the ground through sacred structures — from village shrines to large temples, masjids, gurudwaras, monasteries and churches — as well as cemeteries and groves of trees kept for religious purposes.
Working Population and Occupational Structure
This section turns from who the people are to what they do. The Census divides the population by economic status into three groups: main workers, marginal workers and non-workers.
The 183-day rule draws the line. A main worker works for at least 183 days (six months) in a year; a marginal worker works for less than 183 days. For example, a person who works 200 days in a year is a main worker; one who works 150 days is a marginal worker.
Only about 39.8 per cent of the population are workers (main and marginal combined), leaving roughly 60 per cent as non-workers — a large dependent population that indicates possible widespread unemployment and underemployment.
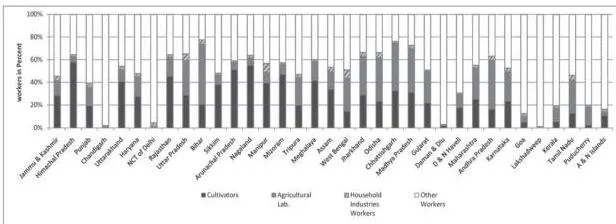
Work participation rate — the proportion of the population that works — varies from about 29.1 per cent in Lakshadweep to 51.9 per cent in Himachal Pradesh. The chapter’s counter-intuitive insight: the work participation rate tends to be higher in areas of lower economic development, because subsistence or near-subsistence activities need many manual workers.
Occupational structure. About 54.6 per cent of workers are cultivators and agricultural labourers, 3.8 per cent work in household industries, and 41.6 per cent are “other workers” — non-household industry, trade, commerce, construction and services. The 2011 Census uses four occupational categories: cultivators, agricultural labourers, household industrial workers and other workers.
Fig 1.4 and Table 1.4 show that male workers outnumber female workers in all three sectors. The share of workers in agriculture fell from 58.2 per cent (2001) to 54.6 per cent (2011) — a sectoral shift from farm-based to non-farm occupations. The chapter closes this theme with the Beti Bachao–Beti Padhao campaign as an example of policy action against gender discrimination in work and society.
Reading the Chapter’s Maps: A Figure Walkthrough
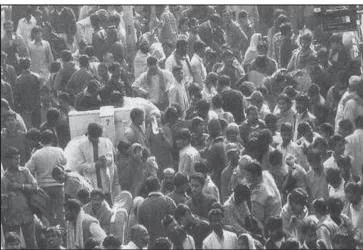


The chapter uses shaded maps of India because one map communicates in seconds what paragraphs of numbers cannot: how unevenly people are spread. The activities and exercises reward students who can read Figs 1.1–1.4, so learn to read each one rather than just glance at it.
- Fig 1.1 India – Distribution of Population (shown above under Distribution): the shading shows concentration of people. Dense shading tracks the North Indian Plains, the deltas and the coastal plains; light shading marks the Himalayas, parts of the north-east and the western states. Link the shading to the 76 per cent figure — a handful of northern and coastal states carry most of the population.
- Fig 1.2 India – Density of Population (shown above under Density): the same map logic, but the measure is persons per square kilometre. Watch the two extremes — 17 in Arunachal Pradesh against 11,297 in Delhi — and then the named high-density states: Bihar, West Bengal, Uttar Pradesh, Kerala and Tamil Nadu.
- Fig 1.3 India – Growth of Population (shown above under Growth): this map pairs with Table 1.1. It shows how decadal growth varied across space and lets you place the regional pattern — the slow-growing south (Kerala, 9.4 per cent) against the 20–25 per cent belt of northern states.
- Fig 1.4 India – Occupational Structure, 2011 (shown above under Working Population): not a map but a bar diagram comparing male and female workers in the three sectors. The fact to take away: male workers outnumber female workers in primary, secondary and tertiary sectors alike, and the female share is relatively highest in the primary sector.
Key Terms Defined in the Population Chapter
If a term blocks you while revising, look it up here instead of re-reading the whole chapter. Each definition is the chapter’s own idea, phrased for quick recall.
| Term | Definition | Belongs to |
|---|---|---|
| Census | Official headcount of the population, held every ten years in India | Sources of population data |
| Density of population | Number of persons per unit area — India’s figure for 2011 is 382 per sq km | Distribution |
| Physiological density | Total population divided by net cultivated area | Pressure on farmland |
| Agricultural density | Total agricultural population (cultivators, agricultural labourers and their families) divided by net cultivable area | Pressure on farmland |
| Decadal growth rate | Percentage change in population over a decade: \(g = (p_2 – p_1)/p_1 \times 100\), where \(p_1\) is the base-year population and \(p_2\) the present-year population | Growth of population |
| Population doubling time | Time a population takes to double itself at its current annual growth rate | Growth of population |
| Main worker | A person who works for at least 183 days (six months) in a year | Working population |
| Marginal worker | A person who works for less than 183 days in a year | Working population |
| Non-worker | A person counted as neither a main nor a marginal worker | Working population |
| Work participation rate | The proportion of the population that is working | Working population |
| Scheduled languages | Languages recognised under the Constitution; about 22 in modern India, with Hindi the most spoken | Linguistic composition |
Common Mistakes Students Make in This Chapter
Most errors in this chapter are date slips, rate slips and definition slips — all fixable once you know where they hide. The table names each mistake against the correct rule and a quick self-check.
| Mistake | Correct rule | How to check your answer |
|---|---|---|
| Confusing 1872 with 1881 for the first Census | First Census conducted in 1872; first complete Census in 1881 | Ask: does the statement say “complete”? If yes, it is 1881 |
| Swapping annual and decadal growth rates | Annual growth 1.64 per cent (2011); decadal growth 17.64 per cent (2001–2011) | Check the time span in the question — one year or one decade? |
| Assuming the latest decade grew fastest | Peak decadal growth was 24.80 per cent, recorded at the 1971 Census; it has fallen since | Scan Table 1.1 — the peak sits in the middle, not at the end |
| Treating distribution and density as the same | Distribution is where people live; density is people per unit area | A small state can hold a small share of people yet have very high density (Delhi) |
| Using crude density when the question means farmland pressure | Physiological density = total population ÷ net cultivated area; agricultural density = agricultural population ÷ net cultivable area | Which area is in the denominator — total land or cultivated land? |
| Misapplying the 183-day threshold | Working 183 days or more in a year = main worker; less than that = marginal worker | Count the days: 200 → main; 150 → marginal |
| Reading a high work participation rate as development | The chapter says the rate is higher in areas of lower economic development | Recheck the reasoning: subsistence work needs many manual hands |
| Mixing language counts from different eras | Grierson’s survey (1903–1928): 179 languages, 544 dialects; modern India: about 22 scheduled languages | Match each figure to its own source period |
How the Chapter’s Exercises Test You
No question here is a prediction about any board paper. This section only maps the chapter’s own exercises to the ideas they test, so your revision stays honest and focused.
- Exercise 1 — multiple-choice questions. Four facts: the 2011 population (1,210 million, from the chapter’s opening); the state with the highest density (Bihar at 1,102 among states, from the density section); the state with the highest urban share (from the rural–urban composition data); the largest linguistic group (Indo-Aryan, about 73 per cent, from Table 1.2).
- Exercise 2 — answers of about 30 words. Climate’s role in distribution (physical factors); states with large rural population (Himachal Pradesh, Bihar) and a reason; why some states have higher work participation (the lower-development argument); why agriculture holds the largest share of workers (occupational structure).
- Exercise 3 — answers of about 150 words. The spatial pattern of density of population, and the occupational structure of India’s population. These two questions are the chapter’s own sections re-expressed, so a clear rewrite of the headings above is a full answer.
A full 150-word answer needs structure, not just facts. For density: open with the national figure (382 persons per sq km), give the range (17 in Arunachal Pradesh to 11,297 in Delhi), name the high-density states, then the reasons and the regional variation.
For occupational structure: give the three sector shares (54.6 per cent primary, 3.8 per cent household industry, 41.6 per cent other workers), the four census categories, the male–female contrast, and the fall in agriculture’s share from 58.2 per cent (2001) to 54.6 per cent (2011).
The chapter’s activities — comparing appendix data and drawing composite bar graphs — are the skill version of the same content, and the map-based exercises reward students who can read Figs 1.1–1.4. Remember that textbook contents and the examinable syllabus are not always identical — check the current official syllabus.
Quick Recap: The Population Chapter in One Page
This is the chapter’s argument in one chain, for a last look before a test: Census data → distribution (where people are) → density (how crowded) → growth in four phases (how fast) → composition (who the people are — residence, language, religion, work).
- 1,210 million — India’s population at the 2011 Census; second in the world after China.
- 382 persons per sq km — national density (2011), up from 117 in 1951; range 17 to 11,297.
- 17.64 per cent — decadal growth 2001–2011, down from the peak of 24.80 per cent at the 1971 Census; Kerala had the lowest growth (9.4 per cent, 1991–2001).
- 68.8 per cent rural, 31.16 per cent urban (2011).
- 22 scheduled languages; Indo-Aryan the largest family at about 73 per cent.
- Hindus 79.8 per cent, Muslims 14.2 per cent (largest minority).
- Workers 39.8 per cent of the population; primary sector 54.6 per cent of workers and falling.
Mnemonic for the four phases — “Slow, Steady, Surge, Slow-down”: 1901–1921 stagnant, 1921–1951 steady, 1951–1981 the surge (population explosion), post-1981 the slow-down.
Related NCERT Resources
This listing is maintained for the 2026-27 academic session using the NCERT textbook information available to us. NCERT remains the authority for confirming the latest edition.
Population is Chapter 1 of India: People and Economy, the second book of Class 12 Geography, which sits alongside Fundamentals of Human Geography in the same subject. Use the pages below to keep moving through the syllabus.
- Class 12 Geography notes — notes for both NCERT Geography books, starting from Chapter 1.
- The World Population chapter notes — the population chapter of the companion book, useful for comparing global and Indian patterns.
- Class 12 hub — all Class 12 subjects on this site.
- CBSE notes homepage — every class and subject from one place.
The official NCERT website is the authoritative source for the current edition of India: People and Economy; download the full book there if you need chapters beyond this one.
Reference: NCERT Class 12 Geography textbook (India: People and Economy), chapter 1, official edition on ncert.nic.in.
Sources and Data Verification
The chapter described on this page is Population, Chapter 1 of the NCERT Class 12 Geography textbook India: People and Economy. Every population figure quoted above is the 2011 Census figure as printed in that edition, in the chapter’s tables (Table 1.1, Table 1.2, Table 1.3, Table 1.4) and in its text.
This page describes that textbook and its chapter; it is not a description of the whole CBSE scheme of subjects. NCERT settles the textbook contents, editions and official PDFs; CBSE settles the curriculum, the syllabus and the examinations. For the examinable weight of any topic, refer to the current official CBSE syllabus.
The listing is maintained for the current academic session using the NCERT information available to us.
FAQs on the Class 12 Population Chapter
What is India’s population according to the 2011 Census?
1,210 million (about 1.21 billion) people. The chapter opens with this figure and notes that India is the second most populous country after China, with a population larger than that of North America, South America and Australia put together.
Which Indian state has the highest density of population — Bihar or West Bengal?
Bihar, with 1,102 persons per sq km against West Bengal’s 1,029. The overall highest density is Delhi’s 11,297 persons per sq km, but Delhi is a Union Territory, so among states Bihar leads — which is why Bihar is the answer to the exercise’s multiple-choice question.
What is the difference between a main worker and a marginal worker?
The 183-day rule. A main worker works for at least 183 days (six months) in a year; a marginal worker works for less than 183 days. Example: 200 days of work makes a main worker; 150 days makes a marginal worker. Both count as workers, and together workers are only about 39.8 per cent of the population.
When did India record negative population growth, and why?
In the decade 1911–1921, when the population fell slightly — negative growth of 0.31 per cent in Table 1.1. The chapter’s reasons: high birth and death rates, poor health and medical services, illiteracy, and an inefficient system of distributing food and other basic necessities.
What are the four phases of India’s population growth?
Phase I (1901–1921) stagnant or stationary, with negative growth in 1911–1921; Phase II (1921–1951) steady growth as health, sanitation and transport improved; Phase III (1951–1981) population explosion, with annual growth around 2.2 per cent; Phase IV (post-1981) high growth slowing gradually, with the decadal rate down to 17.64 per cent by 2011.
What is the difference between decadal growth rate and annual growth rate in this chapter?
Decadal growth is the percentage change in population across a full decade — 17.64 per cent for 2001–2011, found by \(g = (p_2 – p_1)/p_1 \times 100\), where \(p_1\) and \(p_2\) are the census populations ten years apart. Annual growth is the per-year rate — 1.64 per cent in 2011. The two are not interchangeable: one is a whole decade’s change, the other a single year’s rate.
Explore Class 12 Geography Books
Related chapters: