
NCERT Class 12 Biology Chapter 11 is Organisms and Populations, the opening chapter of Unit X on Ecology. The chapter runs from printed page 187 to page 204 of the textbook, and the official PDF file is right below.
If you are studying Organisms and Populations Class 12, this page walks you through what the chapter teaches — population attributes, the two growth models, and the six species interactions — with the page numbers from your book so you can follow along.
Download the NCERT Class 12 Biology Chapter 11 Organisms and Populations PDF — the official file served from ncert.nic.in, identical to the printed textbook, so the page numbers cited across this page match the book exactly. Scroll down to read the section-by-section explanation first, or open this file now.
| What the chapter holds | Count | Where it is used |
|---|---|---|
| Printed pages | 17 | |
| Sections in the chapter | 6 | |
| Figures with NCERT captions | 5 | |
| Tables | 1 | |
| Exercise questions | 10 | answered in our NCERT Solutions |
| Official NCERT PDF | Download the chapter PDF | the chapter exactly as NCERT publishes it |
Chapter 11 Organisms and Populations at a Glance
This chapter opens Unit X, Ecology, which continues with Chapter 12 (Ecosystem) and Chapter 13 (Biodiversity and Conservation). The unit begins with a short biography of Ramdeo Misra, remembered as the Father of Ecology in India for building the country’s first centre of ecology teaching and research at Banaras Hindu University.
Chapter 11 builds one idea on the next. The chapter table on this page lists its full contents — sections, captioned figures and exercise questions — so you can see what the PDF holds before opening it.
- Populations — what counts as a population and which attributes only a population has.
- Population Attributes — per capita rates, sex ratio and age pyramids.
- Population Growth — the four processes that change density, then exponential and logistic growth models.
- Life History Variation — why reproductive strategies differ between species.
- Population Interactions — the six sign combinations, from mutualism to amensalism.
- Summary and Exercises — the end-of-chapter recall and question set.
You can take the PDF now, or read the explanation below and come back to the file when you need it.
What This Chapter Covers: Population Ecology
Before defining a single term, the book sets up how ecologists think. When a bulbul sings at dawn you can ask how the bird produces the song — through its voice box and a vibrating bone — or why it sings, which for a breeding bird is about signalling its mate (NCERT, p. 190).
These “how-type” (mechanism) and “why-type” (significance) questions run through the whole chapter, and they are the two lenses every topic below is studied through.
Ecology works at four levels of biological organisation: organisms, populations, communities and biomes. This chapter stays at the population level — groups of the same species — asking how they are measured, how they grow and how they interact with other species.
The population level matters for a deeper reason. Although an individual organism is the one that copes with a changed environment, natural selection operates at the population level to shape the species — which links population ecology to population genetics and evolution (NCERT, p. 191).
The chapter’s thread in one line: a population has attributes, it grows by a predictable model, its life history varies, and it interacts with other populations in six recognisable ways.
Key Concepts in Organisms and Populations Class 12
Six ideas carry the chapter. Each is explained below with its NCERT page number, so you can jump to the exact spot in your book.
Population Attributes: Rates, Sex Ratio and Age Pyramids
A single organism is born and dies, but a whole group has statistics an individual cannot have — rates, proportions and shapes. This first subsection gathers exactly those population-level attributes.
A population is a group of individuals of a given species in a well-defined geographical area, sharing or competing for similar resources and potentially interbreeding. Groups formed by asexual reproduction also count for ecological study (NCERT, p. 191). Cormorants in a wetland, bacteria on a culture plate and lotus plants in a pond are all examples.
An individual has births and deaths as events; a population has per capita birth and death rates — the change in numbers per member of the population. If 45 new plants appear in a pond population of 300, the birth rate is \( \frac{45}{300} = 0.15 \) offspring per plant per year (NCERT, p. 191).
The book runs the same arithmetic with its own examples: 8 new plants among 20 lotus plants gives 0.4 offspring per lotus per year, and 4 deaths among 40 fruitflies gives 0.1 individuals per fruitfly per week.
Two more attributes exist only at population level. Sex ratio is the proportion of males and females, such as 60 per cent females and 40 per cent males (NCERT, p. 191).
Age distribution, plotted as an age pyramid, shows the percentage of individuals in each age group; its shape tells whether the population is growing, stable or declining (NCERT, p. 192). Figure 11.1, taught in the walkthrough below, shows the three shapes.

Finally, the size of a population — its population density (N) — is not always best measured by head count. A single huge banyan tree versus 200 carrot grass plants (Parthenium hysterophorus) shows why: the banyan’s density by number looks low, yet its role in the community is enormous.
So for some species, per cent cover or biomass is the more meaningful measure (NCERT, p. 191-192). Numbers also fail when counting is impractical: relative density (fish caught per trap) can serve, and tiger censuses are done indirectly through pug marks and fecal pellets (NCERT, p. 192).
Population Growth: The Four Processes That Change Density
Before any growth-curve mathematics, the chapter lists the four raw processes that push a population’s size up or down. Every model that follows is built on this one equation.
Density increases through natality (births) and immigration (individuals of the same species arriving from elsewhere). Density decreases through mortality (deaths) and emigration (individuals leaving) (NCERT, p. 193).
If N is the density at time t, the density one step later is:
\[ N_{t+1} = N_t + [(B + I) – (D + E)] \]
where B is births, I is immigrants, D is deaths and E is emigrants in that period. Density rises when \( B + I \) exceeds \( D + E \).
Under normal conditions births and deaths are the dominant factors. Immigration can matter more, though, when a new habitat is being colonised — the book’s key qualification to remember (NCERT, p. 193). Figure 11.2 in the textbook draws these four processes acting on a population; it is a simple flow diagram of the equation above.
Exponential Growth and the Intrinsic Rate of Natural Increase
If a habitat had unlimited food and space, what would a population do? Exponential growth answers that imaginary question, and its key number — r — appears again in the logistic model and in the exercises.
With resources unlimited, a species can realise its innate potential to grow. If b and d are the per capita birth and death rates, then:
\[ \frac{dN}{dt} = (b – d) \times N \]
Writing r for \( b – d \) gives the compact exponential growth equation (NCERT, p. 194):
\[ \frac{dN}{dt} = rN \]
r is the intrinsic rate of natural increase — a per capita measure of a population’s inherent potential to grow, and the parameter ecologists use to judge how any biotic or abiotic factor affects growth. The book quotes r = 0.015 for the Norway rat, 0.12 for the flour beetle and 0.0205 for India’s human population in 1981 (NCERT, p. 194).
The integral form, which gives the density after time t, is:
\[ N_t = N_0 e^{rt} \]
where \( N_t \) is density after time t, \( N_0 \) is density at time zero, r is the intrinsic rate and e is the base of natural logarithms, 2.71828. Plotted, this growth is J-shaped (Figure 11.3a).
Worked example with original numbers. Suppose a population doubles in 4 years. At doubling, \( N_t = 2N_0 \), so \( 2 = e^{4r} \). Taking natural logs, \( \ln 2 = 4r \), and:
\[ r = \frac{\ln 2}{4} = \frac{0.693}{4} \approx 0.173 \]
So r is about 0.173 per individual per year. The rearrangement \( r = \frac{\ln 2}{\text{doubling time}} \) is exactly what exercise 2 needs.
Why doubling feels slow and then explodes. The chessboard anecdote in the book makes the point: one grain on square 1, two on square 2, four on square 3, and so on, doubling across all 64 squares. By the time the king reached the middle of the board, all the wheat in his kingdom would not cover the remaining squares (NCERT, p. 194).
Each step multiplies the previous one, so growth accelerates instead of adding steadily. That is why a single Paramecium, doubling daily by binary fission, reaches a mind-boggling population in 64 days — provided food and space stay unlimited.
No real habitat behaves this way for long, which is exactly why the next model exists.
Logistic Growth and Carrying Capacity
Exponential growth cannot last because no habitat has infinite resources. The logistic model adds a brake that slows growth as the population fills up its habitat.
With limited resources, individuals compete and the fittest survive. The habitat supports at most a maximum number of a species — the carrying capacity (K). The Verhulst-Pearl logistic equation builds the brake into the exponential model (NCERT, p. 195):
\[ \frac{dN}{dt} = rN \left( \frac{K – N}{K} \right) \]
The factor \( \frac{K – N}{K} \) does the braking: when N is small the bracket is near 1 and growth is nearly exponential; as N approaches K the bracket shrinks towards zero and growth almost stops.
The resulting curve passes through four phases — lag, acceleration, deceleration and asymptote — and is S-shaped (sigmoid), with the asymptote sitting at K (Figure 11.3b). Because resources for most animal populations become limiting sooner or later, the logistic model is the more realistic one (NCERT, p. 195).
Life History Variation: Trade-offs in Reproduction
Populations do not just grow — they also evolve different ways of reproducing. This short section explains why no single reproductive strategy wins everywhere.
Populations evolve to maximise their Darwinian fitness, which in this chapter means a high r value. Under a given set of selection pressures, each population moves towards the most efficient reproductive strategy for its habitat (NCERT, p. 195).
- Breeding once in a lifetime (Pacific salmon, bamboo) versus breeding repeatedly (most birds and mammals).
- Many small offspring (oysters, pelagic fishes) versus few large offspring (birds, mammals).
Neither option is universally better: life history traits evolve in relation to the constraints imposed by the habitat’s abiotic and biotic components (NCERT, p. 196).
Population Interactions: The Six Sign Combinations
No habitat on Earth holds a single species — every species needs at least one other to feed on or to service it. Each pair of species relates in one of six ways, and Table 11.1 compresses all six into signs.
The notation is the key. A + means the species benefits, a – means it is harmed, and 0 means it is unaffected (NCERT, p. 196). The six combinations are:
- Mutualism (+/+) — both species benefit.
- Competition (-/-) — both species lose.
- Predation (+/-) — one benefits, the other is harmed.
- Parasitism (+/-) — one benefits, the other is harmed.
- Commensalism (+/0) — one benefits, the other is unaffected.
- Amensalism (-/0) — one is harmed, the other is unaffected.
Predation and parasitism share the same sign pattern. They differ in how intimately the species live together — a predator attacks from outside, while a parasite lives on or inside its host, and the book notes that predation, parasitism and commensalism all involve species living closely together (NCERT, p. 196-197).
Mnemonic. Keep the order with the sentence “My Clever Pet Parrot Chews Almonds” — Mutualism, Competition, Predation, Parasitism, Commensalism, Amensalism. The only +/+ pair is mutualism (both win); the only -/- pair is competition (both lose); the two +/- pairs sit together because in both, one species benefits and one suffers.
Predation is how energy fixed by plants moves to higher trophic levels (NCERT, p. 197). A sparrow eating a seed is as much a predator as a tiger taking a deer, so herbivores are, in a broad sense, not very different from predators.
Predators keep prey in check. The prickly pear cactus spread across millions of hectares of Australian rangeland in the 1920s until a cactus-feeding moth from its native habitat controlled it — the basis of biological control.
Predators also preserve diversity: removing the starfish Pisaster from an enclosed Pacific coast site drove more than 10 invertebrate species extinct within a year (NCERT, p. 197-198). A predator that overexploits its prey starves after the prey collapses, which is why natural predators are “prudent”.
Prey fight back with defences. Insects and frogs use camouflage (cryptic colouration); the Monarch butterfly is distasteful because of a chemical it acquires as a caterpillar from a poisonous weed. Plants cannot run away, so about 25 per cent of all insects are phytophagous.
Plants answer with thorns (Acacia, Cactus) and stored chemicals such as Calotropis‘s cardiac glycosides, which is why cattle never browse it. Nicotine, caffeine, quinine, strychnine and opium began as plant defences (NCERT, p. 198).
Competition (NCERT, p. 198-199) does not need related species or scarce resources. Flamingoes and fishes compete for zooplankton in shallow South American lakes although they are unrelated; in interference competition, one species lowers another’s feeding efficiency even when food and space are abundant.
The chapter defines competition functionally: the fitness (measured by r) of one species is significantly lower in the presence of another. Evidence in nature includes the Abingdon tortoise, extinct within a decade of goats arriving in Galapagos, and Connell’s barnacles, where Balanus excludes Chthamalus from the Scottish intertidal zone.
Competitive release is the mirror image: a species confined by a superior competitor expands its range when that competitor is removed. Herbivores and plants are more adversely affected by competition than carnivores.
Gause’s Competitive Exclusion Principle states that two closely related species competing for the same resources cannot co-exist indefinitely. Species escape it through resource partitioning — MacArthur’s five warbler species co-exist on one tree by foraging differently (NCERT, p. 199).
Parasitism (NCERT, p. 199-200) has evolved in every major group, from plants to vertebrates. Many parasites are host-specific, and host and parasite co-evolve: if the host resists, the parasite must counter-adapt to stay successful on the same host.
Parasites show special adaptations — loss of unnecessary sense organs, adhesive organs or suckers, loss of the digestive system and high reproductive capacity. Their life cycles are often complex: the liver fluke needs two intermediate hosts (a snail and a fish), and the malarial parasite needs a mosquito vector.
Ectoparasites feed on the host’s external surface (lice on humans, ticks on dogs, and Cuscuta, a plant that has lost its chlorophyll and leaves). Endoparasites live inside the host — in the liver, kidneys, lungs or red blood cells.
Brood parasitism is the bird version: the koel lays its eggs in the crow’s nest, and its eggs have evolved to match the host’s eggs in size and colour so the crow does not eject them (NCERT, p. 200).
Commensalism (NCERT, p. 200-201) is +/0: one species benefits, the other is unharmed. The book’s examples are an orchid growing as an epiphyte on a mango branch, barnacles on a whale’s back, the cattle egret foraging beside grazing cattle that flush out insects, and the clown fish sheltered among a sea anemone’s stinging tentacles.
Mutualism (NCERT, p. 201-202) is +/+: both species benefit. Lichens are a fungus with algae or cyanobacteria; mycorrhizae are fungi with plant roots — the fungus helps the plant absorb nutrients and the plant supplies carbohydrates.
Plant-animal mutualisms are paid for in nectar and pollen to pollinators and juicy fruits to seed dispersers, and the system guards against “cheaters”. This is where co-evolution is tightest: each fig species is pollinated by only its partner wasp species (Figure 11.4).
The wasp lays its eggs in the fig fruit, and the fig pays the developing larvae with some of its seeds. The Mediterranean orchid Ophrys uses “sexual deceit” — its petal mimics a female bee, the deceived male bee pseudocopulates and carries pollen to the next flower (Figure 11.5).
If the female bee’s colour patterns changed even slightly, pollination would fail unless the orchid co-evolved to keep the resemblance (NCERT, p. 202).
Figure Walkthrough: Age Pyramids, Growth Curves and Mutualism
The chapter carries four captioned diagrams that do real work: they show population structure, the two growth models, and two plant-animal mutualisms. Here is how to read each one in your book.
Figure 11.1: Age pyramids for human population (NCERT, p. 192)

An age pyramid plots the percentage of individuals in each age group, with males on one side and females on the other. The three bands are pre-reproductive, reproductive and post-reproductive.
The shape is the diagnosis: a broad base (many young) means a growing population, roughly straight sides mean a stable one, and a narrow base (few young to replace adults) means a declining one (NCERT, p. 192). A common way this diagram is tested is to hand you a shape and ask which growth status it shows — check the base first.
Figure 11.3: Population growth curve (NCERT, p. 194)
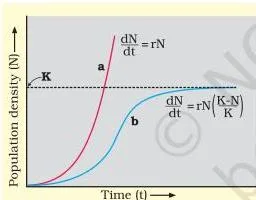
One plot, two curves. Curve (a) is the exponential J: when “responses are not limiting the growth”, the population compounds without a ceiling. Curve (b) is the logistic S: when “responses are limiting the growth”, the curve flattens at the carrying capacity K, marked at the asymptote.
Match each curve to its equation: the J comes from \( \frac{dN}{dt} = rN \), the S from \( \frac{dN}{dt} = rN\frac{K-N}{K} \). The S shape is the one to draw in the exercises, with the four phases — lag, acceleration, deceleration, asymptote — labelled along the curve.
Figure 11.4: Fig tree and wasp (NCERT, p. 201)
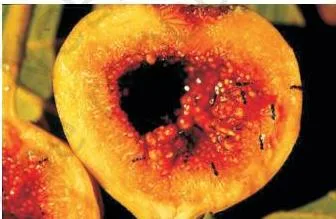
Part (a) shows the wasp pollinating the fig inflorescence while searching for an egg-laying site; part (b) shows the wasp laying eggs in the fig fruit. Each fig species is pollinated by exactly one partner wasp species — a “one-to-one” mutualism.
The fig pays for the service: the developing wasp larvae feed on some of the fig’s seeds, which is the price of guaranteed pollination (NCERT, p. 201).
Figure 11.5: Bee pollinating an orchid flower (NCERT, p. 202)
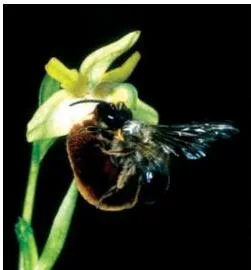
Orchids show a great diversity of floral patterns, many evolved to attract the right pollinator insect and guarantee pollination; the figure shows a bee on an orchid flower (NCERT, p. 202).
The book discusses the sexual deceit of the Mediterranean orchid Ophrys alongside this figure — its petal resembles the female bee, and the deceived male bee transports pollen while pseudocopulating. The tight coupling of flower and pollinator is co-evolution in action.
Key Definitions From the Chapter
A quick-lookup glossary of the terms the chapter defines, each in one line with its page. These are the words the exercises expect you to reproduce.
| Term | Definition (in brief) | NCERT page |
|---|---|---|
| Population | Group of individuals of a species in a defined area, sharing or competing for similar resources and potentially interbreeding | p. 191 |
| Population density (N) | Population size; measured by total number, per cent cover, biomass, relative or indirect estimates | p. 192 |
| Per capita birth rate | Births in a period divided by the initial population — change per member | p. 191 |
| Per capita death rate | Deaths in a period divided by the population — per member | p. 191 |
| Sex ratio | Proportion of males and females in a population | p. 191 |
| Age pyramid | Plot of age distribution whose shape shows growing, stable or declining status | p. 192 |
| Natality | Births added to initial density in a given period | p. 193 |
| Mortality | Deaths in a population during a given period | p. 193 |
| Immigration | Individuals of the same species entering the habitat from elsewhere | p. 193 |
| Emigration | Individuals of the population leaving the habitat | p. 193 |
| Intrinsic rate of natural increase (r) | Per capita growth potential of a population; r = b – d | p. 194 |
| Carrying capacity (K) | Maximum population a habitat can support | p. 195 |
| Exponential growth | Unlimited-resource growth at a constant per capita rate; J-shaped | p. 194 |
| Logistic growth | Limited-resource growth that levels off at K; S-shaped | p. 195 |
| Mutualism | +/+ interaction; both species benefit | p. 196 |
| Competition | -/- interaction; both species are harmed | p. 198 |
| Predation | +/- interaction; one species kills and feeds on the other | p. 197 |
| Parasitism | +/- interaction; parasite benefits, host is harmed | p. 199 |
| Commensalism | +/0 interaction; one benefits, the other is unaffected | p. 200 |
| Amensalism | -/0 interaction; one is harmed, the other is unaffected | p. 196 |
| Ectoparasite | Parasite feeding on the host’s external surface | p. 200 |
| Endoparasite | Parasite living inside the host body | p. 200 |
| Brood parasitism | Parasitic bird lays eggs in a host’s nest to be incubated by the host | p. 200 |
| Competitive exclusion | Two closely related species competing for the same resources cannot co-exist indefinitely | p. 199 |
| Resource partitioning | Competing species avoid competition through different feeding times or patterns | p. 199 |
| Camouflage | Cryptic colouration that hides prey from predators | p. 198 |
| Phytophagous | Feeding on plant sap and other plant parts; about 25 per cent of all insects | p. 198 |
Formulas in Chapter 11: Symbols and Units
All the equations of the chapter in one place, with what each symbol means and the page it comes from. A worked plug-in with original numbers follows the table.
| Formula | What it gives | Symbols and units | NCERT page |
|---|---|---|---|
| Per capita birth rate = births ÷ initial population | Change in numbers per member | Offspring per individual per year | p. 191 |
| Per capita death rate = deaths ÷ initial population | Deaths per member | Individuals per individual per period | p. 191 |
| \( N_{t+1} = N_t + [(B + I) – (D + E)] \) | Density one time step later | B births, I immigrants, D deaths, E emigrants — counts of individuals | p. 193 |
| \( \frac{dN}{dt} = (b – d)N \) | Growth rate from per capita rates | b, d per capita birth and death rates (per individual per unit time) | p. 194 |
| \( \frac{dN}{dt} = rN \) | Exponential growth rate | r = b – d, the intrinsic rate of natural increase | p. 194 |
| \( N_t = N_0 e^{rt} \) | Density after time t | Nₜ, N₀ densities; r intrinsic rate; e = 2.71828 | p. 194 |
| \( \frac{dN}{dt} = rN\left(\frac{K – N}{K}\right) \) | Logistic growth rate | K carrying capacity; bracket brakes growth as N approaches K | p. 195 |
Worked example with original numbers. A laboratory population doubles in 5 years. Find r.
Step 1: At doubling, \( N_t = 2N_0 \), so \( 2N_0 = N_0 e^{5r} \).
Cancel \( N_0 \): \( 2 = e^{5r} \).
- Step 1: Take natural logs on both sides: \( \ln 2 = 5r \).
- Step 2: \( r = \frac{\ln 2}{5} = \frac{0.693}{5} \approx 0.139 \).
Final answer: r ≈ 0.139 per individual per year.
The general rule: \( r = \frac{\ln 2}{\text{doubling time}} \). If the book’s exercise gives a 3-year doubling, the same three steps apply.
Common Mistakes Students Make in This Chapter
Every characteristic error in this chapter comes from reading the book’s definitions too fast. The table names each mistake, the correct rule, and a way to check yourself.
| Mistake | Correct rule | How to check your answer |
|---|---|---|
| Treating per capita rates as raw counts | A rate is change per member of the population, not the total number of events | Divide the events by the starting population: 8/20 = 0.4 is a rate, not “8 births” (NCERT, p. 191) |
| Dropping immigration and emigration from the density equation | All four processes change density; immigration can dominate during colonisation of a new habitat | Write all four letters B, I, D, E before substituting numbers (p. 193) |
| Asserting competition needs related species or scarce resources | Unrelated species compete (flamingoes and fishes); interference competition works even with abundant resources | Ask: is one species’ fitness (r) lower in the other’s presence? That is the definition (p. 199) |
| Assuming predators always destabilise an ecosystem | Predators control prey numbers and maintain diversity; removing Pisaster led to more than 10 extinctions | Trace what happens when the predator is removed — prey competition rises (p. 197-198) |
| Calling an overefficient predator a good one | Overexploiting prey drives both species extinct; natural predators are “prudent” | Ask whether both prey and predator survive the interaction (p. 198) |
| Misreading age-pyramid shapes | Broad base = growing; straight sides = stable; narrow base = declining | Check the widest band first — the pre-reproductive band (p. 192) |
| Measuring density only by head count | Biomass or per cent cover can be more meaningful (banyan vs carrot grass); relative or indirect measures save time | Ask what the study needs to compare before choosing a measure (p. 191-192) |
The chapter also plants two discussion traps. First, the female mosquito is not a parasite even though it needs blood for reproduction: it takes blood only to support reproduction, does not live on a host and does not derive nutrition from one, so it does not fit the chapter’s picture of a parasite (NCERT, p. 200).
Second, why has no ideal totally harmless parasite evolved? Host and parasite co-evolve: every mechanism the host evolves to reject the parasite is met by a parasite counter-mechanism, so natural selection keeps the arms race running instead of settling on a harmless state (NCERT, p. 200).
Exam Notes: What the Exercises Ask For
The exercise set at the end of the chapter trains three skills, and a full-marks answer needs the right one. Textbook contents and the examinable syllabus are not always identical — check the current official syllabus as well.
Skill 1 — list and define. Many questions reward exact recall. Q1 wants the attributes populations possess but individuals do not (birth and death rates, sex ratio, age distribution); Q3 asks for plant defences against herbivory; Q4 asks you to name the orchid-mango interaction (commensalism); Q6 wants definitions of population and community.
Q7 wants a definition plus one example for each of five terms; Q9 is a one-line multiple-choice question on parasitism; Q10 wants any three characteristics of a population explained. These answers must define a term and then support it with a real example from the chapter.
Skill 2 — one numerical question. Q2 gives a doubling time and asks for r. The method is rearrangement of \( N_t = N_0 e^{rt} \): at doubling \( 2 = e^{rt} \), so \( r = \frac{\ln 2}{t} \). Worked with an original value — a doubling time of 6 years:
- Step 1: \( 2 = e^{6r} \).
- Step 2: \( \ln 2 = 6r \).
- Step 3: \( r = \frac{0.693}{6} \approx 0.116 \).
Final answer: about 0.116 per individual per year.
Apply the identical three steps to the 3-year doubling time in your book.
Skill 3 — diagram and reasoning. Q8 asks you to draw the logistic growth curve: plot N against time, draw the sigmoid S, and label the lag, acceleration, deceleration and asymptote phases, with the asymptote at K — Figure 11.3 is the reference.
Q5 is the reasoning question on biological control, which rests on the predation section: predators regulate prey populations, so an introduced natural predator can control an invasive pest (NCERT, p. 197). A wrong answer tells you which section to revisit.
| Concept | Exercises that test it | Section where taught |
|---|---|---|
| Population attributes | Q1, Q10 | 11.1.1 Population Attributes (p. 191-192) |
| Exponential growth and intrinsic rate r | Q2 | 11.1.2 Population Growth — exponential growth (p. 194) |
| Plant defences against herbivory | Q3 | Population Interactions — predation (p. 198) |
| Commensalism | Q4, Q7(a) | Population Interactions — commensalism (p. 200) |
| Predation and biological control | Q5 | Population Interactions — predation (p. 197) |
| Population and community | Q6 | 11.1 Populations (p. 191) and 11.1.4 (p. 196) |
| Parasitism | Q7(b), Q9 | Population Interactions — parasitism (p. 199-200) |
| Camouflage | Q7(c) | Predation — prey defences (p. 198) |
| Mutualism | Q7(d) | Population Interactions — mutualism (p. 201-202) |
| Interspecific competition | Q7(e) | Population Interactions — competition (p. 198-199) |
| Logistic growth curve | Q8 | 11.1.2 Population Growth — logistic growth (p. 195) |
The book’s in-text discussion questions — the ideal totally harmless parasite, the non-parasitic female mosquito, and the best density measure for a dense bacterial culture — test reasoning. The arguments for the first two appear in Common Mistakes above.
For the bacterial culture, the chapter’s point is that a huge population cannot feasibly be counted, so an alternative measure such as biomass or a relative estimate is needed (NCERT, p. 192).
Revision Summary
A ten-minute recall of the whole chapter, rebuilt from the book’s own summary in plain words (NCERT, p. 202-203).
Ecology is the study of how organisms relate to the abiotic (physico-chemical) and biotic (other species) parts of their environment, at four levels: organisms, populations, communities and biomes.
Evolution acts at the population level, which is why population ecology matters. A population — individuals of a species sharing or competing for similar resources in a defined area — carries attributes no individual has: per capita birth and death rates, sex ratio, and age distribution, whose pyramid shape shows whether the population is stationary, growing or declining.
Population size (density) is judged by changes in four processes: growth through births and immigration, decline through deaths and emigration. With unlimited resources growth is exponential (J-shaped); as resources limit it, growth turns logistic (S-shaped) and stops at the carrying capacity K. The intrinsic rate of natural increase r measures a population’s inherent growth potential.
Life history traits — breeding once or repeatedly, many small or few large offspring — evolve to maximise Darwinian fitness (high r) under the constraints of the habitat.
Species do not live in isolation. The six interactions, with the sign scheme and one example each:
| Interaction | Sign | Outcome | One example from the book |
|---|---|---|---|
| Mutualism | +/+ | Both benefit | Fig tree and its partner wasp |
| Competition | -/- | Both harmed | Balanus and Chthamalus barnacles |
| Predation | +/- | Predator benefits, prey killed | Cactus-feeding moth and prickly pear cactus |
| Parasitism | +/- | Parasite benefits, host harmed | Koel (cuckoo) and crow |
| Commensalism | +/0 | One benefits, other unaffected | Orchid epiphyte on a mango branch |
| Amensalism | -/0 | One harmed, other unaffected | (sign defined in Table 11.1; no named example in the chapter) |
Predation transfers energy up trophic levels, controls prey numbers and can maintain diversity, which is why predators are prudent and why biological control works. Plants defend themselves with thorns and chemicals.
Competition can lead to the Competitive Exclusion Principle, but resource partitioning lets species co-exist. The tightest mutualisms, such as the fig-wasp and Ophrys-orchid partnerships, are products of co-evolution.
Related Resources
This listing is maintained for the 2026-27 academic session using the NCERT textbook information available to us. NCERT remains the authority for confirming the latest edition.
Move to the rest of the book or to revision help for the whole subject.
- NCERT Class 12 Biology book page — all chapters of the textbook in one place.
- Previous chapter — Chapter 10 — the chapter that comes just before Organisms and Populations.
- Next chapter — Chapter 12 Ecosystem — continues population ecology into energy flow and productivity.
For revision, the Class 12 Biology notes, the Class 12 notes hub and the wider CBSE notes library are on this site. The ecosystem notes follow the same unit, and the biotechnology and its applications notes are also available for Class 12 Biology.
The complete catalogue of official NCERT textbooks is available on the NCERT website at ncert.nic.in.
Reference: NCERT Class 12 Biology textbook, chapter 11, official edition on ncert.nic.in.
Sources and Data Verification
The chapter facts, figures and page references on this page describe the NCERT Class 12 Biology textbook, Chapter 11 (Organisms and Populations), printed pages 187-204, official edition published by NCERT.
This page covers Chapter 11 only; neighbouring chapters are linked under Related Resources.
This listing is maintained for the current academic session using the NCERT information available to us.
NCERT settles textbooks, editions and official PDFs; CBSE settles the curriculum, syllabus and examinations.
FAQs on Organisms and Populations Class 12
What is the intrinsic rate of natural increase (r) and how do you calculate it from doubling time?
r is the per capita growth potential of a population — the difference between per capita birth rate b and death rate d (r = b – d), and the parameter used to assess how any factor affects population growth (NCERT, p. 194). To get r from a doubling time, use \( r = \frac{\ln 2}{t} \).
Example: doubling in 4 years gives \( r = \frac{0.693}{4} \approx 0.173 \) per year. The steps are \( 2 = e^{4r} \), then \( \ln 2 = 4r \), then divide.
What is the difference between exponential and logistic population growth?
Exponential growth happens when resources are unlimited: per capita growth is constant, the equation is \( \frac{dN}{dt} = rN \), and the curve is J-shaped.
Logistic growth happens when resources become limiting: a \( \frac{K-N}{K} \) term slows growth as N approaches carrying capacity K, the equation is \( \frac{dN}{dt} = rN\frac{K-N}{K} \), and the curve is S-shaped (NCERT, p. 194-195). Exponential is the idealised model; logistic is more realistic for most animal populations.
Why is a female mosquito not considered a parasite even though it feeds on blood?
Because it takes blood only to support reproduction, not as a way of living on or in a host. Parasites in this chapter are ectoparasites that feed on the host’s external surface or endoparasites that live inside the host; the mosquito’s contact with a human is brief and it does not derive nutrition from the host (NCERT, p. 200).
What is the competitive exclusion principle and when can competing species co-exist?
Gause’s principle: two closely related species competing for the same resources cannot co-exist indefinitely — the competitively inferior one is eventually eliminated (NCERT, p. 199). Co-existence is possible when resources are not limiting, or when species evolve mechanisms that promote living together, notably resource partitioning — MacArthur’s five warbler species feed on the same tree using different foraging behaviours.
How do I draw the logistic population growth curve for the exercise?
Put time t on the horizontal axis and population density N on the vertical axis. Draw the sigmoid S-shape through four phases — lag (slow start), acceleration (steep rise), deceleration (curve bending over), asymptote (flattening) — and mark the asymptote at K, the carrying capacity. Figure 11.3 in the book is the model to copy (NCERT, p. 194-195).
What population attributes do individuals not possess?
Per capita birth and death rates, sex ratio, and age distribution (the age pyramid). An individual has births and deaths as events, not rates; it has one sex, not a ratio; and it has one age, not a distribution (NCERT, p. 191-192).
Explore Class 12 Biology Books
Class 12 Biology on LearnCBSE:
Related chapters: