
Looking for the Ecosystem Class 12 NCERT chapter? This is NCERT Class 12 Biology, Chapter 12 — Ecosystem — pages 204 to 214 of the textbook, and the official PDF is right here on this page.
The official file, lebo112.pdf, is published on NCERT’s own website — open the Ecosystem Class 12 NCERT Biology Chapter 12 PDF to view or save the complete chapter, including every section, figure and exercise, before you start revising.
| What the chapter holds | Count | Where it is used |
|---|---|---|
| Printed pages | 11 | |
| Sections in the chapter | 5 | |
| Figures with NCERT captions | 9 | |
| Exercise questions | 11 | answered in our NCERT Solutions |
| Official NCERT PDF | Download the chapter PDF | the chapter exactly as NCERT publishes it |
Ecosystem Class 12 Chapter at a Glance
The table below shows what the PDF physically contains — its sections, figures and exercise questions — so you know the size and shape of the file before you open it. The chapter runs from page 204 to page 214 of the NCERT textbook, and every page reference in this article uses those same numbers.
Where Each Topic Starts: A Section Map of Chapter 12
The chapter is built from five numbered sections, 12.1 to 12.5, followed by the textbook’s own closing Summary and the Exercises. The table below maps the textbook page where each section starts, so you can jump straight to the part you are stuck on.
| Section | Textbook pages | What it covers |
|---|---|---|
| 12.1 Ecosystem – Structure and Function | pp. 204–206 | Abiotic and biotic components; species composition; stratification; the pond as a self-sustaining model; the four functional aspects |
| 12.2 Productivity | pp. 206–207 | Primary production and its units; GPP; the GPP − R = NPP relation; secondary productivity; the biosphere’s annual net primary productivity of about 170 billion tons |
| 12.3 Decomposition | pp. 207–208 | Detritus and detritivores; fragmentation, leaching, catabolism, humification, mineralisation; factors that control the rate |
| 12.4 Energy Flow | pp. 209–211 | PAR; producers and consumers; grazing and detritus food chains; food webs; trophic levels; standing crop; the 10 per cent law |
| 12.5 Ecological Pyramids | pp. 211–213 | Pyramids of number, biomass and energy; upright and inverted examples; the sea paradox; limitations |
| Summary | p. 213 | The chapter’s own closing consolidation of its main ideas |
| Exercises | pp. 213–214 | Questions testing key terms, concepts, distinctions and descriptions |
Key Concepts in the Ecosystem Chapter, Explained
This section is a second pass over the chapter’s five main topics, in the order the book teaches them. Each concept is explained in plainer language than the textbook uses, with the NCERT page cited so you can follow along in your own book.
Structure: Species Composition and Stratification
Structure is about the parts of an ecosystem and how they are arranged in space. The chapter opens by calling an ecosystem a functional unit of nature — living organisms interacting with one another and with the surrounding physical environment (NCERT, p. 204).
Two features define structure. Species composition is simply which plant and animal species are present, identified and enumerated. Stratification is the vertical distribution of those species in layers — in a forest, trees occupy the top stratum, shrubs the second, and herbs and grasses the bottom layer (NCERT, p. 205).
To show how the pieces work as one unit, the book takes a small pond as a model — a fairly self-sustaining ecosystem, simple enough to read clearly. Its components are:
- Abiotic: the water and its dissolved inorganic and organic substances, the rich soil deposit at the bottom, and the solar input and day-length cycles that regulate how fast the whole pond works.
- Autotrophs: phytoplankton, some algae, and the floating, submerged and marginal plants.
- Consumers: zooplankton, free-swimming forms and bottom-dwelling forms.
- Decomposers: fungi, bacteria and flagellates, most abundant at the pond bottom.
The pond repeats the same loop that runs the whole biosphere: autotrophs build organic matter from inorganic material using sunlight, heterotrophs consume the autotrophs, and decomposers break down dead matter and release inorganic nutrients for reuse. Energy moves one way only — toward higher trophic levels — with a share lost as heat at every step (NCERT, p. 205).
The chapter names four functional aspects that make these components operate as a unit: productivity, decomposition, energy flow and nutrient cycling (NCERT, p. 205). The rest of the chapter is those four ideas in detail.
Productivity: GPP, NPP and the One Formula in the Chapter
Productivity answers a simple question: how fast does an ecosystem make new biomass? It is the input side of the ecosystem — the rate at which plants turn sunlight and inorganic material into living matter.
Primary production is the biomass (organic matter) produced per unit area over a period of time by plants during photosynthesis. It is expressed in weight or energy: grams per square metre (\( \text{g m}^{-2} \)) or kilocalories per square metre (\( \text{kcal m}^{-2} \)).
Productivity is the rate of that production, so its units carry time as well — \( \text{g m}^{-2}\ \text{yr}^{-1} \) or \( \text{kcal m}^{-2}\ \text{yr}^{-1} \) (NCERT, p. 206).
Productivity splits into two parts. Gross primary productivity (GPP) is the total rate at which photosynthesis produces organic matter. Plants immediately use a considerable share of that energy in their own respiration (R). What remains is the net primary productivity (NPP) (NCERT, p. 207):
\[ \text{GPP} – \text{R} = \text{NPP} \]
NPP is the biomass actually available to heterotrophs — the herbivores and decomposers that feed on the producer level. Secondary productivity is a different rate: the rate at which consumers form new organic matter from what they eat (NCERT, p. 207).
Worked example (numbers not from the textbook). Suppose a grassland has a GPP of 40,000 kcal m⁻² yr⁻¹ and plant respiration removes 12,500 kcal m⁻² yr⁻¹:
\[ \text{NPP} = \text{GPP} – \text{R} = 40{,}000 – 12{,}500 = 27{,}500\ \text{kcal m}^{-2}\ \text{yr}^{-1} \]
So 27,500 kcal m⁻² yr⁻¹ is the energy herbivores and decomposers can actually use; the other 12,500 never reaches them because the plants respired it away. When you meet a productivity question, identify GPP, R and NPP before you substitute any number.
Productivity is not uniform. It varies with the plant species present, environmental conditions, the availability of nutrients and the photosynthetic capacity of the plants (NCERT, p. 207).
The chapter gives the global scale: the whole biosphere’s net primary productivity is about 170 billion tons of dry organic matter per year, and although the oceans cover about 70 per cent of the Earth’s surface, they contribute only 55 billion tons — the rest comes from land.
The book then asks you to discuss, with your teacher, the main reason for the ocean’s low productivity. Its own list of controlling factors — nutrient availability, photosynthetic capacity and environmental conditions such as light — is the starting point for that answer.
Decomposition: Five Steps That Recycle Nutrients
Decomposition is the output side of the ecosystem — how dead matter is broken down so its nutrients can be reused. Without it, the minerals locked inside dead bodies would stay locked forever.
The raw material of decomposition is detritus: dead plant remains such as leaves, bark and flowers, dead remains of animals, and even fecal matter (NCERT, p. 207). Decomposition is the breakdown of that complex organic matter into inorganic substances — carbon dioxide, water and nutrients.
The five steps, in the order the book names them, are:
- Fragmentation — detritivores such as earthworms break detritus into smaller particles (NCERT, p. 207).
- Leaching — water carries soluble inorganic nutrients down into the soil, where they precipitate as salts that are temporarily unavailable (NCERT, p. 207).
- Catabolism — enzymes from bacteria and fungi degrade the detritus into simpler inorganic substances (NCERT, p. 207).
- Humification — a dark, amorphous, colloidal substance called humus accumulates. It resists microbial action, decomposes extremely slowly and serves as a reservoir of nutrients (NCERT, p. 208).
- Mineralisation — further microbial action degrades humus and releases inorganic nutrients into the soil (NCERT, p. 208).
One point to hold onto: the first three steps operate on the detritus simultaneously, not one after another, while humification and mineralisation happen in the soil (Figure 12.1).
Decomposition is largely an oxygen-requiring process, and its rate is set by the detritus’s chemistry and by climate. Detritus rich in lignin and chitin decays slowly; detritus rich in nitrogen and water-soluble substances such as sugars decays quickly.
Temperature and soil moisture are the most important climatic controls — warm, moist, aerobic conditions speed decomposition, while cold or waterlogged conditions slow it and let organic material pile up (NCERT, p. 208).
Energy Flow: Food Chains, Webs and the 10 per cent Law
Energy flow tracks what happens to sunlight after plants capture it. It matters because every bite an animal takes is energy that arrived from the sun through a chain of organisms.
Apart from deep-sea hydrothermal ecosystems, the sun is the only energy source for Earth’s ecosystems. Of the incident solar radiation, less than 50 per cent is photosynthetically active radiation (PAR) — the part plants can use — and plants capture only 2–10 per cent of even that. This small amount sustains the entire living world (NCERT, p. 209).
Energy moves in one direction only: from the sun to producers, then to consumers. That is in keeping with the first law of thermodynamics, and the second law explains why the supply must be constant — ecosystems need a steady energy input to counteract the universal drift toward disorder (NCERT, p. 209).
Producers are the green plants — herbaceous and woody plants on land; phytoplankton, algae and higher plants in water. Consumers are heterotrophs: primary consumers (herbivores) eat producers, secondary consumers eat the primary consumers, and tertiary consumers feed on them. Carnivores that eat herbivores are called primary carnivores; carnivores that eat other carnivores are secondary carnivores (NCERT, p. 209).
A grazing food chain starts from living producers. A detritus food chain starts from dead organic matter and is run by decomposers — fungi and bacteria, also called saprotrophs (sapro, to decompose) — which secrete digestive enzymes and absorb the simpler products (NCERT, p. 210).
The chapter’s key contrast: in aquatic ecosystems the grazing food chain is the major conduit of energy, while on land a much larger fraction flows through the detritus food chain. The two chains connect where some detritus-chain organisms are prey for grazing-chain animals, and omnivores such as cockroaches and crows tie them further into a food web (NCERT, p. 210).
An organism’s place in this feeding structure is its trophic level: producers first, herbivores second, carnivores third (NCERT, p. 210). Each level holds a standing crop — the mass of living material (biomass) present at a particular time, measured as mass or number per unit area; dry weight is the more accurate measure (NCERT, p. 210).
Finally, the 10 per cent law: only about 10 per cent of the energy at one trophic level is transferred to the level above it. That is why grazing food chains are short — producer, herbivore, primary carnivore, secondary carnivore is about as far as energy can travel (NCERT, p. 211).
Ecological Pyramids: Number, Biomass and Energy
Ecological pyramids draw the feeding relationship between trophic levels in the familiar pyramid shape: producers form the broad base, each higher level is a smaller bar, and the top consumer sits at the apex (NCERT, p. 211).
There are three kinds. The pyramid of numbers counts organisms at each level. The pyramid of biomass measures the standing crop — mass — at each level. The pyramid of energy measures the energy present at each level per unit area in a given time (NCERT, pp. 211–213).
Two cautions the book insists on. First, a calculation must include all organisms at that trophic level — a few individuals prove nothing. Second, a trophic level is a functional level, not a species: a sparrow is a primary consumer when it eats seeds, fruits and peas, and a secondary consumer when it eats insects and worms (NCERT, p. 212).
In most ecosystems all three pyramids are upright. But there are exceptions, and the chapter wants you to see them:
- Numbers can invert: count the insects feeding on one big tree, then the birds that eat the insects, then the larger birds that eat them — the producer is a single tree, so the base is narrower than the levels above it (NCERT, p. 213).
- Biomass inverts in the sea: at any one time, the biomass of fishes exceeds the standing crop of phytoplankton. The paradox resolves because phytoplankton are tiny, short-lived and consumed extremely fast, so a small standing crop still has enough productivity to support the levels above (NCERT, pp. 212–213).
- Energy is never inverted: some energy is always lost as heat at each transfer, so every higher level holds less energy than the one below (NCERT, p. 213).
Ecological pyramids have limits: they assume a simple food chain, which almost never exists; they leave no room for a food web; they ignore species that occupy more than one trophic level; and saprophytes get no place even though they are vital (NCERT, p. 213).
| Pyramid type | What it measures | When it can be inverted | Example from the chapter |
|---|---|---|---|
| Pyramid of numbers | The count of organisms at each trophic level | When one large producer supports many consumers | A single big tree feeding many insects (NCERT, p. 213) |
| Pyramid of biomass | The standing crop (mass) at each level | When a small standing crop supports a larger one, as in the sea | Fish biomass exceeding phytoplankton biomass (NCERT, p. 212) |
| Pyramid of energy | Energy present at each level per unit area over time | Never — energy is lost as heat at every transfer | Producers converting only 1% of available sunlight energy into NPP (NCERT, p. 213) |
Key Terms and Definitions Used in Chapter 12
This table is a lookup list: every term NCERT defines in the chapter, in one line each, with the page where the definition appears. Use it when you hit a word you cannot recall.
| Term | Plain definition | NCERT page |
|---|---|---|
| Ecosystem | A functional unit of nature in which living organisms interact with each other and their physical environment | 204 |
| Stratification | The vertical distribution of species in layers, such as trees, shrubs and herbs in a forest | 205 |
| Primary production | Biomass produced per unit area over a time period by plants during photosynthesis | 206 |
| Productivity | The rate of biomass production, expressed per unit area per year | 206 |
| Gross primary productivity (GPP) | The total rate of production of organic matter during photosynthesis | 207 |
| Net primary productivity (NPP) | GPP minus respiration losses; the biomass actually available to heterotrophs | 207 |
| Secondary productivity | The rate at which consumers form new organic matter from the food they assimilate | 207 |
| Detritus | Dead organic material — plant remains, animal remains and fecal matter — that fuels decomposition | 207 |
| Decomposition | Breakdown of complex organic matter into inorganic substances such as carbon dioxide, water and nutrients | 207 |
| Fragmentation | Detritivores such as earthworms breaking detritus into smaller particles | 207 |
| Leaching | Water-soluble inorganic nutrients moving down into the soil and precipitating as unavailable salts | 207 |
| Catabolism | Bacterial and fungal enzymes degrading detritus into simpler inorganic substances | 207 |
| Humification | Accumulation of a dark, colloidal, microbe-resistant substance called humus | 208 |
| Mineralisation | Release of inorganic nutrients when microbes further degrade humus | 208 |
| Photosynthetically active radiation (PAR) | The fraction of incident solar radiation — less than 50 per cent — that plants can use for photosynthesis | 209 |
| Producers | Green plants (autotrophs) that fix solar energy into food | 209 |
| Consumers | Heterotrophs that depend on producers directly or indirectly for food | 209 |
| Saprotrophs | Decomposers, mainly fungi and bacteria, that degrade dead organic matter; sapro means to decompose | 210 |
| Trophic level | An organism’s position in a food chain based on its source of nutrition | 210 |
| Standing crop | The mass of living material (biomass) present at a trophic level at a particular time | 210–211 |
The Figures in Chapter 12, Explained
The diagrams below are the figures in the chapter, in the order the book prints them, each with a short explanation of what to look for. They matter because several that look decorative — the decomposition cycle and the sea’s inverted biomass pyramid — are where the chapter’s hardest ideas actually live.
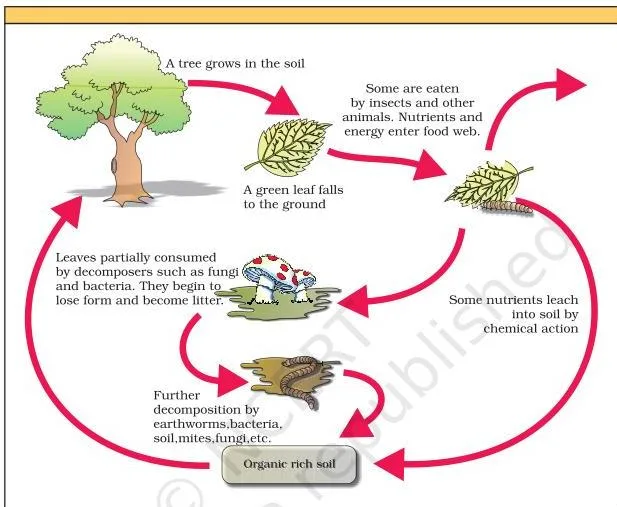
Follow the loop: detritus enters, and the first steps — fragmentation, leaching and catabolism — work on it together, not one after another. The products feed humification and mineralisation in the soil, and the cycle ends by returning inorganic nutrients to the soil where producers can reuse them. That circularity is the whole point: decomposition closes the nutrient loop that photosynthesis opens.

Trace the arrows the way the book describes the chain: a producer is eaten by a primary consumer (an herbivore), which is eaten by a primary carnivore, which is eaten by a secondary carnivore. Each step moves energy upward and loses most of it as heat — which is why chains this simple are short.
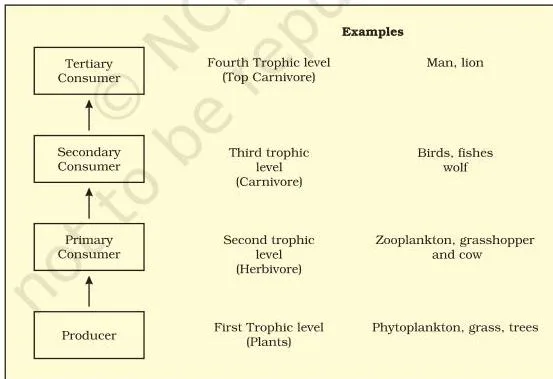
The figure arranges organisms by their feeding position, not by their species. Producers sit on the first level, herbivores (primary consumers) on the second, and carnivores (secondary consumers) on the third. An organism’s level changes with what it eats — the same species can stand on different levels at different times.
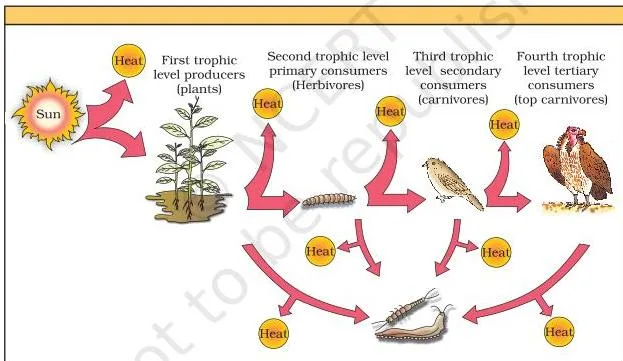
This is the 10 per cent law in picture form. The arrows run in one direction only — no arrow points back down — and each higher level receives only a fraction of the energy that reached the level below it. That is why the flow needs a constant solar input and why the chain cannot extend indefinitely.
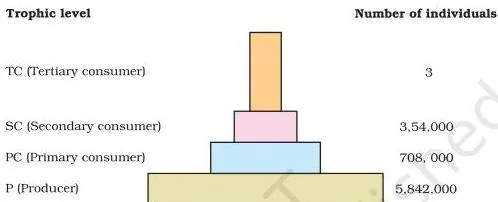
Count the organisms per level: millions of plants at the base, fewer herbivores above them, still fewer carnivores, and only about three top-carnivores at the apex. The shape is the familiar broad pyramid — in this ecosystem, numbers shrink at every higher level.
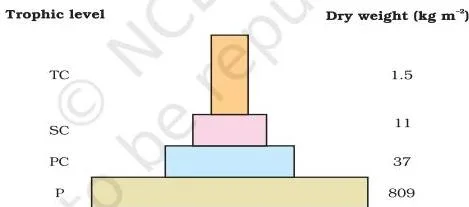
Here each bar is the standing crop — the mass of living material — at that level, not the count of individuals. The bars narrow sharply because biomass shrinks as you move up: herbivores weigh far less in total than the plants they eat, and carnivores less again.
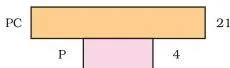
This is the chapter’s famous puzzle. The pyramid is upside down: at any one time the standing crop of phytoplankton is small while the zooplankton and fish biomass above it is large. The resolution is that phytoplankton are tiny, short-lived and consumed extremely fast, so their standing crop stays small even though their productivity easily supports the levels above.

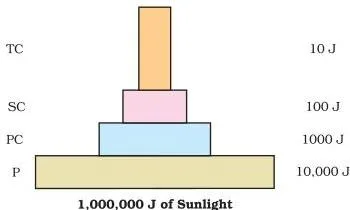
Each bar is the energy present at that trophic level in a given time per unit area. Notice how steep the loss is: primary producers convert only about 1 per cent of the sunlight energy available to them into net primary productivity, and every transfer above them loses energy as heat.
Because energy always decreases upward, this pyramid can never be inverted.
Mistakes Students Make in the Ecosystem Chapter
This chapter reliably produces a handful of confusions. The table below names each one, gives the rule that corrects it, and tells you how to check your own answer — most of the corrections come straight from questions the textbook itself asks.
| Mistake | Correct rule | How to check your answer |
|---|---|---|
| Confusing GPP with NPP | Plants respire away a considerable share of what they produce; NPP = GPP − R (NCERT, p. 207) | Always subtract the respiration loss; NPP is the biomass actually available to herbivores and decomposers |
| Confusing PAR with what plants capture | PAR is less than 50% of incident solar radiation; plants capture only 2–10% of PAR (NCERT, p. 209) | Keep the two percentages in order: less than half of sunlight is PAR, and a tenth or less of that becomes plant production |
| Believing every ecological pyramid is upright | Numbers can invert (a single tree feeding many insects) and the sea’s biomass pyramid is inverted; only the energy pyramid is always upright (NCERT, pp. 212–213) | Ask which quantity the pyramid measures — count, mass or energy — before deciding its shape |
| Treating a trophic level as a species | It is a functional level: a sparrow is a primary consumer on seeds and a secondary consumer on insects (NCERT, p. 212) | Ask ‘what is this organism eating right now?’, not ‘which species is it?’ |
| Mixing up humification and mineralisation | Humification builds humus, a colloidal nutrient reservoir; mineralisation releases inorganic nutrients from humus (NCERT, pp. 207–208) | Humus forms first (a store), then microbes degrade it to release nutrients (a release) |
| Equating litter with detritus | Litter is plant debris such as leaves, bark and flowers; detritus is the wider raw material that also includes animal remains and fecal matter (NCERT, p. 207) — the book’s own exercise asks this distinction | If the material came only from plants it is litter; detritus includes dead animals and waste too |
| Thinking energy disappears at each trophic level | Energy is converted and lost as heat at each transfer, which is why flow is unidirectional (NCERT, pp. 209, 213) | The energy is gone from the system’s usable pool, not destroyed — that is why a constant solar input is needed |
How NCERT Tests This Chapter: Exercises and In-Text Questions
The chapter’s own exercises show what NCERT expects you to be able to do with this material — and one honest caution first: textbook contents and the examinable syllabus are not always identical — check the current official syllabus.
The questions fall into four groups, and each group tests a different skill:
- Fill-in-the-blank (Q1). Each blank pulls a single key term from the chapter: the name for plants that fix carbon dioxide, the shape of the numbers pyramid under a tree-dominated ecosystem, the limiting factor for aquatic productivity, a common detritivore, and the major reservoir of carbon on Earth. These reward knowing the vocabulary cold.
- Multiple-choice (Q2–Q5). These test precise facts: which group holds the largest population in a food chain, the second trophic level in a lake, what ‘secondary producers’ means, and the percentage of PAR in incident solar radiation. Each question has one correct option and three distractors drawn from chapter concepts.
- Distinguish between (Q6a–f). Six paired concepts: grazing and detritus food chains, production and decomposition, upright and inverted pyramids, food chain and food web, litter and detritus, primary and secondary productivity. The habit that answers all six: give the definition of each term, then one clear point of difference.
- Descriptive answers (Q7–Q11). The long answers ask for the components of an ecosystem, ecological pyramids with examples, primary productivity and its factors, decomposition and its processes and products, and an account of energy flow. A full answer names the concept, uses the chapter’s example, and closes with why it matters — decomposition matters, for instance, because it returns inorganic nutrients to the soil (NCERT, p. 208).
The in-text questions are the applied ones
Scattered through the chapter are italicised thinking prompts: discuss the main reason for the low productivity of the ocean with your teacher (p. 207), decide how you would classify human beings (p. 210), work out how many trophic levels human beings occupy in a food chain (p. 213), and consider whether the detritus food chain has the same length limitation as the grazing one (p. 211).
These ask you to apply trophic-level and energy concepts to real organisms — the same skill the descriptive questions then test.
The one equation in the chapter
GPP − R = NPP is the chapter’s only formula (NCERT, p. 207). Know what each symbol stands for, and know the units productivity is measured in — \( \text{g m}^{-2}\ \text{yr}^{-1} \) or \( \text{kcal m}^{-2}\ \text{yr}^{-1} \).
The book gives no numerical example, so run the worked example in the Key Concepts section until the procedure is automatic: the numbers in a question may change, the subtraction never does.
What to Remember from the Ecosystem Chapter
This closing list is built from the consolidation NCERT prints at the end of the chapter (NCERT, p. 213), restated so it reads quickly the night before.
- An ecosystem is a structural and functional unit of nature made of two halves: abiotic components (inorganic materials — air, water, soil) and biotic components (producers, consumers, decomposers).
- The two main structural features of an ecosystem are its species composition and its stratification.
- The four functional aspects are productivity, decomposition, energy flow and nutrient cycling.
- Productivity splits into gross primary productivity (total production during photosynthesis), net primary productivity (what remains after producer respiration) and secondary productivity (the rate at which consumers assimilate food energy).
- Decomposition converts the complex organic compounds of detritus into carbon dioxide, water and inorganic nutrients through fragmentation, leaching and catabolism — with humification and mineralisation completing the process in the soil.
- Energy flow is unidirectional: plants capture solar energy, then food energy passes from producers to consumers and decomposers, linking organisms of different trophic levels into food chains.
- Nutrient cycling is the storage and movement of nutrient elements through the ecosystem, in two types — gaseous (carbon; reservoir the atmosphere or hydrosphere) and sedimentary (phosphorus; reservoir the Earth’s crust).
- Products of these ecosystem processes are called ecosystem services — purification of air and water by forests is the chapter’s own example.
Related NCERT Class 12 Biology Chapters
This is Chapter 12 of the NCERT Class 12 Biology book. The previous chapter, Organisms and Populations (Chapter 11), sets up the organism, population and community ecology that this chapter extends to the level of the whole ecosystem. The next chapter, Biodiversity and Conservation (Chapter 13), follows directly from the species and ecosystem focus of this one.
Both belong to the Class 12 Biology NCERT book, part of the full Class 12 NCERT books set.
For condensed revision of the surrounding chapters, our Organisms and Populations notes and Biodiversity and Conservation notes sit in the Class 12 Biology notes collection, alongside the rest of the Class 12 notes and CBSE notes.
Sources and Data Verification
This listing is maintained for the 2026-27 academic session using the NCERT textbook information available to us. NCERT remains the authority for confirming the latest edition.
The figures and page references on this page describe the NCERT Class 12 Biology textbook (current rationalised edition), Chapter 12 ‘Ecosystem’, pages 204–214, as published on ncert.nic.in. The chapter file is lebo112.pdf, hosted on NCERT’s official site and listed alongside all the other chapter PDFs on the official Class 12 Biology textbook page.
This page covers that NCERT textbook only, not other publishers’ books, and it is maintained for the current academic session using the NCERT information available to us. NCERT settles textbook contents, editions and official PDFs; CBSE settles the curriculum, syllabus and examinations — so for exam weightage and any excluded topics, check the current official CBSE syllabus.
Reference: NCERT Class 12 Biology textbook, chapter 12, official edition on ncert.nic.in.
Frequently Asked Questions
What is the difference between gross primary productivity and net primary productivity?
Gross primary productivity (GPP) is the total rate at which plants produce organic matter during photosynthesis. Net primary productivity (NPP) is what remains after the plants’ own respiration losses are subtracted: GPP − R = NPP. NPP is the biomass actually available to herbivores and decomposers (NCERT, p. 207).
Why is the pyramid of energy always upright and never inverted?
Because energy is lost as heat at every transfer between trophic levels, each higher level always holds less energy than the one below it. A level can never contain more energy than the level that feeds it, so an inverted energy pyramid is impossible (NCERT, p. 213).
Why is the pyramid of biomass inverted in the sea?
Because the pyramid is drawn from standing crop measured at one moment. The standing crop of phytoplankton is small — they are tiny, short-lived and consumed very fast — yet their productivity is high enough to support the larger fish and zooplankton biomass above them (NCERT, pp. 212–213).
What are the five steps of decomposition in the correct order?
Fragmentation (detritivores break detritus into smaller particles), leaching (water-soluble nutrients are washed down and precipitate as salts), catabolism (bacterial and fungal enzymes simplify the detritus), humification (formation of humus) and mineralisation (release of inorganic nutrients from humus). The steps act on detritus simultaneously (NCERT, pp. 207–208).
What does the 10 per cent law say about energy transfer between trophic levels?
Only about 10 per cent of the energy at one trophic level is transferred to the next level. Because so little carries forward, grazing food chains can support only a limited number of trophic levels (NCERT, p. 211).
How do I download the official NCERT Class 12 Biology Ecosystem chapter PDF?
Use the Ecosystem Class 12 NCERT Biology Chapter 12 PDF link near the top of this page — it points directly to the official NCERT file lebo112.pdf on ncert.nic.in, so what you download is the exact textbook chapter the syllabus refers to.
Explore Class 12 Biology Books
Class 12 Biology on LearnCBSE:
Related chapters: