
The biodiversity and conservation class 12 chapter is the thirteenth and final chapter of the NCERT Class 12 Biology textbook — thirteen pages, from the chapter opener on page 215 to the exercises on page 227.
The official NCERT PDF of this chapter is right here: download it below, or read on for a plain-language map of what the chapter holds — the species counts, the two global patterns, the four causes of loss, and how conservation works.
Download the Biodiversity and Conservation Class 12 PDF
This one official file contains everything the chapter teaches, exactly as NCERT prints it — every figure, the summary and the exercises at the end.
Download the Biodiversity and Conservation Class 12 NCERT Chapter 13 PDF straight from ncert.nic.in — the official file your textbook is printed from, which opens in any browser or phone PDF reader.
If the direct chapter file ever moves, the official Class 12 Biology textbook page at NCERT lists every chapter PDF of the book for download.
| What the chapter holds | Count | Where it is used |
|---|---|---|
| Printed pages | 13 | |
| Sections in the chapter | 10 | |
| Figures with NCERT captions | 3 | |
| Exercise questions | 10 | answered in our NCERT Solutions |
| Official NCERT PDF | Download the chapter PDF | the chapter exactly as NCERT publishes it |
Chapter 13 at a Glance
The table below shows what is inside the chapter file — its sections, its figures and its exercise questions — so you can see at a glance how the chapter is built. The chapter itself runs from NCERT page 215 and closes the book; the section map just below tells you where each part sits.
What This Chapter Covers: From an Alien’s Question to the Earth Summit
The chapter answers two questions: what biodiversity is and why it is being lost, and why and how we should conserve it. Use the map below to jump straight to the part you need.
- Chapter opener and section 13.1 — the “alien visitor” vignette and the three levels of diversity: genetic, species and ecological (NCERT, p. 215-216).
- 13.1.1 How many species are there on Earth and in India? — the 1.5 million described species, Robert May’s estimate, and India’s megadiversity status (NCERT, p. 217-218).
- 13.1.2 Patterns of biodiversity — latitudinal gradients and the species-area relationship, including the log equation (NCERT, p. 219-220).
- 13.1.3 The importance of species diversity to the ecosystem — what stability means and the rivet popper hypothesis (NCERT, p. 220-221).
- 13.1.4 Loss of biodiversity — the sixth extinction and the Evil Quartet (NCERT, p. 221-223).
- 13.2.1 Why should we conserve biodiversity? — narrowly utilitarian, broadly utilitarian and ethical arguments (NCERT, p. 223-224).
- 13.2.2 How do we conserve biodiversity? — in situ and ex situ approaches, hotspots, sacred groves, and the Rio and Johannesburg summits (NCERT, p. 224-225).
- Summary and Exercises — the chapter’s own closing summary (NCERT, p. 225-226) and its ten exercise questions (NCERT, p. 226-227).
Key Concepts in Biodiversity and Conservation
The chapter’s argument runs in four steps: biodiversity is layered, patterned, under threat, and worth saving. Follow those four steps and the whole chapter clicks into place.
The three levels of diversity
Biodiversity is not just a count of species. The term, popularised by the sociobiologist Edward Wilson, means combined diversity at every level of biological organisation, and the book singles out three levels that matter most (NCERT, p. 215).
| Level | What it means | Example from the chapter |
|---|---|---|
| Genetic diversity | Variation within a single species across its distributional range | The medicinal plant Rauwolfia vomitoria shows different potency and concentration of the active chemical reserpine across Himalayan ranges; India has more than 50,000 strains of rice and 1,000 varieties of mango (p. 215-216) |
| Species diversity | Variety of species found in a region | The Western Ghats have greater amphibian species diversity than the Eastern Ghats (p. 216) |
| Ecological diversity | Variety of ecosystems in a region | India’s deserts, rain forests, mangroves, coral reefs, wetlands, estuaries and alpine meadows give it greater ecosystem diversity than a country like Norway (p. 216) |
The chapter’s warning sits right after these examples: this diversity took millions of years of evolution to accumulate, and at present rates of loss it could be gone in less than two centuries (NCERT, p. 216).
How many species are there on Earth and in India?
This is the chapter’s headline data — the numbers you quote in answers about the scale of global biodiversity. The section also explains honestly why the total is not fully known (NCERT, p. 217).
- Recorded so far: slightly more than 1.5 million plant and animal species, according to the IUCN (2004). Estimates of undiscovered species range from 20 to 50 million; Robert May’s more conservative estimate puts the global total at about 7 million (NCERT, p. 217).
- Animals dominate: more than 70% of all recorded species are animals; plants — algae, fungi, bryophytes, gymnosperms and angiosperms together — make up no more than 22%. Among animals, insects are the most species-rich group at more than 70%, so 7 out of every 10 animals is an insect. Fungi alone outnumber the combined total of fishes, amphibians, reptiles and mammals (NCERT, p. 217).
- Prokaryotes are not counted: conventional methods cannot identify most microbial species and many will not grow in culture, so their true diversity might run into millions (NCERT, p. 218).
- India’s share: 2.4% of the world’s land area holds 8.1% of global species diversity, making India one of the 12 megadiversity countries. Nearly 45,000 plant species and twice as many animal species are recorded; if only about 22% of species are described, then more than 1,00,000 plant species and more than 3,00,000 animal species may still be waiting in India (NCERT, p. 217-218).
Pattern 1: Why the tropics hold more species
The first pattern is a geographic one: species diversity decreases as you move from the equator towards the poles. With very few exceptions, the tropics — between \(23.5^\circ\) N and \(23.5^\circ\) S — hold more species than temperate or polar areas (NCERT, p. 218-219).
- Colombia, near the equator, has nearly 1,400 bird species; New York at 41° N has 105; Greenland at 71° N has 56. India, mostly tropical, has more than 1,200 (NCERT, p. 219).
- A tropical forest in Ecuador can hold up to 10 times the vascular plant species of an equal-area forest in the temperate Midwest of the USA. The Amazonian rainforest alone is home to more than 40,000 plant species, 3,000 fishes, 1,300 birds and over 1,25,000 invertebrates, with perhaps two million insect species still waiting there (NCERT, p. 219).
The chapter offers three hypotheses for tropical richness (NCERT, p. 218-219):
- Evolutionary time: the tropics were not subjected to the glaciations of temperate regions, so they had a long, undisturbed period for species diversification.
- Constant environment: tropical climates are less seasonal and more predictable, which promotes niche specialisation and therefore more species.
- More solar energy: higher energy input drives higher productivity, which indirectly supports greater diversity.
Pattern 2: The species-area relationship
The second pattern is quantitative. Alexander von Humboldt found that within a region, species richness increases with explored area — but only up to a limit. Across many taxa the relation is a rectangular hyperbola (NCERT, p. 219).
Plot the same data on a logarithmic scale and the curve becomes a straight line, described by the equation:
\[ \log S = \log C + Z \log A \]
where \(S\) is species richness, \(A\) is the area, \(Z\) is the slope of the line (the regression coefficient) and \(C\) is the Y-intercept. Logarithms are base 10 (NCERT, p. 220).
- Within a region, \(Z\) runs from 0.1 to 0.2 — for plants in Britain, birds in California or molluscs in New York state, the slope is amazingly similar (NCERT, p. 220).
- Across very large areas like whole continents, \(Z\) is much steeper, from 0.6 to 1.2. For frugivorous birds and mammals in the tropical forests of different continents, the slope is 1.15 (NCERT, p. 220).
What do steeper slopes mean? The larger \(Z\), the more species you gain per unit of area — area matters far more across continents than within a single region. The worked example below makes this concrete.
Species diversity, stability and the rivet popper hypothesis
Does the number of species in a community actually change how the ecosystem runs? This section’s short answer is yes, and it gives two pieces of evidence plus an analogy (NCERT, p. 220).
- A stable community, as the book defines it, shows little year-to-year variation in productivity, resists or recovers from disturbances, and resists invasion by alien species (NCERT, p. 220).
- David Tilman’s long-term field plots showed that plots with more species had less year-to-year variation in total biomass, and that higher diversity contributed to higher productivity (NCERT, p. 220-221).
- Paul Ehrlich’s rivet popper hypothesis compares an ecosystem to an aeroplane and species to its rivets. A passenger popping one rivet at a time does not crash the flight at first, but the plane grows dangerously weak as rivets are removed. Crucially, which rivet is removed matters — rivets on the wing, the key species driving major ecosystem functions, are far more serious losses than rivets on seats or windows (NCERT, p. 220).
The Evil Quartet: four causes of biodiversity loss
Human activity drives the current extinction crisis through four distinct channels, together nicknamed the Evil Quartet. This is one of the chapter’s most quoted ideas, so pair each cause with its example (NCERT, p. 221-222).
| Cause | Mechanism | Examples from the chapter |
|---|---|---|
| Habitat loss and fragmentation | The most important cause; habitats are destroyed outright or broken into small fragments that cannot support large or migratory species | Tropical rainforests once covered more than 14% of the Earth’s land surface and now cover no more than 6%; the Amazon is cleared for soya and beef-cattle grassland; fragmentation badly affects mammals and birds needing large territories (p. 222) |
| Over-exploitation | When human need turns to greed, species are taken faster than they can recover | Steller’s sea cow and the passenger pigeon; today several marine fish populations are over-harvested (p. 222) |
| Alien species invasions | Species introduced deliberately or accidentally turn invasive and wipe out indigenous species | Nile perch drove more than 200 cichlid fish species to extinction in Lake Victoria; the weeds Parthenium, Lantana and water hyacinth (Eicchornia) damage native ecosystems; the illegally introduced African catfish Clarias gariepinus threatens native river catfishes (p. 222) |
| Co-extinctions | Species obligately associated with an extinct species die out along with it | When a host fish goes extinct, its unique parasites go too; in a plant-pollinator mutualism, the loss of one partner ends the other (p. 222-223) |
The section’s extinction data: the IUCN Red List (2004) documents 784 species — 338 vertebrates, 359 invertebrates and 87 plants — extinct in the last 500 years, and more than 15,500 species worldwide now face the threat of extinction (NCERT, p. 221).
Current extinction rates are 100 to 1,000 times faster than pre-human times, which is why ecologists call this the sixth mass extinction; if present trends continue, nearly half of all species might be gone within the next 100 years (NCERT, p. 222).
Why conserve biodiversity, and how
Once we accept that biodiversity is falling, two questions follow: why should we bother, and what do we actually do about it. The chapter’s answers are one list of arguments and one list of methods (NCERT, p. 223).
There are three arguments for conserving biodiversity (NCERT, p. 223-224):
- Narrowly utilitarian — direct economic benefits: food, firewood, fibre, construction material, industrial products (tannins, lubricants, dyes, resins, perfumes) and medicines. More than 25% of drugs sold worldwide come from plants, 25,000 plant species feed traditional medicines, and bioprospecting — exploring molecular, genetic and species-level diversity for products of economic importance — is a growing national asset.
- Broadly utilitarian — ecosystem services: the Amazon produces about 20% of the Earth’s oxygen through photosynthesis; natural pollinators such as bees, bumblebees, birds and bats make fruits and seeds possible; and there are aesthetic pleasures like woods, spring flowers and birdsong that no one can price.
- Ethical — every species has intrinsic value, whether or not it is useful to us, and we have a moral duty to pass the biological legacy on in good order to future generations.
The how — in situ (on-site) versus ex situ (off-site) conservation (NCERT, p. 224-225):
| Approach | What it does | How it is done | Indian examples |
|---|---|---|---|
| In situ (on-site) | Protects the whole ecosystem so its biodiversity is protected at all levels — “we save the entire forest to save the tiger” | Biodiversity hotspots, biosphere reserves, national parks, wildlife sanctuaries, sacred groves | Three of the world’s 34 hotspots cover India: Western Ghats-Sri Lanka, Indo-Burma and Himalaya; India has 14 biosphere reserves, 90 national parks and 448 wildlife sanctuaries; sacred groves are found in the Khasi and Jaintia Hills, the Aravalli Hills, Western Ghats regions and parts of Madhya Pradesh |
| Ex situ (off-site) | Moves endangered or threatened species out of their natural habitat into settings where they get special care | Zoological parks, botanical gardens, wildlife safari parks; cryopreservation of gametes, in vitro fertilisation, tissue culture, seed banks | Animals that are extinct in the wild continue to be maintained in zoological parks; seeds of different genetic strains of commercially important plants are stored in seed banks |
Two facts to attach to hotspots: they are regions with very high species richness, high endemism (species confined to that region and found nowhere else) and accelerated habitat loss. All 34 hotspots together cover less than 2% of the Earth’s land, yet strict protection of them could reduce ongoing mass extinctions by almost 30% (NCERT, p. 224).
The chapter closes its conservation story with two international commitments: the Convention on Biological Diversity at the Earth Summit in Rio de Janeiro (1992), and the Johannesburg World Summit on Sustainable Development (2002), where 190 countries pledged to significantly reduce the rate of biodiversity loss by 2010 (NCERT, p. 225).
Using the Species-Area Equation: A Worked Example
The species-area equation is the only calculation in this chapter, and the book leaves it to you to practise. Here it is worked through with fresh numbers so you can check every step on a phone calculator.
\[ \log S = \log C + Z \log A \]
Meaning of each symbol: \(S\) = species richness, \(A\) = area, \(Z\) = slope of the line (regression coefficient), \(C\) = Y-intercept. Logarithms are base 10, so \(\log 10 = 1\), \(\log 100 = 2\), \(\log 1000 = 3\) (NCERT, p. 220).
Scenario 1 — within a region, Z = 0.2.
Take \(\log C = 1.78\).
An area of 10 gives \(\log A = 1\):
\[ \log S = 1.78 + 0.2 \times 1 = 1.98 \]
So \(S = 10^{1.98} \approx 95\) species.
Step 2 — same region, area 100 times larger: \(A = 1000\) gives \(\log A = 3\):
\[ \log S = 1.78 + 0.2 \times 3 = 1.78 + 0.6 = 2.38 \]
So \(S = 10^{2.38} \approx 240\) species.
Read the result: a hundred fold increase in area raises the number of species only about two and a half times (240 ÷ 95 ≈ 2.5). That is the rectangular hyperbola in action — species rise quickly at first, then flatten. This is exactly the \(Z = 0.1\, – \,0.2\) within-region behaviour the chapter describes.
Scenario 2 — across continents, Z = 1.15.
Keep \(\log C = 1.78\) and compare the same two areas:
\[ A = 10:\ \log S = 1.78 + 1.15 \times 1 = 2.93 \Rightarrow S \approx 850 \]
\[ A = 1000:\ \log S = 1.78 + 1.15 \times 3 = 1.78 + 3.45 = 5.23 \Rightarrow S \approx 170{,}000 \]
The same hundred-fold increase in area now multiplies species about two hundred times.
That contrast answers the chapter’s own question, “What do steeper slopes mean?” A steep \(Z\) (0.6 to 1.2) means area is enormously important — small patches hold far fewer species, so large connected habitats matter. A shallow \(Z\) (0.1 to 0.2) means the curve saturates quickly and extra area buys little.
Quick check that saves mistakes: for equal \(C\), the species ratio of two areas is simply \((A_2/A_1)^Z\). Doubling area multiplies species by \(2^Z\): about 1.15 for \(Z = 0.2\), about 2.2 for \(Z = 1.15\).
Reading the Chapter’s Figures
Two figures carry the chapter’s key quantitative claims. Learn to read them and the numbers stop being a list to memorise.
Figure 13.1: Global biodiversity at a glance
This diagram shows the recorded species of major taxa in proportion — the visual version of the percentages in section 13.1.1 (NCERT, p. 218).
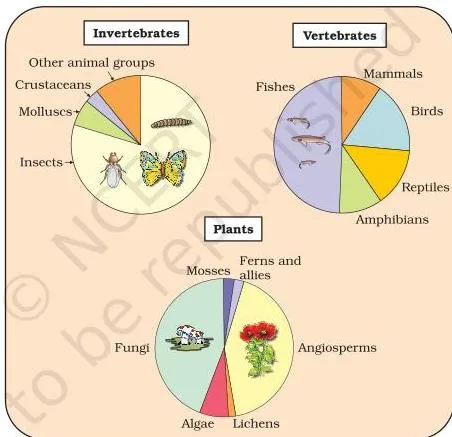
Read it in three steps. First, animals take the largest share of the diagram: more than 70% of all recorded species are animals, so the animal section dominates the whole. Second, inside that section, insects are by far the biggest chunk — more than 70% of animals are insects, which puts insects at roughly half of everything described.
Third, plants make up no more than 22%, and the fungi block is bigger than all the vertebrates combined. The diagram also quietly leaves out prokaryotes, which the text says are too poorly known to count (NCERT, p. 217-218).
Figure 13.2: The species-area curve
This figure is the visual proof behind the equation in the worked example above (NCERT, p. 220).
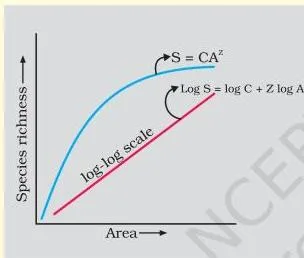
The graph plots species richness against area. On ordinary axes the relationship is a curve that climbs steeply at first and then levels off — the rectangular hyperbola. On a log-log scale, the same relationship becomes a straight line; the slope of that line is \(Z\).
A gentle line (0.1 to 0.2) means species accumulate slowly with area; a steep line (0.6 to 1.2) means area dominates. That is why the worked example above produced a two-and-a-half-fold rise for a shallow slope and a two-hundred-fold rise for a steep one.
Biodiversity and Conservation: Key Definitions
When a term comes up and you blank on its exact meaning, this table is the fastest fix. Each entry points to where the chapter defines or uses it.
| Term | Plain meaning | NCERT page |
|---|---|---|
| Biodiversity | Combined diversity at all levels of biological organisation, from macromolecules to biomes; the term was popularised by Edward Wilson | p. 215 |
| Genetic diversity | Variation within a single species over its distributional range — India’s rice strains and mango varieties are examples | p. 215-216 |
| Species diversity | Variety of species in a region, such as the amphibian diversity of the Western Ghats versus the Eastern Ghats | p. 216 |
| Ecological diversity | Variety of ecosystems in a region — India’s deserts, mangroves and coral reefs versus Norway’s fewer ecosystem types | p. 216 |
| Megadiversity country | One of 12 countries holding a strikingly large share of global diversity; India has 2.4% of the world’s land but 8.1% of its species | p. 217 |
| Latitudinal gradient | The pattern in which species diversity decreases as we move from the equator toward the poles | p. 218 |
| Species-area relationship | The relation between species richness and area — a rectangular hyperbola that becomes a straight line on a log-log scale | p. 219-220 |
| Rivet popper hypothesis | Ehrlich’s analogy treating species as rivets of an ecosystem-airplane; losing many rivets — or one key rivet — dangerously weakens the system | p. 220 |
| Alien (invasive) species | A species introduced deliberately or accidentally into a region where it is not native, which can cause decline or extinction of indigenous species | p. 222 |
| Co-extinction | Extinction of species obligately associated with a species that has already died out — parasites with their host fish, mutualists with their partner | p. 222-223 |
| Evil Quartet | The four major human-driven causes of biodiversity loss: habitat loss and fragmentation, over-exploitation, alien invasions and co-extinctions | p. 221-222 |
| Bioprospecting | Exploring molecular, genetic and species-level diversity for products of economic importance | p. 223 |
| Endemism | The state of being confined to one region and found nowhere else | p. 224 |
| Biodiversity hotspot | A region with very high species richness and high endemism that is also under accelerated habitat loss; 34 exist worldwide | p. 224 |
| Sacred groves | Tracts of forest set aside by cultural or religious tradition, where all trees and wildlife are venerated and given total protection | p. 224 |
| In situ conservation | On-site conservation — protecting the whole ecosystem so that species are protected in their natural habitat | p. 224 |
| Ex situ conservation | Off-site conservation — moving threatened species into zoos, botanical gardens, seed banks, tissue culture or cryopreservation | p. 224-225 |
Common Mistakes Students Make in This Chapter
Every trap in this chapter is in the wording — percentages that seem to mean one thing and mean another, and example lists that get swapped under time pressure. Fix them here, before a test, and they stop being traps.
| Mistake | Correct rule | How to check your answer |
|---|---|---|
| Calling India’s 50,000 rice strains or 1,000 mango varieties “species diversity” | They are genetic diversity — variation within a single species. The species-level example is Western Ghats versus Eastern Ghats amphibians | Ask: within one species or between species? One species means genetic |
| “Insects are 70% of all species” | More than 70% of recorded species are animals; insects are more than 70% of animals — 7 out of every 10 animals | Remember the chapter’s line “out of every 10 animals, 7 are insects”; plants are only 22% |
| Using \(Z = 0.1\, – \,0.2\) for whole continents | \(Z\) is 0.1-0.2 within a region, but 0.6-1.2 for very large areas like continents (1.15 for frugivorous birds and mammals) | Ask: within one region or across very large areas? |
| “The rivet popper hypothesis means any species can vanish and the ecosystem copes” | Loss builds up dangerously over time — and which rivet is removed is critical, because wing rivets (key species) matter most | Check that your answer includes the “which rivet” point |
| “784 species are currently threatened” | 784 species were documented extinct in the last 500 years; more than 15,500 currently face the threat of extinction, over 650 of them in India | Keep the “last 500 years” qualifier attached to 784; extinct and threatened are different lists |
| “India has 34 biodiversity hotspots” | 34 hotspots exist worldwide; three cover India — Western Ghats-Sri Lanka, Indo-Burma and Himalaya | The chapter’s phrase is “three of these hotspots cover our country” |
| Putting national parks and zoos in the same category | National parks, biosphere reserves, sanctuaries and sacred groves are in situ (on-site); zoos, botanical gardens, seed banks, tissue culture and cryopreservation are ex situ (off-site) | Ask: is the species protected in its own habitat, or moved out of it? |
To keep the four causes of loss in order, remember: Humans Often Alienate Creatures — H for habitat loss and fragmentation, O for over-exploitation, A for alien species invasions, C for co-extinctions.
One practical takeaway: for any example in this chapter, ask two questions — is it on-site or off-site, and which level of diversity does it illustrate?
Exam Notes: Where Each Exercise Answer Lives in the Chapter
The chapter ends with ten exercises. All of them are answered inside the chapter itself, and none is a calculation — which makes the species-area equation the only maths worth practising.
| Question | What it asks | Where the answer is |
|---|---|---|
| Q1 | Three components of biodiversity | Section 13.1 — the three levels of diversity (NCERT, p. 215-216) |
| Q2 | How ecologists estimate total species | Section 13.1.1 — the temperate-tropical statistical extrapolation (NCERT, p. 217) |
| Q3 | Three hypotheses for tropical richness | Section 13.1.2 — latitudinal gradients (NCERT, p. 218-219) |
| Q4 | Significance of the regression slope \(Z\) | Section 13.1.2 — species-area relationship (NCERT, p. 219-220) |
| Q5 | Major causes of species losses | Section 13.1.4 — the Evil Quartet (NCERT, p. 221-223) |
| Q6 | Biodiversity and ecosystem functioning | Section 13.1.3 — stability and Tilman’s experiments (NCERT, p. 220-221) |
| Q7 | Sacred groves and their role | Section 13.2.2 — in situ conservation (NCERT, p. 224) |
| Q8 | Flood and soil-erosion control by biotic components | Section 13.2.1 — the broadly utilitarian argument and ecosystem services (NCERT, p. 223-224) |
| Q9 | Why animals diversified more than plants | Sections 13.1.1 with 13.1.2 — species proportions and diversification (NCERT, p. 217-219) |
| Q10 | A deliberate extinction and its justification | Section 13.2.1 — the ethical argument (NCERT, p. 223) |
The question types are mixed. Q1-Q3, Q5 and Q7 are recall questions — answer with the chapter’s lists. Q4 tests interpretation of a value: name \(Z\) as the regression slope, give the 0.1-0.2 and 0.6-1.2 ranges, and say a steeper slope means species accumulate faster with area. Q6, Q8 and Q9 need reasoning that links the chapter’s evidence to the question.
Q10 is an opinion question — a strong answer states a position and defends it with the ethical argument (intrinsic value, duty to future generations), not with economics alone.
Textbook contents and the examinable syllabus are not always identical — check the current official CBSE syllabus for what is examinable this session.
Chapter 13 in Brief: Key Takeaways
This is the chapter’s own closing Summary, restated in plainer words — the safest list of what NCERT considers essential. If you have one minute before an exam, spend it here (NCERT, p. 225-226).

The graphic above is the Summary’s opening number in picture form: more than 1.5 million species recorded, and nearly 6 million more possibly waiting to be discovered (NCERT, p. 225).
- Biodiversity is the sum total of diversity at all levels of biological organisation, so conservation protects the genetic, species and ecosystem levels together.
- More than 70% of named species are animals, 70% of animals are insects, and fungi outnumber all vertebrates combined; India, with about 45,000 plant species and twice as many animal species, is one of the 12 megadiversity countries.
- Species diversity is highest in the tropics and decreases toward the poles, explained by evolutionary time, a constant environment and more solar energy; species richness also grows with area as a rectangular hyperbola.
- High-diversity communities tend to be less variable, more productive and more resistant to biological invasions.
- Current extinction rates are 100 to 1,000 times pre-human levels; nearly 700 species have gone extinct in recent times and more than 15,500 species — over 650 from India — face the threat of extinction. The causes: habitat loss and fragmentation, over-exploitation, alien invasions and co-extinctions.
- Reasons to conserve: narrowly utilitarian (direct benefits like food, fibre, firewood and pharmaceuticals), broadly utilitarian (ecosystem services like pollination, pest control, climate moderation and flood control) and ethical (a moral duty to other species and future generations).
- Conservation is in situ — 34 hotspots worldwide with three covering India, plus 14 biosphere reserves, 90 national parks, more than 450 wildlife sanctuaries and many sacred groves — and ex situ, through zoological parks, botanical gardens, in vitro fertilisation, tissue culture, cryopreservation of gametes and seed banks.
- Global pledges: the Rio Earth Summit (1992) Convention on Biological Diversity and the Johannesburg summit (2002) commitment to reduce biodiversity loss by 2010.
Related Resources for Class 12 Biology
This listing is maintained for the 2026-27 academic session using the NCERT textbook information available to us. NCERT remains the authority for confirming the latest edition.
If you are moving through the book in order, Chapter 12 comes just before this one — see the Class 12 Biology Chapter 12 Ecosystem notes on this site. For the whole subject, use the Class 12 Biology notes page; for everything in the class, start from the Class 12 hub or the main CBSE notes index.
The chapter file itself is hosted on the official Class 12 Biology textbook page at ncert.nic.in, which lists every chapter PDF of the book for download.
Reference: NCERT Class 12 Biology textbook, chapter 13, official edition on ncert.nic.in.
Sources and Data Verification
- The page numbers and figures on this page describe the NCERT Class 12 Biology textbook, Chapter 13, Biodiversity and Conservation, in the official PDF edition published at ncert.nic.in.
- This page covers Chapter 13 only — not the full set of Class 12 Biology chapters, which are listed on the NCERT textbook page linked above.
- The page is maintained for the current academic session, from the NCERT textbook information available to us.
- NCERT settles textbook content, editions and PDFs; CBSE settles curriculum, syllabus and examinations. Textbook contents and the examinable syllabus are not always identical — check the current official CBSE syllabus.
Biodiversity and Conservation Class 12 FAQs
What is the difference between in situ and ex situ conservation?
In situ conservation protects species in their natural habitat by protecting the whole ecosystem — India’s biosphere reserves, national parks, wildlife sanctuaries and sacred groves are examples. Ex situ conservation moves threatened species out of their habitat into zoos, botanical gardens, seed banks, tissue culture or cryopreservation, and is used when a species needs urgent protection (NCERT, p. 224-225).
Why do the tropics have more species than temperate regions?
The chapter gives three hypotheses: the tropics had a longer, undisturbed evolutionary time for diversification; their constant, predictable environment promotes niche specialisation; and they receive more solar energy, which raises productivity and indirectly supports more species (NCERT, p. 218-219).
What is the Evil Quartet?
The Evil Quartet is the book’s nickname for the four major human-driven causes of biodiversity loss: habitat loss and fragmentation, over-exploitation, alien species invasions, and co-extinctions (NCERT, p. 221-222).
How many biodiversity hotspots are there in India?
Thirty-four biodiversity hotspots exist worldwide; three cover India’s exceptionally rich regions — Western Ghats-Sri Lanka, Indo-Burma and Himalaya (NCERT, p. 224).
What does the species-area equation log S = log C + Z log A mean?
It describes how species richness (\(S\)) grows with area (\(A\)): \(C\) is the Y-intercept constant and \(Z\) is the slope of the line on a log-log plot. Within a region \(Z\) is 0.1 to 0.2; across very large areas it rises to 0.6 to 1.2 (NCERT, p. 220). A steeper \(Z\) means area matters more.
Explore Class 12 Biology Books
- Previous: Ecosystem
Class 12 Biology on LearnCBSE:
Related chapters: