Employment : Growth, Informalisation and Other Issues is Chapter 6 of the NCERT Class 11 Economics textbook Indian Economic Development, and its official PDF is right here.
The chapter starts at printed page 91 of the book and teaches who counts as a worker, how India’s workforce splits by region, status and sector, and why economists talk about jobless growth and informalisation. Keep the PDF open in one tab and this walkthrough in the other.
Employment : Growth, Informalisation and Other Class 11 PDF — official download
NCERT publishes this chapter free on its official website, and you can download the NCERT Class 11 Economics Employment : Growth, Informalisation and Other Issues chapter PDF directly from ncert.nic.in. The file is the complete official edition of Chapter 6 of Indian Economic Development — the same text, tables, charts and exercises that appear in the printed book.
Everything on this page is written to be read next to that file.
Chapter 6 at a glance: what is inside the PDF
The chapter unfolds in ten numbered parts, from 6.1 Introduction at printed page 92 to 6.10 Conclusion at page 109. Between them the book moves from who is a worker, through how participation is measured, to the status and sector of workers, informalisation, unemployment and government responses.
- Two boxed case studies — Box 6.1 Formal Sector Employment (p.103) and Box 6.2 Informalisation in Ahmedabad (p.104-105)
- Tables 6.1 to 6.3, which carry the 2026-27 workforce data plus the long 1972-2024 trend series
- Charts and photographs throughout the chapter — the figure walkthrough below reads each one
- A Recap list (p.109-110) that condenses the whole chapter, an Exercises block (p.110-112), Suggested Additional Activities (p.112-113) and References (p.113-114)
What this chapter covers, section by section
The chapter builds one idea on another, and each section adds a new lens on the same workforce data. Use this table to jump straight to the part you need.
| Section | What it teaches | NCERT page |
|---|---|---|
| 6.1 Introduction | Why people work, work at home, Jalandhar footballs, work-from-home during Covid-19 | p.92-93 |
| 6.2 Workers and Employment | Economic activity, gross national product, who is a worker, the 2026-27 workforce of about 545 million, women’s unpaid work | p.93-94 |
| 6.3 Participation of People in Employment | Worker-population ratio, the rural-urban gap, Table 6.1 | p.94-95 |
| 6.4 Self-employed and Hired Workers | The three worker statuses, Charts 6.1 and 6.2, why casual wage labourers are the most vulnerable | p.96-98 |
| 6.5 Employment in Firms, Factories and Offices | Eight industrial divisions clubbed into primary, secondary and service sectors, Table 6.2 | p.98-100 |
| 6.6 Growth and Changing Structure of Employment | GDP versus employment growth, jobless growth, Table 6.3, casualisation | p.100-102 |
| 6.7 Informalisation of Indian Workforce | Formal and informal sectors, the ten hired workers rule, Boxes 6.1 and 6.2, Chart 6.4 | p.102-105 |
| 6.8 Unemployment | The National Statistical Office definition, three data sources, open, disguised and seasonal unemployment | p.105-107 |
| 6.9 Government and Employment Generation | Direct and indirect generation, MGNREGA’s 100 days, employment generation programmes | p.107-108 |
| 6.10 Conclusion | Outsourcing, the home as workplace, the informal character of new jobs | p.108-109 |
Three ideas in the middle of the chapter cause most of the confusion, so they are worth separating clearly.
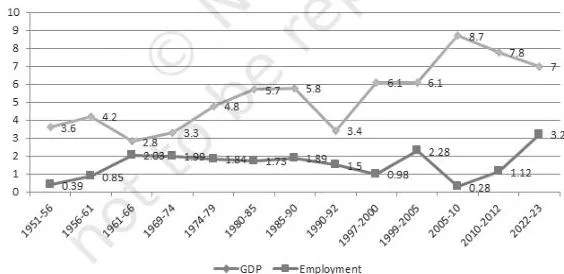
Jobless growth (p.100-101) is the name scholars give to a widening gap between GDP growth and employment growth: the economy produces more goods and services, but does not create proportionately more jobs. Between 1950 and 2010 employment grew at not more than 2 per cent, and the gap grew sharper from the late 1990s.
Casualisation of the workforce (p.101-102) is a change in the status mix — workers moving from self-employment and regular salaried jobs into casual wage work. The Ahmedabad box shows why this matters: casual workers lose job security, social security and the bargaining power that trade unions once gave them.
Formal versus informal (p.102-103) is the chapter’s clearest binary. Formal establishments are public units plus private establishments with ten or more hired workers; the informal sector is everything else — and, in 2026-27, that meant about 89 per cent of the workforce.
Key concepts: workers, workforce, and what the Indian data shows
This chapter keeps returning to four building blocks — the worker, the worker-population ratio, worker status and worker sector. Students mix them up because the same workforce gets measured four different ways. Learn each block separately and the data questions answer themselves.
Economic activity and who is a worker
An economic activity is any activity that contributes to the gross national product (GNP) of the country — farming, factory work, transport, shopkeeping, government service (NCERT, p. 93). A worker is anyone engaged in an economic activity, in any capacity, whether paid or not.
The definition deliberately includes the self-employed and unpaid family helpers, and it still counts people who are temporarily away from work because of illness, festivals or bad weather. Beggars, thieves and gamblers produce nothing that enters the national product, which is why the Exercises conclude they are not workers.
The worker-population ratio
Workers divided by population, multiplied by 100, gives the worker-population ratio (WPR) — the share of the population actively engaged in producing goods and services (NCERT, p. 94). It is a ratio, not a headcount, so it can be compared across regions and sexes. Table 6.1 gives the 2026-27 round (NCERT, p. 95):
- All India 43.7, Rural 45.6, Urban 38.9
- Men 56.4, Women 30.7 — and the urban gap is the sharpest: 56.4 for men against only 20.7 for urban women
The rural-urban difference exists because rural families have limited resources and cannot afford to stay out of work or keep studying, while urban families can wait for a job that suits their qualifications.
The three worker statuses
Status describes where a worker stands inside an enterprise — whether the worker owns it, gets hired by the day, or draws a regular salary. The chapter’s construction example uses three people: a cement shop owner, a construction worker and a civil engineer, one for each status (NCERT, p. 96-97). The 2026-27 shares come from Table 6.3 (NCERT, p. 101).
| Status | What it means | Example | 2026-27 share | Vulnerability |
|---|---|---|---|---|
| Self-employed | Owns and operates an enterprise to earn a livelihood | Cement shop owner, a farmer cultivating own land, a handloom weaver | 58.4% | Medium — income depends wholly on the business |
| Regular salaried employee | Hired by someone or an enterprise and paid wages on a regular basis | Civil engineer of a construction company, a bank cashier | 21.7% | Lowest — steady income and attachment to the job |
| Casual wage labourer | Casually engaged in others’ farms or enterprises, paid for work done | Construction worker, agricultural labourer | 19.9% | Highest — no steady work, no security |
The three sectors
The eight industrial divisions fold into three sectors (NCERT, p. 98-99): primary (agriculture, mining and quarrying), secondary (manufacturing, electricity-gas-water, construction) and service (trade, transport and storage, services). In 2026-27 the primary sector still employed 46.1 per cent of the workforce, the secondary 24.1 per cent and services 29.8 per cent (Table 6.2, p. 99).
The gender split is stark — 64.4 per cent of women workers are in the primary sector against 36.3 per cent of men — and so is the regional split: 59.8 per cent of rural workers are in the primary sector, while 60.9 per cent of urban workers are in services.
Formal and informal sectors
Formal sector establishments are all public sector establishments plus those private establishments which employ 10 hired workers or more; formal sector workers are the people who work in them (NCERT, p. 103). Everything else — millions of farmers, agricultural labourers, owners of small enterprises, the self-employed with no hired workers, construction and headload workers — is the informal sector.
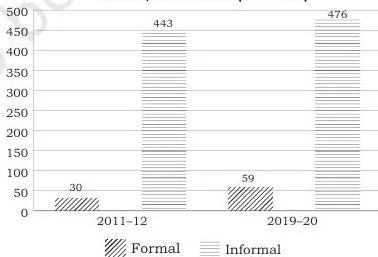
The rule counts hired workers only, so family helpers never count toward the ten. In 2026-27 India had about 535 million workers, of whom about 59 million were formal — roughly 11 per cent, leaving 89 per cent informal (Chart 6.4, p. 104).
Casualisation and the three types of unemployment
Casualisation is the shift from self-employment and regular salaried work towards casual wage work. Table 6.3 shows the casual share climbing from 23.2 per cent in 1972-73 to 31.8 per cent in 1993-94; in the latest rounds it has fallen back to 19.9 per cent while regular salaried employment rose moderately to 21.7 per cent — a trend the book asks the class itself to explain (NCERT, p. 101).
The chapter separates unemployment into three types (NCERT, p. 106-107): open unemployment is people visibly seeking work and not finding it; disguised unemployment is hidden surplus — extra workers whose removal would not reduce output, common on farms; seasonal unemployment is work being available only part of the year, which is why farm workers migrate to cities and return for the rainy season.
The NSO defines unemployment as a situation where people who lack work are nevertheless seeking it or willing to work under prevailing conditions; economists add a sharper test — an unemployed person cannot get even one hour of work in half a day.
How the government generates employment
Government efforts split into two buckets (NCERT, p. 107-108). Direct generation: the government itself hires people in departments, industries, hotels and transport companies. Indirect generation: when a government enterprise such as a steel company raises output, private firms that buy from it expand and hire more.
Employment generation programmes bundle wage work with services in primary health, primary education, rural drinking water, housing and road construction — the best known being the Mahatma Gandhi National Rural Employment Guarantee Act 2005, which promises 100 days of guaranteed wage employment a year to rural households willing to do unskilled manual work.
Figure walkthrough: what each NCERT figure and chart shows




The data in this chapter lives in its charts, and its argument lives in its photographs. Each figure below carries the book’s own caption; the notes say what to look for in it.
Figure 6.1 — work has moved home
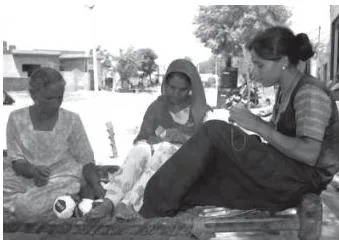
The chapter opens with footballs made in Jalandhar houses and sold by multinational companies (p.93). The photograph makes the point that factory work no longer always happens in factories: technology lets firms shift production into homes, and the Covid-19 work-from-home wave extended the same idea to services.
Brick-making and garment workers — two ends of hired work
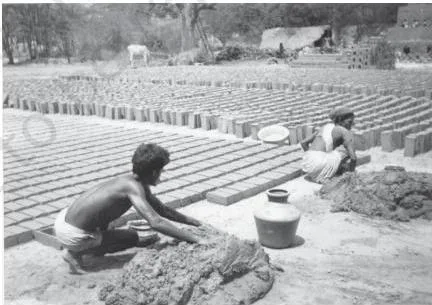
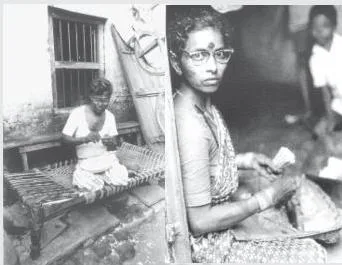
Brick-making (p.96) is the chapter’s picture of casual wage work: heavy manual labour paid by the day, with little attachment to any single employer. Read it against the definition — casually engaged, remunerated for work done, with no regular wage.
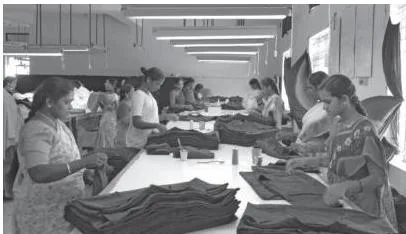
Garment workers at factory machines (p.99) sit at the other end of hired work and matter because of what Table 6.2 records: 64.4 per cent of women workers are still in the primary sector. Factory employment opening up for women is exactly the kind of shift the chapter wants you to notice in the sectoral data.
Charts 6.1 and 6.2 — who works, and where
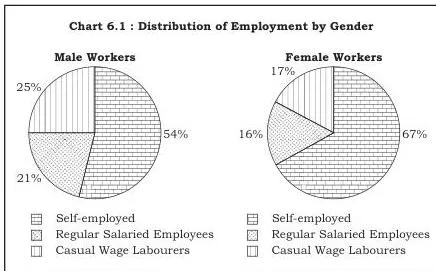
Chart 6.1 (p.97) breaks the workforce by gender and status. Self-employment is above 50 per cent for both sexes, casual wage work is women’s second-largest category, and regular salaried work takes a greater proportion of men — 21 per cent against 16 per cent for women.
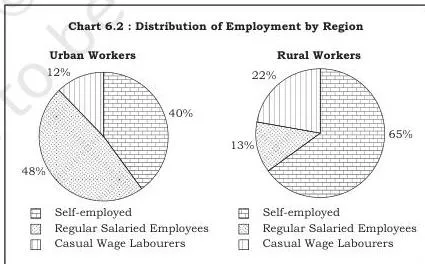
Chart 6.2 (p.97) does the same by region. The self-employed dominate rural areas because most rural workers cultivate their own plots, while urban areas hold more regular salaried jobs and more casual work. The book explains the urban mix simply: not everyone can run a factory, shop or office, and urban enterprises need workers on a regular basis.
Chart 6.3 — the jobless growth picture
This is the chapter’s most testable visual (p.101). The two lines track GDP growth and employment growth from 1951 to 2023: GDP grows faster throughout, employment growth between 1950 and 2010 never crosses roughly 2 per cent, and from the late 1990s the gap widens visibly. That widening gap is jobless growth — more output without proportionately more jobs.
The informal sector in picture and chart
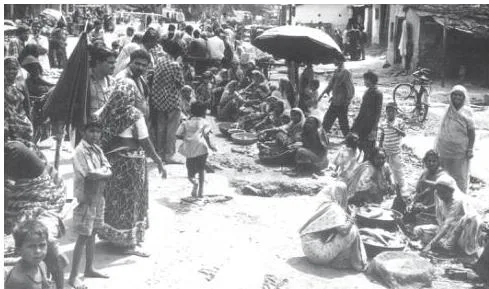
Roadside vending (p.104) is informal employment’s everyday face — a self-employed worker with no hired staff, no regular income and no employer offering social security. The photograph exists to make the 89 per cent informal figure feel concrete.
Chart 6.4 (p.104) puts numbers on the same idea. In 2026-27 about 59 million of roughly 535 million workers were in the formal sector — about 11 per cent — so the informal sector absorbs the other 89 per cent. The chapter adds that in 2026-27, women made up about 20 per cent of formal and 30 per cent of informal sector workers.
Unemployment and government employment
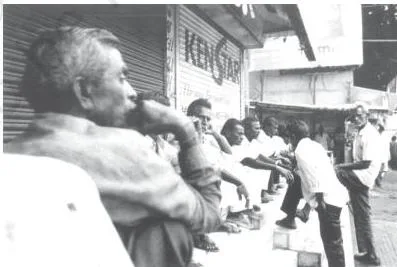
Unemployed mill workers waiting at a roadside for casual jobs (p.106) is the chapter’s image of open unemployment — people visibly seeking work. The idea pairs with Box 6.2, where the closure of Ahmedabad’s textile mills over about ten years pushed over 80,000 permanent and over 50,000 non-permanent workers into the informal sector (p.104-105).
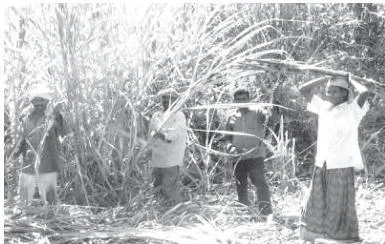
Sugarcane cutters in the field (p.107) illustrate disguised unemployment: extra hands whose removal would not reduce output. If a farmer needs two workers plus himself on four acres but employs five plus family members, the surplus is disguised.
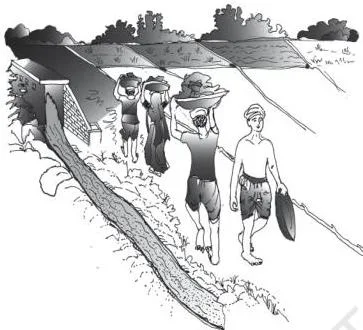
Dam construction (p.108) shows direct employment generation — the government itself hiring for public works. This is the direct half of the direct-indirect pair; the indirect half appears when a government steel company’s expansion pulls private buyers along with it.
Definitions: the terms you must be able to reproduce
The Exercises open with pure definition questions, so precise wording matters here. Learn each term the way the book defines it, not the way it is loosely used in conversation.
| Term | Plain definition | NCERT page |
|---|---|---|
| Economic activity | Any activity that contributes to the gross national product | p.93 |
| Worker | A person engaged in an economic activity, whether paid or not, including the self-employed and unpaid helpers; temporary absence from illness or festivals does not disqualify | p.93 |
| Worker-population ratio | The percentage of the population that is employed: (workers ÷ population) × 100 | p.94 |
| Self-employed | A worker who owns and operates an enterprise to earn a livelihood | p.96 |
| Casual wage labourer | A worker casually engaged in others’ farms or enterprises, paid remuneration for the work done | p.96-97 |
| Regular salaried employee | A worker hired by someone or an enterprise and paid wages on a regular basis | p.97 |
| Primary, secondary, service sectors | Primary = agriculture + mining; secondary = manufacturing + electricity, gas and water + construction; service = trade + transport and storage + services | p.98-99 |
| Formal sector establishment | A public sector establishment, or a private establishment employing 10 hired workers or more | p.103 |
| Formal sector worker | A person working in a formal sector establishment, with access to social security measures | p.103 |
| Informal sector | All other enterprises and workers — farmers, agricultural labourers, small enterprise owners and their workers, self-employed people with no hired workers, non-farm casual workers | p.103 |
| Casualisation of workforce | The shift of workers from self-employment and regular salaried work into casual wage work | p.101-102 |
| Jobless growth | Growth of GDP without a matching growth of employment | p.100-101 |
| Open unemployment | People seeking work and not finding it — the visible form of unemployment | p.106 |
| Disguised unemployment | Surplus workers whose removal would not reduce output; common on Indian farms | p.106-107 |
| Seasonal unemployment | Unemployment caused by work being available only part of the year | p.107 |
| Employment generation programmes | Government schemes that provide both employment and services such as health, education, drinking water and housing | p.108 |
Two memory devices fix the numbers that appear most often in questions:
- Ten hired workers or more, and a private establishment crosses into the formal sector. Remember it as the ten-toes rule: ten or more hired workers on the premises means formal. The count is of hired workers only — family helpers and the owner never add to it (p.103).
- Unemployment types — ODS. Open is seen (people on the street looking for daily work, p.106); Disguised is hidden (extra hands on a farm, p.106-107); Seasonal comes and goes with the calendar (farm slack seasons that push migration, p.107).
Common mistakes in this chapter (and the corrections)
Every trap in this chapter comes from reading one of its definitions too narrowly. Here are the seven errors students actually make — the first list the book’s own exercises set traps for.
| Mistake | Correct rule | How to check |
|---|---|---|
| A worker must be paid by an employer | Self-employed people and unpaid family helpers are also workers | Ask: does the activity contribute to GNP? Payment is not required (p.93) |
| Housework is not work | Women’s unpaid household and farm work is left out of workforce counts, but economists argue it contributes and should be counted | Re-read the Work This Out debate on housewives (p.93-94) |
| Formal sector means government jobs | Private establishments with 10 or more hired workers are formal too | Apply the 10-hired-workers test, not the owner test (p.103) |
| The 10-worker rule counts everyone in the building | It counts hired workers only; a hotel with 7 hired plus 3 family workers is informal, and a shop with 9 hired workers is informal | Count only paid, hired staff — never family members or the owner (p.103, 105) |
| Casualisation means rising unemployment | It is a shift in the status mix towards casual wage work while total employment can keep growing | Check Table 6.3’s status rows, not the total (p.101-102) |
| Disguised and seasonal unemployment are the same | Disguised = surplus people whose removal does not cut output; seasonal = work is available only part of the year | Ask whether the problem is headcount or calendar (p.106-107) |
| Jobless growth means GDP fell | GDP grows, but employment does not keep pace — output rises without matching jobs | Look at Chart 6.3’s two lines moving apart (p.100-101) |
Exam notes: how this chapter’s questions actually test you
This chapter rewards exact definitions and the ability to read a table, not memorised essays. Its exercises (p.110-112) test four skills, and each skill has its own question type.
- Defining — Q1 (who is a worker), Q2 (define worker-population ratio), Q21 (who is a casual wage labourer). A full-marks answer states the scope: paid or unpaid, self-employed included.
- Classifying — Q4 and Q10 (odd-man-out on status), Q5 (sector fill-in), Q6 and Q22 (formal versus informal). The pattern to practise is the Work These Out list on p.105: a hotel with seven hired and three family workers is informal; a civil engineer in a construction company with ten workers is formal.
- Calculating — Q12 asks you to estimate the workforce from population and WPR. The method is always the same, and the worked example below runs it with fresh numbers.
- Analysing tables — Q8 (rural vs urban women), Q11 (the 1972-73 workforce table), Q13-Q14 (regular salaried concentration), Q15-Q16 (sectoral trends), Q17 (GDP-employment link), Q19 (Victor’s two-hour work day).
Worked example — estimating workforce from population and WPR. For any region, workforce equals population multiplied by the worker-population ratio, divided by 100.
Step 1: Take a state with a rural population of 3.6 crore and WPR 45, plus an urban population of 2.4 crore and WPR 35.
\[ \text{Rural workforce} = 3.6 \times \frac{45}{100} = 1.62 \text{ crore} \]
\[ \text{Urban workforce} = 2.4 \times \frac{35}{100} = 0.84 \text{ crore} \]
Step 2: Add the regional workforces.
\[ \text{Total workforce} = 1.62 + 0.84 = 2.46 \text{ crore} \]
Final answer: the state’s workforce is 2.46 crore, or 2,46,00,000 workers.
Use this mapping to practise exactly the questions that test a concept you are weak on:
| Concept tested | Exercise questions |
|---|---|
| Who is a worker | 1, 3, 7, 9, 19 |
| Worker-population ratio | 2, 8, 12 |
| Worker status (self-employed / regular / casual) | 4, 10, 13, 14, 21 |
| Formal versus informal sector | 6, 18, 22 |
| Sectoral distribution of workforce | 5, 11, 15, 16 |
| Growth, jobless growth, casualisation | 15, 16, 17 |
| Government employment generation | 18, 20 |
The chapter also names the three official data sources on unemployment (p.106-107): the Census of India; the National Statistical Office’s reports, including the Annual Reports of the Periodic Labour Force Survey; and the Directorate General of Employment and Training’s employment exchange registration data. A question on “how do we know” should be able to list these.
Textbook contents and the examinable syllabus are not always identical — check the current official CBSE syllabus for what is examinable this year.
Field activities this chapter suggests
The book’s closing activities (p.112-113) turn its definitions into fieldwork you can actually do:
- Divide a street or colony into 3-4 sub-regions, survey what each resident does, and derive the worker-population ratio for every sub-region to explain why they differ.
- In groups, take different regions — paddy, coconut, coastal fishing, riverside livestock — and report what employment each could generate.
- Analyse 25 job advertisements from seven issues of Employment News, classifying each post by company type, sector and qualification.
- Prepare a critical assessment of one local government work — a road, tank desilting, a school building or a check dam — covering how it was identified, the amount sanctioned, wages paid and whether it was genuinely needed.
- Document employment initiatives taken by voluntary organisations in hilly and dry-land regions near you.
Each activity makes a definition you would otherwise memorise — the WPR formula, the formal-informal rule, sectoral classification — something you have observed yourself, which is exactly the kind of example a long-answer question rewards.
Revision summary: the chapter in one screen
The chapter’s own Recap (p.109-110), re-expressed in brief:
- Workers are all those engaged in economic activities that contribute to gross national product.
- About two-fifths of India’s population is in the workforce.
- Men — especially rural men — form the major section of the workforce.
- Most workers are self-employed; casual wage labourers and regular salaried employees together account for less than half of the workforce.
- Agriculture and allied activities remain the largest single source of livelihood — the Recap puts the share at about three-fifths of the workforce, while Table 6.2’s 2026-27 figure for the primary sector is 46.1 per cent.
- Employment growth has decelerated in recent years.
- Post-reform new jobs are found mostly in the service sector, and they are mostly informal and often casual.
- The government is the largest formal-sector employer.
- Disguised unemployment is a common form of unemployment in rural India.
- The structure of the workforce has changed over the decades.
- Through schemes and policies, the government generates employment directly and indirectly.
Self-test in three lines: define a worker; compute a WPR from a population of 5,00,000 and 2,00,000 workers \( \left( \frac{200000}{500000} \times 100 = 40 \right) \); and state when a private establishment becomes formal. If you can do all three without looking, the chapter is done.
Related resources
Continue revising with the rest of the book. The Class 11 Economics notes hub collects chapters from both Class 11 economics books, and the Class 11 NCERT books hub holds every subject. The chapter that follows this one is Environment and Sustainable Development, which carries the growth story into natural resources.
For the statistical tools behind tables such as 6.1 to 6.3, see the measures of central tendency notes. Everything else on the site starts from the CBSE notes home page.
You can also open the official NCERT Class 11 Economics Employment : Growth, Informalisation and Other Issues chapter PDF on ncert.nic.in, the authoritative source for the file.
| What the chapter holds | Count | Where it is used |
|---|---|---|
| Printed pages | 23 | |
| Sections in the chapter | 9 | |
| Figures with NCERT captions | 16 | |
| Tables | 6 | |
| Exercise questions | 22 | answered in our NCERT Solutions |
| Official NCERT PDF | Download the chapter PDF | the chapter exactly as NCERT publishes it |
Reference: NCERT Class 11 Economics textbook, chapter 6, official edition on ncert.nic.in.
Sources and data verification
This page describes the NCERT Indian Economic Development textbook for Class 11, Chapter 6 (Employment : Growth, Informalisation and Other Issues), in the current NCERT edition published at ncert.nic.in, where the chapter runs from printed page 91. The data cited — Table 6.1, Table 6.2, Table 6.3 and the charts — is the book’s own 2026-27 and trend data.
- This page covers that NCERT chapter and its exercise set, not the full CBSE scheme of studies.
- The listing is maintained for the current academic session using NCERT’s official publication.
- NCERT settles textbooks, editions and PDFs; CBSE settles curriculum, syllabus and examinations.
- Textbook contents and the examinable syllabus are not always identical — check the current official syllabus.
Frequently asked questions
Who is a worker? Why are a beggar, a thief and a gambler not counted as workers?
A worker is anyone engaged in an economic activity — something that contributes to the gross national product — whether paid or not. Beggars, thieves, smugglers and gamblers do not produce goods or services that enter the national product, so they are not workers (NCERT, p. 93).
The same rule is why a student who helps on the family farm is a worker while a person earning by gambling is not.
How is the worker-population ratio calculated, and what does the latest table show?
Divide the number of workers by the population and multiply by 100: WPR = (number of workers ÷ population) × 100 (NCERT, p. 94). Table 6.1 for 2026-27 gives an all-India ratio of 43.7 — 45.6 in rural areas and 38.9 in urban areas, with men at 56.4 and women at 30.7 (NCERT, p. 95).
What is the difference between disguised unemployment and seasonal unemployment?
Disguised unemployment means surplus workers whose removal would not reduce output — the book’s farmer needs two workers and himself on four acres, yet employs five plus family members (NCERT, p. 106-107). Seasonal unemployment means work exists only part of the year, which is why farm workers migrate to cities and return for the rainy season (NCERT, p. 107).
When is a worker in the formal sector? Why does the ten hired workers rule matter?
A worker is in the formal sector when the establishment is a public sector unit, or a private establishment employing 10 or more hired workers (NCERT, p. 103).
The rule matters because it counts hired workers only: family helpers do not count, so a hotel with seven hired and three family workers is informal, and so is a shop with nine hired workers (NCERT, p. 103, 105).
Why are more rural women than urban women counted as workers?
Table 6.1 puts the rural women’s ratio at 34.8 against 20.7 for urban women (NCERT, p. 95). Rural families often cannot afford to keep anyone out of work, and many rural women work unpaid on family farms; urban families with higher male earnings more often discourage women from taking jobs, and household work is not counted as employment (NCERT, p. 94-95).
What is jobless growth, and why did it happen in India?
Jobless growth is the growth of GDP without a matching growth of employment — the economy produces more goods and services without generating proportionately more jobs (NCERT, p. 100-101). Between 1950 and 2010 employment grew at not more than 2 per cent while GDP grew faster, and the gap widened from the late 1990s, as Chart 6.3 shows.
Reference: NCERT Class 11 Economics textbook, chapter 6, official edition on ncert.nic.in.
Explore Class 11 Economics Books
- Previous: Measures of Central Tendency
- Next: Environment and Sustainable Development
Related chapters:
- Development Policies and Experience (1947-90)
- Why Economics?
- Indian Economy