This page hosts the official Development Experiences of India: a Comparison Class 11 PDF — NCERT Class 11 Economics Chapter 8, from the Indian Economic Development textbook. The official file is right here, and the chapter’s sections, data tables and figures are all explained below so you can find what you need fast.
Development Experiences of India: a Comparison Class 11 — Official PDF
This is Chapter 8 of the NCERT Class 11 Economics book Indian Economic Development — the book on India’s economy, not the other Class 11 Economics NCERT book, Statistics for Economics. The chapter compares India’s development experience with China and Pakistan across population, output, poverty and human development, and closes with an exercise set and a summary recap.
The official file is identical to the printed chapter and uses the same page numbers, so the citations below match what you read in the book. Open the NCERT Class 11 Economics Chapter 8 Development Experiences of India: a Comparison with Neighbours PDF for the full text, tables and exercises, or continue below for a section-by-section preview with the key numbers explained.
| What the chapter holds | Count | Where it is used |
|---|---|---|
| Printed pages | 19 | |
| Sections in the chapter | 7 | |
| Figures with NCERT captions | 4 | |
| Tables | 6 | |
| Exercise questions | 17 | answered in our NCERT Solutions |
| Official NCERT PDF | Download the chapter PDF | the chapter exactly as NCERT publishes it |
Reference: NCERT Class 11 Economics textbook (Indian Economic Development), chapter 8, official edition on ncert.nic.in.
Chapter 8 at a Glance: What the PDF Contains
Chapter 8 is a comparative chapter with no formulas. Its substance is five numbered data tables — Table 8.1 demographic indicators, Table 8.2 GDP growth, Table 8.3 sectoral shares, Table 8.4 sector growth trends and Table 8.5 human development — plus three captioned photographs, one chart and a closing exercise set.
The chapter’s argument moves table by table, so learning to read the tables is learning the chapter. The table below carries the chapter’s exact totals; the sections that follow explain what the data mean.
What This Chapter Covers, Section by Section
Use this map to jump straight to the part you need. The teaching behind each row follows in the Key Concepts section.
| Section | Book page | What it does |
|---|---|---|
| 8.1 Introduction | p.134 | Why developing countries study neighbours under globalisation; groupings such as SAARC, EU, ASEAN, G-8, G-20, BRICS. |
| 8.2 Developmental Path — A Snapshot View | p.135 | Five Year Plans and the early strategies of all three countries. |
| 8.3 Demographic Indicators | p.137 | Table 8.1: population, density, sex ratio, fertility, urbanisation. |
| 8.4 Gross Domestic Product and Sectors | p.139 | Tables 8.2-8.4: GDP, GVA, sectoral shares and sector growth trends, plus two Work These Out boxes. |
| 8.5 Indicators of Human Development | p.141 | Table 8.5 and the argument that the HDI needs liberty indicators. |
| 8.6 Development Strategies — An Appraisal | p.143 | The verdict on why China’s reforms worked and Pakistan’s slowed. |
| 8.7 Conclusion | p.146 | What seven decades of divergence teach. |
| Recap to reading list | pp.146-150 | Recap points, exercises, suggested activities and the book list. |
Key Concepts: The Three Development Paths
This chapter follows three countries from similar starting points to very different results. Everything rests on reading the five data tables correctly; there are no formulas to memorise.
Why the Chapter Compares India with Two Neighbours
The chapter opens with the question its title answers: why study neighbours at all. Under globalisation, the answer is that neighbours share a limited economic space.
Nations now form regional and global groupings — SAARC, the European Union, ASEAN, G-8, G-20 and BRICS — as means of strengthening their own domestic economies (NCERT, p.134). Developing countries face competition not only from developed nations but also among themselves in that limited space, and their shared economic activities affect human development in a common environment.
Comparing with neighbours is therefore a way to see one’s own strengths and weaknesses.
The political contrast matters as much as the economic one. India — the world’s largest democracy — has followed a secular, liberal Constitution for more than fifty years; Pakistan’s political structure is militarist; China’s command economy has only recently begun moving towards a democratic system and more liberal economic restructuring (p.134).
Three Countries, Similar Starting Points
The three countries began their development journeys at almost the same moment, with almost the same instrument: the Five Year Plan.
- Independence: India and Pakistan in 1947; the People’s Republic of China in 1949 (p.135).
- First Five Year Plans: India 1951-56, China 1953, Pakistan 1956 — Pakistan’s plan is now called the Medium Term Development Plan (p.135).
- Pakistan works on its 12th Five Year Plan (2018-23); China on its 14th (2021-25); India followed the plan model until March 2017 (p.135).
- India and Pakistan adopted similar strategies: a large public sector and high public expenditure on social development (p.135).
- Till the 1980s all three countries had similar growth rates and per capita incomes (p.135).
Then the divergence begins, and three reform dates are the dividing line: China 1978, Pakistan 1988, India 1991. The chapter’s own Recap and its Question 17 both hinge on these three years (pp.135, 147).
China: From Communes to the 1978 Reforms
China’s story has two halves: Maoist revolution, then market reform. The chapter traces both in sequence because the reform only worked because of what came before.
- Great Leap Forward (1958): an attempt to industrialise on a massive scale; people were encouraged to set up backyard industries, and rural communes cultivated land collectively — 26,000 communes by 1958, covering almost all the farm population (p.135).
- Setbacks: a severe drought killed about 30 million people, and the Soviet Union withdrew its professionals after conflicts with China (p.135).
- Great Proletarian Cultural Revolution (1966-76): introduced in 1965, it sent students and professionals to work and learn in the countryside (p.135).
- 1978 reforms, phase one (agriculture, foreign trade, investment): commune land was divided into small plots allocated to households for use, not ownership; households kept all income after stipulated taxes (pp.135-136).
- 1978 reforms, phase two (industry): private firms and township and village enterprises — owned and operated by local collectives — were allowed to produce; State Owned Enterprises (government-owned, India’s public sector equivalent) were made to face competition (p.136).
- Dual pricing: fixed quantities of inputs and output traded at government-fixed prices, the rest at market prices; as production grew, the market share grew too (p.136).
- Special economic zones were set up to attract foreign investors (p.136).
Pakistan: Import Substitution, Green Revolution and Remittances
Pakistan also follows a mixed economy with public and private sectors co-existing. Its policy path zigzags more sharply than India’s.
- Late 1950s-60s: import substitution industrialisation — tariff protection for consumer goods manufacturing plus direct import controls on competing imports (p.136).
- Green Revolution: mechanisation and public investment in infrastructure in selected areas raised foodgrain production and changed the agrarian structure dramatically (p.136).
- 1970s: nationalisation of capital goods industries (p.136).
- Late 1970s-80s: denationalisation and encouragement of the private sector, financial support from western nations, and remittances from a growing outflow of emigrants to the Middle East (pp.136-137).
- 1988: reforms initiated in the country (p.137).
Demographics: Reading Table 8.1
Consider the scale first: for every six people in the world, roughly one is Indian and one is Chinese, while Pakistan’s population is only about one-tenth of either (p.137).
- Population (million): India 1428, China 1411, Pakistan 240.
- Annual growth: India 0.81 per cent, China -0.10 per cent, Pakistan 1.96 per cent — highest in Pakistan, followed by India and China.
- Density (per sq km): India 473, China 150, Pakistan 300. China is geographically the largest of the three yet has the lowest density (p.137).
- Sex ratio (females per 1000 males): India 930, China 898, Pakistan 948 — low and biased against females in all three; scholars cite son preference in all three countries (p.138).
- Fertility rate: India 2.0, China 1.2, Pakistan 3.4 — low in China, very high in Pakistan (p.138).
- Urbanisation: India 36 per cent, China 65 per cent, Pakistan 38 per cent.
The one child norm, introduced in China in the late 1970s, is the main reason for China’s low population growth — but it also lowered China’s sex ratio (p.138). It now implies more elderly people relative to young, which is why China allows couples to have two children (p.138).
GDP, GVA and the Sector Shift
This is the chapter’s heart: how big each economy is, and which sectors produce that output. All the sector tables below tell one structural story.
- GDP (PPP): China $35 trillion — the second largest in the world; India $15 trillion; Pakistan $1.5 trillion, roughly 10 per cent of India’s. India’s GDP is about 42 per cent of China’s (p.139).
- GVA: GDP measured sector by sector is now called Gross Value Added (p.139).
- Growth history (Table 8.2): 1980s — China 10.3 per cent, Pakistan 6.3 per cent, India 5.7 per cent, with India at the bottom; 2015-17 — India 7.3, China 6.8, Pakistan 5.3; 2024 — India 6.5, China 5.0, Pakistan 3.1 (p.139).
- Sectoral shares (Table 8.3, 2022): agriculture contributes 18 per cent of India’s GVA but employs 43 per cent of its workforce; China 8 per cent and 23 per cent; Pakistan 24 per cent and 36 per cent. Industry: India 28 per cent of GVA and 26 per cent of workforce; China 38 and 32; Pakistan 21 and 26. Services: 54 per cent of GVA in India and China, 55 per cent in Pakistan (p.140).
- The key difference is industry, not services: all three earn roughly the same share from services, so the gap between China and the others is the size of its industrial sector (p.140).
- Two paths: the normal development sequence runs agriculture to industry to services, which is what China is doing. India and Pakistan shifted directly from agriculture to services. Workforce in services: 1980s — India 17 per cent, China 12 per cent, Pakistan 27 per cent; 2022 — India 31, China 45, Pakistan 38 (p.140).
- Why China left the land: only about 10 per cent of China’s land is cultivable — about 40 per cent of India’s cultivable area. Until the 1980s more than 80 per cent of Chinese depended on farming; the government then encouraged movement into handicrafts, commerce and transport (p.139).
- Sector growth trends (Table 8.4), 1980-90 to 2014-18: agriculture — India 3.1 to 3.1, China 5.9 to 3.1, Pakistan 4.0 to 1.7; industry — India 7.4 to 6.9, China 10.8 to 5.3, Pakistan 7.7 to 4.8; services — India 6.9 to 7.6, China 13.5 to 7.1, Pakistan 6.8 to 5.0 (p.141).
- The verdict: China’s growth is contributed by manufacturing and services, India’s by services, and Pakistan has decelerated in all three sectors (p.141).
Human Development: Table 8.5 and the Liberty Indicators
Where the GDP tables end, the human development table takes over: who lives longer, learns more and stays healthier in each country.
- HDI: India 0.685 (rank 130), China 0.797 (rank 78), Pakistan 0.544 (rank 168) (p.142).
- Life expectancy at birth: India 72.0 years, China 78.0, Pakistan 67.6.
- Mean years of schooling: India 6.9, China 8.0, Pakistan 4.3.
- GNI per capita (PPP US$): India 9,047, China 22,029, Pakistan 5,501.
- Below poverty line: India 21.9 per cent (2019-21), China 0.0 per cent (2023), Pakistan 21.9 per cent (2023).
- Infant mortality (per 1000 live births): India 25.5, China 4.8, Pakistan 51.
- Maternal mortality (per 1 lakh births): India 103, China 23, Pakistan 154 — the chapter’s sharpest finding is that India and Pakistan have failed to save women from maternal mortality (p.142).
- Sanitation, water, nutrition: basic sanitation 78/96/71 per cent; basic drinking water 93/98/91; undernourishment 17/3/19 per cent. China leads on almost everything, and China and Pakistan are ahead of India on poverty reduction and sanitation (p.142).
The chapter then adds a caution: these indicators are extremely important but not sufficient (p.142). It argues the HDI needs liberty indicators — measures of political and legal freedom that the index lacks.
One such indicator exists: a measure of the extent of democratic participation in social and political decision-making, but it has not been given any extra weight. Measures of the constitutional protection of citizens’ rights, and of the independence of the judiciary and the rule of law, have not even been introduced (pp.142-143).
Without them, given overriding importance, the HDI is incomplete and its usefulness limited.
The Appraisal: Why China Grew and Pakistan Slowed
Section 8.6 delivers the verdict on three countries that started alike and ended very different. The causes, the chapter argues, lie before 1978 as much as after.
- China chose reform. The 1978 reforms were China’s own initiative — there was no World Bank or IMF compulsion as there was for India and Pakistan. The new leadership judged Maoist development — decentralisation, self-sufficiency and shunning foreign technology, goods and capital — a failure: per capita grain output in 1978 was the same as in the mid-1950s (p.143).
- Foundations predated the reforms: rural education and health infrastructure, land reforms, long-existing decentralised planning, small enterprises and commune-based equitable distribution of food grains. Each reform was first tried at a small level, then extended on a massive scale (p.144).
- Pakistan’s fragile base: agricultural growth and the food supply rested on good harvests, not an institutionalised process of technical change, so economic indicators swung with the monsoon. Foreign exchange came from Middle East remittances and exports of volatile agricultural products; dependence on foreign loans grew while the difficulty of repaying them also grew (p.144).
- Poverty returned: Pakistan’s international poverty-line data look healthy, but national data show poverty rising again — more than 40 per cent in the 1960s, down to 25 per cent in the 1980s, and rising since (p.144).
- Recovery: 2026-27 GDP growth reached 5.5 per cent, the highest in the previous decade, with industry at 4.9 per cent and services at 6.2 per cent (p.145).
- India’s compulsion: India had to borrow from the IMF and the World Bank to set right its balance of payments crisis — the context that forced the 1991 reforms (p.144).
Worked Example: Checking the Chapter’s Comparisons
The textbook works no solved examples in this chapter, so here is a fresh arithmetic check of four headline claims using the chapter’s own numbers. The habit to take away: always check the year and the column before comparing two figures.
Step 1 — the chapter’s ‘one in six’ claim.
Add the populations of India and China: \( 1428 + 1411 = 2839 \) million, about 2.84 billion.
Using a commonly cited approximate world population of 8.1 billion: \( 2839 \div 8100 \approx 0.35 \), which is about 2 of every 6 people.
The chapter’s claim checks out (p.137).
Step 2 — Pakistan’s GDP is roughly 10 per cent of India’s.
\( 1.5 \div 15 = 0.10 \), exactly 10 per cent.
Verified (p.139).
Step 3 — India’s GDP is about 42 per cent of China’s.
\( 15 \div 35 \approx 0.43 \), which is about 42-43 per cent once the rounded GDP figures are used.
The chapter’s ‘about 42 per cent’ is a fair approximation, not an exact ratio (p.139).
Step 4 — read a sector cell correctly.
Agriculture contributes 18 per cent of India’s GVA but employs 43 per cent of its workforce.
That gap means each agricultural worker produces far less than the average worker elsewhere, which is why a majority-agriculture workforce keeps per-worker incomes low.
China’s 8 per cent and 23 per cent split reflects fewer people left on the land (Table 8.3, p.140).
Conclusion: every headline comparison in the chapter survives arithmetic checking. Use the same habit with every table: note the year, check the country column, then compare.
What the Chapter’s Figures Show
The chapter’s visual material is thin but pointed: three photographs and one chart, each tied to a step in the argument. The gallery below shows them; the notes after it explain what each one contributes.
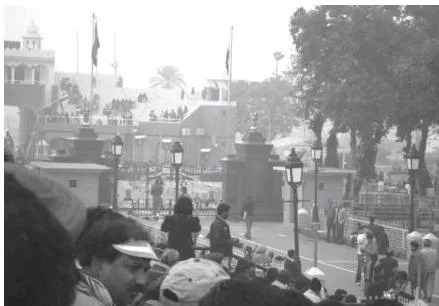
Fig 8.1 — Wagah Border (p.137)
The photograph’s point is that neighbours do trade, even across a guarded border. The Work These Out box carries the numbers (p.145).
Exports from India to Pakistan grew from Rs 2,341 crore in 2004-05 to Rs 4,720 crore in 2026-27, a compound growth of 3.6 per cent, while imports from Pakistan shrank from Rs 427 crore to Rs 4 crore, a compound fall of 20.8 per cent.
Trade with China grew far faster: exports from Rs 25,232 crore to Rs 1,20,617 crore (8.1 per cent) and imports from Rs 31,892 crore to Rs 9,59,666 crore (18.5 per cent) (p.145).
Fig 8.2 — Land Use and Agriculture (p.139)
China is geographically the largest of the three, yet only about 10 per cent of its total land is cultivable — about 40 per cent of India’s cultivable area.
That constraint is why China pushed its workforce off the fields: until the 1980s more than 80 per cent of its people depended on farming, and the government then encouraged movement into handicrafts, commerce and transport (p.139).
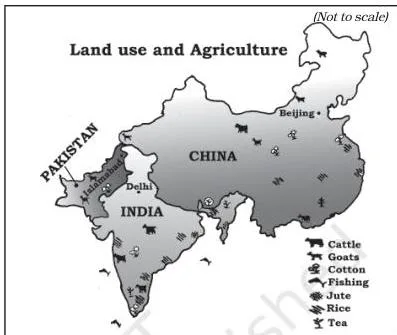
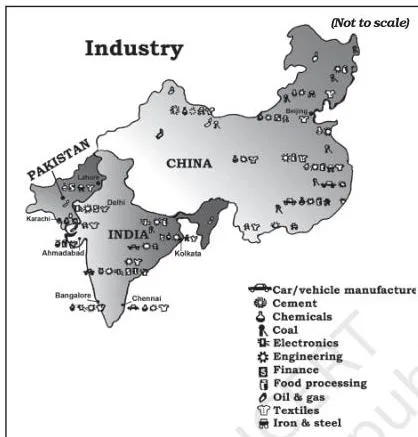
Fig 8.3 — Industry (p.140)
The photograph illustrates the manufacturing-led contrast at the heart of the chapter. Industry contributes 38 per cent of China’s GVA but 28 per cent of India’s and 21 per cent of Pakistan’s; the workforce shares are 32, 26 and 26 per cent (Table 8.3, p.140).
The sector-growth chart (p.141)
This chart carries no printed caption; the text supplies its point: over the last five decades, growth in the agriculture sector — which employs the largest proportion of the workforce in all three countries — has declined (p.141). That is the chapter’s central structural worry: the sector employing the most people grows the slowest.
Table 8.4 shows the slide: agriculture growth across the three countries was 3.1 to 5.9 per cent in 1980-90, but only 1.7 to 3.1 per cent in 2014-18 (p.141).
Key Terms in the Chapter, in Plain Words
This chapter introduces terms quickly, often without printing a formal definition. The table below defines each term as the chapter uses it, with the page where it appears.
| Term | What it means in this chapter | Page |
|---|---|---|
| Great Leap Forward | 1958 campaign to industrialise China on a massive scale, including backyard industries. | p.135 |
| Commune system | Rural collective cultivation units; about 26,000 by 1958, covering almost all the farm population. | p.135 |
| Great Proletarian Cultural Revolution | 1966-76 campaign that sent students and professionals to the countryside. | p.136 |
| Township and village enterprises | Industries owned and operated by local collectives. | p.136 |
| State Owned Enterprises (SOEs) | Government-owned enterprises; India’s equivalent is public sector enterprises. | p.136 |
| Dual pricing | Fixed quantities traded at government-fixed prices; the rest at market prices. | p.136 |
| Special economic zones | Zones set up to attract foreign investors. | p.136 |
| Import substitution | Protecting domestic industry with tariffs and import controls. | p.136 |
| Green Revolution | Mechanisation and improved inputs that raised foodgrain production. | p.136 |
| Denationalisation | Selling nationalised industries back to the private sector. | p.137 |
| One child norm | China’s late-1970s population control measure. | p.138 |
| Sex ratio | Females per 1000 males. | p.138 |
| Fertility rate | Children per woman. | p.138 |
| Gross Value Added (GVA) | The current name for GDP measured sector by sector. | p.139 |
| Liberty indicators | Measures of democratic participation and protection of rights and the rule of law that the HDI lacks. | pp.142-143 |
Mistakes Students Make in This Chapter
This chapter has no formulas to slip on; its traps are misremembered dates and misread tables.
| Mistake | Why it happens | Correction (with page) |
|---|---|---|
| Swapping the reform years | All three dates (1978, 1988, 1991) look alike. | China 1978, Pakistan 1988, India 1991 (Recap, p.147). |
| Crediting China’s human development gains to the 1978 reforms | The reforms are the obvious cause. | The chapter attributes the gains to pre-reform strategies (p.147). |
| Thinking China farms a huge area | China is geographically the largest of the three. | Only about 10 per cent of China’s land is cultivable — about 40 per cent of India’s (p.139). |
| Calling India manufacturing-led | Industry growth rates look high. | India’s growth is service-led; China’s is manufacturing-led (p.141). |
| Assuming services explain the difference between countries | Services have the biggest share of GVA. | All three get 54-55 per cent of GVA from services; the gap is industry (p.140). |
| Misreading HDI ranks | A higher rank number feels better. | Higher rank is worse: India 130, China 78, Pakistan 168 (p.142). |
| Reading Pakistan’s poverty as low | International poverty-line data look healthy. | National data show poverty rising again since the 1980s (p.144). |
| Forgetting the one child norm lowered China’s sex ratio too | Focus falls on population growth. | The norm lowered both population growth and the sex ratio (p.138). |
Test Yourself: Which Exercise Answers Which Section
The quickest revision check for this chapter is to answer each exercise question and confirm it against the section named here.
| Question | What it tests | Answer located in |
|---|---|---|
| Q1-2 | Regional groupings; means of strengthening domestic economies | 8.1 Introduction (p.134) |
| Q3 | India-Pakistan shared strategies | 8.2 (p.135) |
| Q4 | Great Leap Forward | 8.2 (p.135) |
| Q5 | The 1978 reforms appraisal | 8.2 and 8.6 (pp.135-136, 143) |
| Q6 | Pakistan’s path | 8.2 (pp.136-137) |
| Q7 | One child norm implication — aging | 8.3 (p.138) |
| Q8 | Demographic indicators | 8.3 (pp.137-138) |
| Q9 | India vs China GVA — what it indicates | 8.4 (pp.139-140) |
| Q10 | Human development indicators | 8.5 (pp.141-142) |
| Q11 | Liberty indicators | 8.5 (pp.142-143) |
| Q12 | Factors behind China’s rapid growth | 8.6 (pp.143-144) |
| Q13 | Classifying features of the three economies | Whole chapter |
| Q14 | Pakistan’s slow growth and poverty | 8.6 (p.144) |
| Q15 | HDI comparison | 8.5 (p.142) |
| Q16 | Growth rate trends | 8.4 (p.139) |
| Q17 | Fill in the blanks — whole chapter facts | Whole chapter |
Fill in the blanks (Q17) answers: (a) Pakistan — its first Five Year Plan commenced in 1956; (b) Pakistan — maternal mortality is highest there; (c) India — the intended answer, though both India (2019-21) and Pakistan (2023) report 21.9 per cent; (d) China — reforms were introduced in 1978 (pp.138, 142).
Two habits pay off in every answer: quote the chapter’s own figures instead of numbers from the news, and when a question asks you to compare, state the indicator, give the figure for each country, then interpret what it says about that country’s strategy.
Syllabus note: textbook contents and the examinable syllabus are not always identical — check the current official syllabus.
Revision Summary: India, China and Pakistan Side by Side
Everything the chapter compares, in one table, using the chapter’s own numbers.
| Dimension | India | China | Pakistan |
|---|---|---|---|
| Independence | 1947 | 1949 | 1947 |
| First Five Year Plan | 1951-56 | 1953 | 1956 |
| Reform year | 1991 | 1978 | 1988 |
| Development path | Agriculture to services | Agriculture to industry to services | Agriculture to services |
| GDP (PPP) | $15 trillion | $35 trillion | $1.5 trillion |
| GDP growth, 2024 | 6.5 per cent | 5.0 per cent | 3.1 per cent |
| Agriculture: GVA / workforce (2022) | 18% / 43% | 8% / 23% | 24% / 36% |
| Industry: GVA / workforce (2022) | 28% / 26% | 38% / 32% | 21% / 26% |
| Services: GVA (2022) | 54% | 54% | 55% |
| Workforce in services (1980s to 2022) | 17% to 31% | 12% to 45% | 27% to 38% |
| HDI value (rank) | 0.685 (130) | 0.797 (78) | 0.544 (168) |
| Life expectancy at birth | 72.0 years | 78.0 years | 67.6 years |
| Infant mortality (per 1000) | 25.5 | 4.8 | 51 |
| Maternal mortality (per 1 lakh births) | 103 | 23 | 154 |
| Below poverty line | 21.9% (2019-21) | 0.0% (2023) | 21.9% (2023) |
The chapter’s Recap (p.147), restated:
- Globalisation pushes developing countries to study their neighbours — they face competition from developed nations and among themselves.
- The three countries have similar physical endowments but totally different political systems.
- All three follow planned development, but through different structures of implementation.
- Till the early 1980s, growth rates and sectoral contributions to income were similar in all three.
- Reform years: China 1978, Pakistan 1988, India 1991.
- China reformed on its own initiative; international agencies forced the reforms on India and Pakistan.
- The one child norm arrested China’s population growth; no comparable change has yet happened in India and Pakistan.
- After seventy years of planned development, most workers in all three still depend on agriculture — the dependency is greatest in India.
- China followed the classical path (agriculture to manufacturing to services); India and Pakistan shifted directly from agriculture to services.
- China’s high industrial growth drove its GDP per capita far ahead of the other two.
- China leads on most human development indicators — improvements credited to pre-reform strategies, not the reform process itself.
- Liberty indicators must be considered when assessing development.
The conclusion (p.146): China used the market system without losing political commitment, retained collective ownership of land while letting individuals cultivate, and ensured social security in rural areas. India and Pakistan, by contrast, are attempting to privatise their public sector enterprises.
More Resources for Class 11 Economics
Useful pages on this site and the official source:
- Class 11 Economics NCERT book page — both NCERT books: Indian Economic Development and Statistics for Economics.
- Class 11 NCERT books hub — all Class 11 subjects.
- Class 11 Economics revision notes — the revision format of the same syllabus.
- Class 11 CBSE notes hub — notes for every Class 11 subject.
- CBSE notes home — notes by class and subject.
- Class 11 Economics Index Numbers notes — a chapter from the other NCERT Economics book, Statistics for Economics.
The official chapter file is the NCERT Class 11 Economics Chapter 8 Development Experiences of India: a Comparison with Neighbours PDF; the official NCERT website holds the current edition of the full textbook.
Sources and Data Verification
The figures and page numbers on this page describe the NCERT Class 11 Economics textbook Indian Economic Development, Chapter 8, ‘Development Experiences of India: a Comparison with Neighbours’, in NCERT’s current official edition. NCERT publishes the official chapter file at ncert.nic.in/textbook/pdf/keec108.pdf.
The official NCERT site is the authority for the textbook edition and the latest PDF. This page covers that one chapter of that one book — not the other Class 11 Economics NCERT book, Statistics for Economics.
This listing is maintained for the current academic session using the NCERT information available to us.
NCERT settles textbooks, editions and PDFs; CBSE settles the curriculum, syllabus and examinations. Textbook contents and the examinable syllabus are not always identical — check the current official syllabus.
Reference: NCERT Class 11 Economics textbook (Indian Economic Development), chapter 8, official edition on ncert.nic.in.
FAQs: Development Experiences of India: a Comparison with Neighbours
When did China, Pakistan and India introduce reforms?
China in 1978, Pakistan in 1988 and India in 1991 (pp.135, 143). China chose reform on its own initiative; India and Pakistan had to borrow from the IMF and World Bank, and India’s 1991 reforms followed its balance of payments crisis (p.144).
Why is China ahead of India on most human development indicators?
Because of the strategies China adopted before 1978, not the reform process itself (p.147). Rural health services, land reforms, decentralised planning, small enterprises and commune-based food distribution built the foundations that the reforms then built on (p.144).
What are liberty indicators and why does the chapter say the HDI is incomplete without them?
Liberty indicators are measures of political and legal freedom that the HDI lacks (pp.142-143). A measure of democratic participation in social and political decision-making exists but carries no extra weight; measures of the constitutional protection of citizens’ rights and of the independence of the judiciary and the rule of law have not even been introduced.
Without them given overriding importance, the index is incomplete and its usefulness limited.
What was the one child norm and what did it do to China’s population and sex ratio?
The one child norm, introduced in China in the late 1970s, limited couples to one child (p.138). It arrested population growth — China’s annual growth is now -0.10 per cent — but it also lowered the sex ratio, and it now leaves more elderly people relative to young, which is why China allows two children (p.138).
Which sector drives India’s growth and which drives China’s?
China’s growth is driven by manufacturing and services; India’s by services (p.141). Industry is 38 per cent of China’s GVA against 28 per cent in India, while services contribute 54 per cent in both; India and Pakistan shifted directly from agriculture to services, skipping the manufacturing stage (p.140).
Why did Pakistan’s economy slow down and poverty return?
Growth and the food supply rested on good harvests rather than institutionalised technical change, so indicators swung with the weather; foreign exchange came from Middle East remittances and volatile agricultural exports, and dependence on foreign loans grew (p.144). Poverty fell from over 40 per cent in the 1960s to 25 per cent in the 1980s, then began rising again (p.144).
Pakistan has since recovered — 2026-27 GDP growth was 5.5 per cent, its highest in the previous decade (p.145).
Explore Class 11 Economics Books
- Previous: Index Numbers
Related chapters:
- Development Policies and Experience (1947-90)
- Why Economics?
- Indian Economy