This is Chapter 2, “Indian Economy 1950–1990,” from the NCERT Class 11 Economics textbook Indian Economic Development — a 20-page chapter that runs from textbook pages 16 to 35. The official NCERT Indian Economy Class 11 Chapter 2 (1950–1990) PDF is available right here, and everything below maps what the chapter actually teaches so you can study it faster.
Download the NCERT Indian Economy Class 11 Chapter 2 (1950–1990) PDF — the official chapter file keec102.pdf from the NCERT website, containing the full text, boxes, data tables and exercises of this chapter of Indian Economic Development.
Chapter 2 at a Glance: What the PDF Holds
Use the table below to see how much is inside the chapter file — its sections, boxes, data tables and exercise questions — before you open it.
| What the chapter holds | Count | Where it is used |
|---|---|---|
| Printed pages | 20 | |
| Sections in the chapter | 6 | |
| Figures with NCERT captions | 1 | |
| Tables | 3 | |
| Exercise questions | 19 | answered in our NCERT Solutions |
| Official NCERT PDF | Download the chapter PDF | the chapter exactly as NCERT publishes it |
What Chapter 2 of Indian Economic Development Covers
This chapter tells the story of how independent India chose an economic path for the four decades after 1947, and what that choice achieved and missed.
The chapter’s own learning goals, stated at the start, are to understand the goals of India’s five year plans, the development policies followed in agriculture and industry from 1950 to 1990, and the merits and limitations of a regulated economy (NCERT, p. 16).
The journey runs in a straight line:
- Independence and the system question: after 1947, India had to choose an economic system that served everyone, and the leaders weighed capitalism, socialism and a middle path.
- The Planning Commission (1950): set up with the Prime Minister as Chairperson, it launched the era of five year plans.
- The four goals: growth, modernisation, self-reliance and equity guided every plan.
- Agriculture: land reforms and the Green Revolution, with the aim of breaking colonial stagnation.
- Industry: the Industrial Policy Resolution 1956, licensing, and the push for small-scale industry.
- Trade: the inward-looking strategy of import substitution.
- The conclusion: the successes and failures that opened the door to the 1991 economic reforms (NCERT, pp. 16–33).
A signature feature of this chapter is its set of six boxes — types of economic systems, what a plan is, Mahalanobis, the service sector, ownership and incentives, and prices as signals — each one a compact idea that the main text builds on. For how many sections, boxes and exercises the chapter holds, see the at-a-glance table above.
Core Ideas: What the Chapter Teaches
The sections below explain the chapter’s key concepts in plain words, each with the NCERT page where you can check the original. Read them in order — each idea builds on the last.
The Three Questions and India’s Choice of a Mixed Economy
Every society must answer three basic questions, and the difference between economic systems is simply who answers them: what goods and services should be produced, how they should be produced, and how they should be distributed among people (NCERT, p. 18).
- Market economy (capitalism): the market forces of supply and demand decide. Only goods that can be sold profitably get produced. Distribution depends on purchasing power — the ability to pay — not on need. The book’s example: low-cost housing for the poor is badly needed, but because the poor lack purchasing power, it does not count as market demand, so it is not produced and supplied (NCERT, p. 18).
- Socialist economy: the government decides what to produce, how to produce it, and how to distribute it, based on what people need rather than what they can afford. In principle, a socialist nation provides free health care to all its citizens (NCERT, p. 18).
- Mixed economy: the government and the market together answer the three questions. The market provides what it can produce well; the government provides essential goods and services that the market fails to deliver (NCERT, p. 18).
India’s choice came from this comparison. The socialist outlook appealed most to Jawaharlal Nehru, but he rejected the Soviet model in which the state owned all factories and farms and private property did not exist — a change in ownership he considered impossible in a democracy like India.
So India chose a socialist society with a strong public sector, but with private property and democracy (NCERT, p. 17). The Industrial Policy Resolution of 1948 and the Directive Principles of the Constitution reflected this outlook, and in 1950 the Planning Commission was set up with the Prime Minister as its Chairperson (NCERT, p. 19).
The Four Goals of the Five Year Plans
A plan exists to achieve something, so the five year plans were built around four clearly specified goals. Remember them with GEMS:
- G — Growth: an increase in the country’s capacity to produce goods and services, measured by a rising Gross Domestic Product (GDP) — the market value of all final goods and services produced in the country during a year. Think of GDP as a cake: growth makes the cake bigger, so more people can enjoy it (NCERT, p. 19).
- E — Equity: ensuring that the benefits of prosperity reach the poor, so every Indian can meet basic needs like food, a decent house, education and health care, and inequality in wealth is reduced (NCERT, p. 21).
- M — Modernisation: adopting new technology — a farmer using new seed varieties, a factory using a new machine — and also a change in social outlook, such as recognising that women should have the same rights as men and can work in banks, factories and schools (NCERT, p. 21).
- S — Self-reliance: avoiding imports of goods that India could produce itself, to reduce dependence on foreign countries and protect sovereignty (NCERT, p. 21).
The chapter is careful to say these goals can conflict. Its example: modern technology can reduce the need for labour, so modernisation can clash with the goal of increasing employment, and planners have to balance the goals (NCERT, p. 19).
India’s plans also worked to a longer, twenty-year horizon called a perspective plan, with the five year plans meant to provide its basis (NCERT, p. 19). The First Five Year Plan’s words — a “richer and more varied life” — are the chapter’s opening statement of what planning was for (NCERT, p. 16).
Agriculture: Land Reforms and the Green Revolution
Agriculture mattered because, at independence, about 75 per cent of the population depended on it and productivity was very low, forcing India to import food from the USA. The chapter follows two policy moves.
Land reforms meant changing the ownership of landholdings (NCERT, p. 22). Two steps stand out:
- Abolition of intermediaries: the zamindars and jagirdars who merely collected rent without improving the land were removed, making the actual tillers the owners — the “land to the tiller” idea. The logic was incentives: an owner who profits from higher output has reason to invest in improvements. The book’s example is the careless way Soviet farmers packed rotten fruit with fresh — since they owned no land, they neither enjoyed the profit nor suffered the loss, so they had no incentive to be efficient (NCERT, p. 23).
- Land ceiling: fixing the maximum size of land one individual could own, to reduce the concentration of land ownership in a few hands (NCERT, p. 23).
The outcomes were mixed. About 200 lakh tenants came into direct contact with the government and were freed from exploitation, and ownership gave them incentive to raise output.
But equity was only partly achieved: zamindars used legal loopholes to keep large areas, some tenants were evicted while landowners claimed to be self-cultivators, the poorest labourers such as sharecroppers did not benefit, and big landlords delayed court cases while registering land in relatives’ names.
Land reforms worked best in Kerala and West Bengal, where governments were committed to the policy (NCERT, p. 23).
The Green Revolution was the large increase in food grain production from using High Yielding Variety (HYV) seeds, especially for wheat and rice.
These seeds required fertiliser, pesticide and regular water in correct proportions, so they demanded reliable irrigation and money — which is why the first phase (mid-1960s to mid-1970s) was limited to affluent states such as Punjab, Andhra Pradesh and Tamil Nadu, mainly in wheat-growing regions, while the second phase (mid-1970s to mid-1980s) spread to more states and crops (NCERT, p. 24).
The result the exam wants you to remember: India achieved self-sufficiency in food grains and no longer depended on America for food.
A good part of the rice and wheat produced became marketed surplus — the portion of agricultural produce sold in the market by farmers — so food grain prices fell relative to other items, helping low-income groups who spend a large share of their income on food, and the government could build buffer stocks for times of shortage (NCERT, p. 25).
The chapter then weighs the subsidy debate.
On one side, subsidies gave farmers, especially small farmers, an incentive to adopt risky new technology; on the other, once the technology proved profitable, the argument runs that subsidies should be phased out because a large part of fertiliser subsidy benefits the fertiliser industry and prosperous regions, and it burdens government finances (NCERT, p. 26).
Box 2.6 adds the deeper point that prices are signals: when electricity and water are free or subsidised, people use them wastefully without regard for scarcity, whereas a price that reflects scarcity gives an incentive to use resources carefully (NCERT, p. 26).
How India’s Economic Structure Changed, 1950-51 to 1990-91
This chapter gives two data sets that are easy to confuse, so here they are side by side. Both compare 1950-51 with 1990-91 (NCERT, pp. 28 and 31).
| Measure | Sector | 1950-51 (%) | 1990-91 (%) | Change |
|---|---|---|---|---|
| Share of workforce (occupational structure) | Agriculture | 72.1 | 66.8 | −5.3 |
| Industry | 10.7 | 12.7 | +2.0 | |
| Services | 17.2 | 20.5 | +3.3 | |
| Share of GDP (sectoral composition) | Agriculture | 59.0 | 34.9 | −24.1 |
| Industry | 13.0 | 24.6 | +11.6 | |
| Services | 28.0 | 40.5 | +12.5 |
Read the two halves together and the chapter’s central point appears: agriculture’s share of GDP fell sharply while its share of the workforce stayed near two-thirds. As a nation becomes prosperous, both shares normally decline.
In India, the industrial and service sectors did not absorb the people working in agriculture, and economists call this an important failure of the policies of 1950–1990 (NCERT, p. 27).
To see how these percentage shares translate into money, take a practice GDP. Suppose India’s GDP is ₹45 lakh crore and the service sector’s share is 55 per cent. The service sector’s absolute contribution is found by multiplying the share by the GDP:
\[ 45 \times 0.55 = 24.75 \text{ lakh crore} \]
So the service sector would contribute ₹24.75 lakh crore to the GDP. This is exactly how the chapter’s structural composition data is read — a share is always a slice of a total.
Industry: Commanding Heights, IPR 1956 and the Licence System
Poor nations need industry because it provides more stable employment than agriculture and promotes modernisation and prosperity — that is why the five year plans pressed industry so hard. At independence, Indian industry was narrow, largely cotton textiles and jute, and Indian industrialists did not have the capital to undertake major ventures (NCERT, p. 28).
This is the context for the idea of the commanding heights of the economy, as the Second Five Year Plan put it: the government would have complete control of those industries vital for the economy, with the private sector complementary and the public sector leading the way (NCERT, p. 28).
That outlook became law in the Industrial Policy Resolution 1956 (IPR 1956), which classified industries into three categories (NCERT, p. 29):
- Industries exclusively owned by the government;
- Industries where the private sector could supplement the public sector, but only the government could start new units;
- The remaining industries left to the private sector.
Even those private industries were controlled through a system of licences.
No new industry could start without a government licence; licences were easier to get for backward regions, which also received tax benefits and cheaper electricity to promote regional equality; and even existing industries needed a fresh licence to expand output or diversify production, to make sure goods produced did not exceed what the economy required (NCERT, p. 29).
Small-scale industry was the other pillar. In 1955, the Karve Committee saw its potential for rural development. A small-scale unit was defined by the maximum investment on its assets — up to ₹5 lakh in 1950, later raised to ₹1 crore.
Because small units are more labour-intensive, they generate more employment, so a number of products were reserved exclusively for them, and they received concessions such as lower excise duty and cheaper bank loans (NCERT, p. 29).
Trade: Import Substitution and Its Effects
India’s industrial policy was tied to its trade policy. For the first seven plans, trade followed an inward-looking strategy called import substitution: replacing imports with domestic production, so that instead of importing vehicles, industries would be encouraged to make them in India (NCERT, p. 30).
Domestic industries were protected from foreign competition by two tools:
- Tariffs — a tax on imported goods that makes them more expensive and discourages their use;
- Quotas — a limit on the quantity of goods that can be imported (NCERT, p. 30).
Here is a worked example with new numbers to show how each works. Suppose an imported machine is priced at ₹2,00,000:
- With a 30 per cent tariff, the buyer pays ₹2,00,000 + 30% = ₹2,60,000. The import is not banned, just made dearer.
- With a quota of 5,000 machines a year, only 5,000 can enter regardless of price — the quantity is capped, and no amount of demand changes that.
Both restrict imports and protect domestic firms from foreign competition. The policy rested on the belief that industries of developing countries could not yet compete with developed economies but would learn to compete if shielded for a time (NCERT, p. 30).
The results were genuinely mixed.
Industry’s share of GDP rose from 13 per cent in 1950-51 to 24.6 per cent in 1990-91, with a 6 per cent annual growth rate, and the sector became well diversified — largely thanks to the public sector — while small-scale industry gave people without capital a chance to do business, and protection allowed electronics and automobiles to develop indigenously (NCERT, p. 30).
But the costs mounted. Waiting years for a telephone connection, and a government-run bread company named Modern Bread, became the chapter’s symbols of a public sector that kept producing goods the private sector could also supply (NCERT, p. 31).
Licensing was misused by big industrialists who took out licences not to build factories but to block competitors — the permit licence raj — and protection created a captive market in which producers had no incentive to improve quality, since they could sell low-quality goods at high prices (NCERT, p. 32).
These problems, along with worldwide changes, led to the new economic policy of 1991 — the subject of Chapter 3 (NCERT, pp. 32–33).
Figure in the Chapter: P.C. Mahalanobis, the Architect of Indian Planning
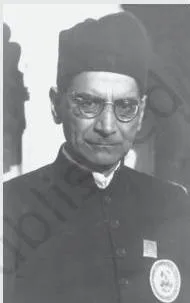
The chapter’s one portrait shows the statistician Prasanta Chandra Mahalanobis, and the box around it explains why he deserves the title “architect of Indian planning” — planning in the real sense began with the Second Five Year Plan, which was based on his ideas (NCERT, p. 20).
Use the portrait to fix the chapter’s central name-to-idea link: Mahalanobis → the Second Five Year Plan.
The chapter gives the facts that establish his standing — born in 1893 in Calcutta, educated at Presidency College and Cambridge, made a Fellow of Britain’s Royal Society in 1945, founder of the Indian Statistical Institute and the journal Sankhya, and a scholar open enough to invite even his critics to advise him, some of whom later became Nobel Prize winners (NCERT, p. 20).
If you remember only one thing from the figure, remember that the Second Plan rests on Mahalanobis’s ideas.
Key Terms in Plain Language
Quick-reference glossary so you can decode the chapter’s vocabulary without re-reading the PDF. The page numbers let you check the original passage.
| Term | Plain meaning | NCERT page |
|---|---|---|
| Plan | A document spelling out how a nation’s resources should be used, with goals and objectives to be met within a fixed period. | p. 19 |
| Perspective plan | The long-term (about 20-year) plan to which the five year plans were meant to contribute. | p. 19 |
| Market forces | The combined influence of supply and demand that decides what gets produced in a market economy. | p. 18 |
| Purchasing power | The ability to buy goods and services — having the money in your pocket. | p. 18 |
| Mixed economy | An economy where the government and the market together answer what, how and for whom to produce. | p. 18 |
| GDP | Gross Domestic Product — the market value of all final goods and services produced in the country in a year. | p. 19 |
| Structural composition | The contribution of each sector — agriculture, industry, services — to the GDP. | p. 19 |
| Modernisation | Adopting new technology and changed social outlook, such as women’s equal rights. | p. 21 |
| Self-reliance | Avoiding imports of goods India could produce itself, to protect sovereignty. | p. 21 |
| Equity | Ensuring the benefits of growth reach the poor so all can meet basic needs. | p. 21 |
| Land reforms | Change in the ownership of landholdings, mainly to help the tiller. | p. 22 |
| Land ceiling | The legal maximum size of land one individual could own. | p. 23 |
| Intermediaries | Zamindars and jagirdars who collected rent from tillers without improving the land. | p. 22 |
| Green Revolution | The large increase in food grain output from HYV seeds, fertiliser, pesticide and water. | p. 24 |
| HYV seeds | High Yielding Variety seeds, mainly for wheat and rice. | p. 24 |
| Marketed surplus | The portion of agricultural produce that farmers sell in the market. | p. 25 |
| Subsidy | Government monetary assistance, e.g. on fertiliser, to support production. | p. 26 |
| Small-scale industry | A unit defined by maximum investment on assets — ₹5 lakh in 1950, ₹1 crore later. | p. 29 |
| Import substitution | An inward-looking strategy of replacing imports with domestic production. | p. 30 |
| Tariffs | A tax on imported goods that makes them more expensive. | p. 30 |
| Quotas | A limit on the quantity of goods that can be imported. | p. 30 |
| Permit licence raj | Excessive regulation under which a licence was needed to start, expand or diversify industry, and big houses misused it to block competitors. | p. 32 |
Common Mistakes in This Chapter and How to Avoid Them
These are the points where a confused reader misreads the chapter. Each correction carries the page where the book settles it.
| Mistake | Correct rule | How to check your answer |
|---|---|---|
| “Modernisation is only new technology.” | Modernisation also means changed social outlook — such as women having the same rights as men and working outside the home (p. 21). | In an answer on planning goals, mention both technology and social outlook. |
| “Self-reliance and self-sufficiency are the same.” | Self-sufficiency in food grains was achieved by the Green Revolution; self-reliance is the broader goal of avoiding imports of goods India can produce itself (pp. 21, 24). | Use “self-sufficiency” for food grains, “self-reliance” for the general import-avoiding goal. |
| “The Green Revolution only helped rich Punjab farmers.” | The first phase did favour affluent states and wheat, but the second phase spread, and government loans, fertiliser subsidies and research institutes extended the benefits to small farmers (pp. 24–26). | Describe both phases and then the state’s role, not just the first phase. |
| “Tariffs and quotas both tax imports.” | Tariffs are a tax that raises price; quotas cap the quantity that can be imported (p. 30). | Ask yourself: does this tool change the price or the quantity? |
| “India adopted socialism.” | India chose a mixed economy with private property and democracy, not Soviet-style socialism (pp. 17–18). | Quote the chapter’s phrase: socialist outlook with a strong public sector but private property and democracy. |
| Confusing the two structural data sets. | Agriculture’s GDP share fell from about 59 to 34.9 per cent, but its workforce share stayed near two-thirds; the point is that industry and services failed to absorb farm labour (pp. 27–28, 31). | Label each figure as a workforce share (occupational structure) or a GDP share (sectoral composition) before using it. |
How to Use This Chapter for Your Exams
This chapter’s exercises reward three different skills, and each needs its own preparation. The mapping below shows the question types, the concepts they test, and the pages that answer them.
| Question type | Concept tested | Pages that answer it |
|---|---|---|
| Definition (e.g. Q1, Q4, Q5) | Define a plan; HYV seeds; marketable surplus | pp. 19, 24, 25 |
| Reason (e.g. Q2, Q3, Q10, Q12) | Why India chose planning; why plans need goals; why self-reliance; why public sector led industry | pp. 17, 19, 21, 28 |
| Explain (e.g. Q6, Q7, Q8, Q13, Q17, Q18) | Land reforms; Green Revolution; growth with equity; buffer stocks; import substitution; IPR 1956 regulation | pp. 22–26, 29, 30 |
| Balanced discuss (e.g. Q9, Q11, Q14, Q15, Q16) | Modernisation vs employment; sectoral composition; subsidies; agriculture employment; PSU losses | pp. 19, 26, 27, 31, 32 |
| Match the following (Q19) | Chapter-wide revision of terms | Whole chapter |
For the discuss questions — subsidies, public sector undertakings, agriculture employment — the chapter itself gives you both sides, and a full answer presents both before giving your view. On subsidies: the incentive for farmers to adopt new technology versus the burden on government finances and the benefit leaking to the fertiliser industry and prosperous regions (p. 26).
On public sector undertakings: welfare goals and the initial need for a public sector versus losses that drain the nation’s resources, monopolies like telecommunications, and the argument that the state should leave to the private sector what the private sector can manage (pp. 31–32). Write both sides, then conclude.
For practice with data, the Work These Out activities are worth doing: they ask you to draw pie charts of the occupational structure and of sectoral GDP shares, and to compare India’s imports and exports across years (pp. 28, 31). Drawing these charts makes the two structural data sets much harder to confuse in an exam.
One caveat before you rely on anything: textbook contents and the examinable syllabus are not always identical, so check the current official CBSE syllabus for the exact scope of this chapter.
The Chapter’s Conclusion, Point by Point
The chapter closes with its own summary of the 1950–1990 period. Here it is restated in clearer words, one idea per point, so you can check off each one while revising (NCERT, p. 33):
- India envisaged a mixed economy that combined the best features of socialism and capitalism.
- All economic planning was carried out through five year plans.
- The common goals of the plans were growth, modernisation, self-sufficiency and equity.
- Land reforms and the Green Revolution made India self-sufficient in food grain production.
- The proportion of people depending on agriculture did not decline as expected.
- Import substitution raised industry’s contribution to GDP.
- The public sector’s inefficient, loss-making units became a drain on the nation’s limited resources.
- Excessive regulation and protection weakened the incentive to improve quality, opening the way to the 1991 economic reforms.
Related Resources
This listing is maintained for the 2026-27 academic session using the NCERT textbook information available to us. NCERT remains the authority for confirming the latest edition.
Chapter 2 sits between two chapters it directly connects to. Chapter 1, Indian Economy on the Eve of Independence, provides the colonial background that this chapter’s agriculture section builds on, while Chapter 3, Economic Reforms Since 1991, is the reform story this chapter’s conclusion points forward to.
For the rest of the book, see the Class 11 Economics notes and the broader Class 11 hub.
Sources and Data Verification
This page describes the NCERT Class 11 Economics textbook Indian Economic Development, Chapter 2 “Indian Economy 1950–1990”, printed on pages 16–35 of the NCERT edition (chapter file keec102). It covers this chapter only — not the companion book Statistics for Economics, and not other chapters of either book.
This listing is maintained for the current academic session from the NCERT information available to us. NCERT settles textbooks, editions and official PDFs; CBSE settles the examinable curriculum and syllabus. The official chapter PDF is available at ncert.nic.in, and the full book’s chapter list is at the NCERT textbook page for Indian Economic Development.
Reference: NCERT Class 11 Economics textbook, chapter 2, official edition on ncert.nic.in.
FAQs
What does this chapter say about the Indian economy between 1950 and 1990?
It tells the story of India’s first seven five year plans: the choice of a mixed economy, the four planning goals, land reforms and the Green Revolution in agriculture, the public sector and licensing in industry, and the import substitution trade policy — ending with the successes and failures that led to the 1991 reforms (NCERT, pp. 16–33).
What are the four goals of India’s five year plans?
Growth, modernisation, self-reliance and equity. Growth is a rising GDP, modernisation is new technology plus changed social outlook, self-reliance is avoiding imports India can produce itself, and equity means benefits reaching the poor (NCERT, pp. 19–21).
What was the Green Revolution and why does it matter in this chapter?
The Green Revolution was the large increase in food grain production from using HYV seeds, mainly for wheat and rice, with fertiliser, pesticide and regular water. It matters because it made India self-sufficient in food grains and helped the government build buffer stocks (NCERT, pp. 24–25).
What is the difference between a tariff and a quota?
A tariff is a tax on imported goods that makes them more expensive; a quota specifies the quantity of goods that can be imported. Tariffs change the price, quotas cap the quantity (NCERT, p. 30).
Who was Mahalanobis and why is he called the architect of Indian planning?
Prasanta Chandra Mahalanobis was a statistician, educated at Presidency College and Cambridge, a Fellow of the Royal Society, and founder of the Indian Statistical Institute and the journal Sankhya. He is called the architect of Indian planning because the Second Five Year Plan, where real planning began, was based on his ideas (NCERT, p. 20).
Is Indian Economy 1950-1990 still in the Class 11 Economics syllabus?
This chapter is part of the current NCERT textbook Indian Economic Development. Textbook contents and the examinable syllabus are not always identical, so check the current official CBSE syllabus to confirm its exact scope for your session.
Explore Class 11 Economics Books
- Previous: Why Economics?
- Next: Economic Reforms Since 1991
Related chapters:
- Development Policies and Experience (1947-90)
- Collection of Data
- Organisation of Data