NCERT Class 11 Economics begins its Indian Economic Development book with chapter 1, Development Policies and Experience (1947-90) — the chapter printed in the book as “Indian Economy on the Eve of Independence” (p. 3).
The chapter runs about fifteen printed pages, and the official PDF is right below. Use the download link to open it, then work through this page to see what each section establishes before you read.
Download Development Policies and Experience (1947-90) Class 11 PDF
The official Development Policies and Experience (1947-90) Class 11 chapter PDF on NCERT’s website is the same chapter that appears in print — open it to read the full text, figures, boxed notes and exercises on the original pages.
| What the chapter holds | Count | Where it is used |
|---|---|---|
| Printed pages | 15 | |
| Sections in the chapter | 9 | |
| Figures with NCERT captions | 5 | |
| Exercise questions | 16 | answered in our NCERT Solutions |
| Official NCERT PDF | Download the chapter PDF | the chapter exactly as NCERT publishes it |
Reference: NCERT Class 11 Economics textbook, chapter 1, official edition on ncert.nic.in.
If that direct link ever changes, the Indian Economic Development e-book page on ncert.nic.in keeps the book’s eight chapters in one place and is the safer address to bookmark.
Chapter 1 at a Glance: What the PDF Holds
Chapter 1 opens unit 1 of Indian Economic Development. The unit’s two chapters together set the baseline for the whole book: this one paints the colonial economy at the eve of independence, and the next carries the story through four decades of planned development (p. 1).
The chapter is entirely conceptual — no formulas, no calculations. Its tools are three boxed notes (Textile Industry in Bengal, Agriculture During Pre-British India, Trade Through the Suez Canal), “Work These Out” prompts, a Recap and the exercise set at the end. The table below lists the chapter’s sections, captioned figures and exercise questions.
What This Chapter Covers, Section by Section
The chapter walks through the colonial economy sector by sector and asks, of each one, whether it served India or Britain. This map shows where every idea sits in the book.
| Section | NCERT pages | What it establishes |
|---|---|---|
| 1.1 Introduction | p. 4 | Why the book starts with the colonial period: today’s economy has roots in two centuries of British rule that treated India as a raw material supplier. |
| 1.2 Low level of economic development under colonial rule | pp. 4–5 | India’s pre-British handicraft fame; colonial policies protected British interests; income estimates show weak growth. |
| Box 1.1 Textile Industry in Bengal | p. 4 | Daccai muslin and its finest variety, malmal, as evidence of India’s industrial reputation. |
| 1.3 Agricultural sector | pp. 5–6 | Stagnation despite 85 per cent of people depending on agriculture; zamindari system, revenue settlement, low technology. |
| Box 1.2 Agriculture During Pre-British India | p. 5 | Bernier’s description of 17th-century Bengal’s prosperity, set against later stagnation. |
| 1.4 Industrial sector | pp. 7–8 | Decline of handicrafts, slow growth of modern industry, no capital goods base, tiny GDP share. |
| 1.5 Foreign trade | pp. 8–9 | Exporter of raw materials, importer of British finished goods; export surplus and the drain of wealth. |
| Box 1.3 Trade Through the Suez Canal | p. 9 | The 1869 canal cut transport costs and tightened British control over trade. |
| 1.6 Demographic condition | pp. 9–10 | Census from 1881; demographic transition with 1921 as the dividing year; poor health indicators. |
| 1.7 Occupational structure | pp. 10–11 | 70–75 per cent of workers in agriculture; little structural change; regional variation. |
| 1.8 Infrastructure | pp. 11–12 | Railways, ports, posts and telegraphs built for colonial interests; the railways’ two-edged effect. |
| 1.9 Conclusion | p. 13 | The scale of the social and economic challenge at independence. |
| Recap and Exercises | pp. 13–14 | NCERT’s six-point summary of the chapter and its question set. |
The Six Lenses: How the Chapter Reads the 1947 Economy
One claim runs through every section: the colonial government ran India for Britain’s benefit. The chapter tests that claim across six sectors. The table collects what each lens establishes.
| Lens | What the chapter says | NCERT page |
|---|---|---|
| The colonial motive | India was reduced to a raw material supplier for Britain’s industries and a market for their finished goods. | p. 4 |
| National and per capita income | No serious official estimates existed; individual estimates conflicted, but growth of aggregate output in the first half of the 20th century was under 2 per cent, with per capita output rising only about 0.5 per cent a year. | pp. 4–5 |
| Agriculture | About 85 per cent of people lived in villages, yet the sector stagnated — zamindari rents, rigid revenue deadlines, low technology, missing irrigation, negligible fertilisers. | pp. 5–6 |
| Industry | World-famous handicrafts declined; modern industry (cotton, jute, TISCO) grew slowly with no capital goods industry and a tiny GDP share. | pp. 7–8 |
| Foreign trade | India exported raw materials and imported British finished goods; a large export surplus drained wealth. | pp. 8–9 |
| Demography | First stage of demographic transition until 1921, second stage after; high mortality, low literacy and life expectancy. | pp. 9–10 |
| Occupational structure | 70–75 per cent of workers in agriculture, 10 per cent in manufacturing, 15–20 per cent in services. | pp. 10–11 |
| Infrastructure | Railways, ports and telegraphs served army movement and raw material extraction; the railways’ social benefits were outweighed by economic loss. | pp. 11–12 |
Read the occupational structure row carefully. With 70–75 per cent of the workforce in agriculture, only about a quarter remained for everything else — manufacturing at roughly 10 per cent and services at 15–20 per cent. That arithmetic is the chapter’s proof that the colonial economy’s structure had barely changed (p. 10).
The six sector sections run in a fixed order — Agriculture, Industrial sector, Foreign trade, Demographic condition, Occupational structure, Infrastructure. Their initials are A-I-F-D-O-I. Recall them as “All Indian Farmers Deserve Our Irrigation,” and you will never scramble the order.
The Five Figures in the Chapter, Explained
Each captioned figure in this chapter makes one piece of colonial history visible. Work through them in the order the chapter uses.
Fig. 1.1 India’s agricultural stagnation under the British colonial rule
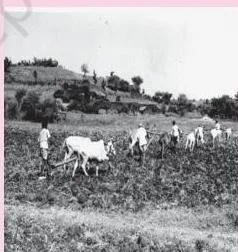
The chapter places this image beside Box 1.2, where the traveller Bernier calls 17th-century Bengal richer than Egypt. Together they make the section’s point visually: the same land that once exported cottons, silks and rice had, two centuries later, come to stand for stagnation (pp. 5–6). Read Fig. 1.1 as the “after” picture of the “before” Bernier describes.
Fig. 1.2 Suez Canal: Used as highway between India and Britain
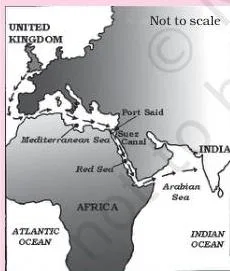
The Suez Canal appears in the foreign trade section, and Box 1.3 explains its economics. By linking the Mediterranean with the Red Sea, it let ships skip the journey around Africa, cut transport costs, and made the Indian market easier for Britain to reach.
The image shows why the chapter calls the canal a highway — the physical channel through which raw materials left India and British manufactures entered (p. 9).
Fig. 1.3 A large section of India’s population did not have basic needs such as housing
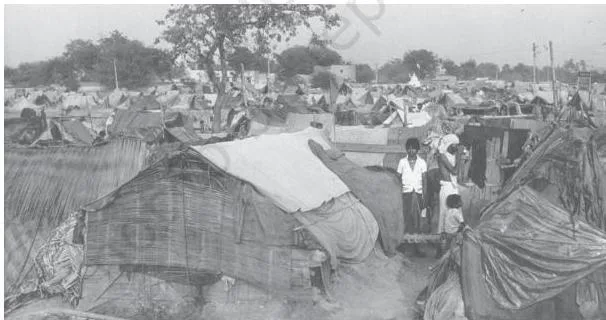
This image sits in the demographic section to make poverty concrete. The chapter’s numbers — infant mortality of about 218 per thousand, literacy below 16 per cent, life expectancy near 32 years — are abstract until paired with this photograph of people without basic shelter (p. 10).
Fig. 1.4 First Railway Bridge linking Bombay with Thane, 1854
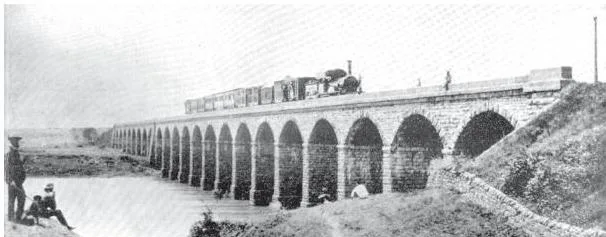
The British introduced railways in 1850, and this 1854 bridge belonged to the first line. The chapter treats the railways as one of the colonial era’s most important contributions, then immediately complicates the praise: the same railways that broke geographical and cultural barriers also commercialised agriculture and broke the self-sufficiency of village economies (p. 11).
Fig. 1.4 stands at the start of that double-edged story.
Fig. 1.5 Tata Airlines, a division of Tata and Sons, was established in 1932 inaugurating the aviation sector in India
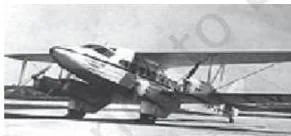
This 1932 photograph is the chapter’s reminder that Indian enterprise existed in modern industry even under colonial rule. Tata Airlines inaugurated India’s aviation sector, and TISCO had been incorporated in 1907 — proof that Indians did build modern firms, even though the overall industrial base stayed small (p. 12).
Terms You Must Be Able to Define From This Chapter
The chapter is dense with terms that students half-remember. This glossary fixes each one in plain language, with the page where the book defines it.
| Term | Definition | NCERT page |
|---|---|---|
| National income | The total money value of all final goods and services produced in a country in a year. The colonial government never made a serious official attempt to measure India’s national income. | p. 4 |
| Per capita income | National income divided by the population — the average income per person. Growth in per capita output during the first half of the 20th century was only about half a per cent a year. | pp. 4–5 |
| Zamindari system | A land settlement under which zamindars collected rent from cultivators and paid a fixed sum to the colonial government. The profit went to the zamindars, not the people who worked the land. | p. 5 |
| Revenue settlement | The fixed terms and deadlines under which zamindars had to deposit revenue. Missing a deadline meant losing their rights, which is why zamindars squeezed tenants regardless of their condition. | p. 5 |
| Commercialisation of agriculture | The shift from growing food crops to growing cash crops such as cotton and indigo, produced for British industry and export rather than local needs. | p. 6 |
| De-industrialisation | The systematic decline of India’s world-famous handicraft industries under colonial rule, with no modern industrial base allowed to replace them. | p. 7 |
| Capital goods industry | Industry that produces machine tools, which are in turn used to produce articles for current consumption. India had hardly any, so further industrialisation could not take root. | p. 7 |
| Gross Domestic Product (GDP) / Gross Value Added | Measures of the market value of goods and services produced in the economy. The new industrial sector’s contribution to GDP remained very small. | p. 8 |
| Export surplus | The excess of exports over imports in value. India ran a large export surplus throughout the colonial period — but at a huge cost to the economy. | p. 8 |
| Drain of Indian wealth | The outflow caused when the export surplus brought no gold or silver into India; instead it paid for the colonial office in Britain, British war expenses and invisible imports. | p. 9 |
| Demographic transition | The historical shift of a population from high birth and death rates to low ones. India was in its first stage before 1921 and entered the second stage after 1921. | p. 9 |
| Mortality rate / infant mortality rate | Deaths per thousand people; infant mortality counts deaths of infants per thousand live births. The colonial infant mortality rate stood at about 218 per thousand. | p. 10 |
| Life expectancy | The average number of years a person is expected to live. It was about 32 years during the colonial period, against about 70 years now. | p. 10 |
| Occupational structure | The distribution of working persons across different industries and sectors. India’s showed little change through the colonial period. | p. 10 |
Common Mistakes and the Correct Reading
These are the confusions the chapter’s own prompts, boxes and Recap warn against. Name the mistake before the exam makes it for you.
| Common mistake | Correct reading | How to check your answer |
|---|---|---|
| The colonial export surplus meant trade was doing well. | The surplus drained wealth. No gold or silver flowed into India; the surplus paid for the colonial office in Britain, war expenses and invisible imports, while food grains and kerosene stayed scarce at home. | Ask what came back in exchange: if nothing did, the surplus benefited Britain, not India (pp. 8–9). |
| The zamindars alone caused agricultural stagnation. | The revenue settlement forced zamindars to meet fixed deadlines or lose their rights, so they squeezed tenants. Low technology, missing irrigation and negligible fertiliser added to the stagnation. | List all four causes named in section 1.3 before answering (pp. 5–6). |
| The railways were a pure gift to India. | Their social benefits — long-distance travel, breaking barriers — were outweighed by a huge economic loss, and they pushed the commercialisation that destroyed village self-sufficiency. | Weigh one benefit against one cost, exactly as the chapter does (pp. 11–12). |
| De-industrialisation means India had no industry. | It means the world-famous handicrafts collapsed without a modern base replacing them. Cotton and jute mills, TISCO (1907), sugar, cement and paper existed, but there was no capital goods industry and a tiny GDP share. | Quote the industries that did exist, then state what was missing (pp. 7–8). |
| 1921 means population growth suddenly became high. | The second stage of demographic transition began after 1921, but neither the total population nor the growth rate was yet very high. | State exactly what changed after 1921 — the stage, not the size (p. 9). |
| The British Raj was beneficial, end of debate. | The chapter treats this as a perception that needs informed debate, and section 1.8 gives both sides: infrastructure built for selfish motives, yet a base independent India had to build on. | In a discussion, name at least one gain and one loss before concluding (p. 12). |
Using This Chapter for Answer Writing
Every exercise in this chapter is answered inside the chapter itself — the task is knowing which section to open. Use this map, then the framework for the big debate question.
| Exercise question | Section that answers it |
|---|---|
| Q1 | 1.1–1.2 (Introduction; low level of economic development) |
| Q2 | 1.2 (income estimators) |
| Q3 | 1.3 (agricultural sector) |
| Q4, Q5, Q6, Q8 | 1.4 (industrial sector) |
| Q9, Q15 | 1.5 (foreign trade) |
| Q10, Q11, Q14 | 1.6 (demographic condition) |
| Q12 | 1.7 (occupational structure) |
| Q7 | 1.8 (infrastructure) |
| Q13 | 1.9 (conclusion) |
| Q16 | The whole chapter, plus the Recap (pp. 13–14) |
Q16 — “Were there any positive contributions made by the British in India?” — is the chapter’s debate question, and a full answer makes three moves. First, name the base the British did build: railways, ports, posts and telegraphs, with railways treated as their most important contribution (p. 11).
Second, weigh it against the selfish motive the chapter stresses — infrastructure mainly served army movement and drawing raw materials out to Britain (pp. 11–12). Third, close with the Recap’s verdict: the railways’ social benefits were outweighed by economic loss, yet independent India had to build on the British base through planning (pp. 11–13). A full answer shows both sides before concluding.
One caution: textbook contents and the examinable syllabus are not always identical — check the current official syllabus. This chapter has no formulas, so the work is remembering causes, effects and definitions rather than practising calculations.
The Chapter’s Recap in Your Own Words
NCERT closes the chapter with a Recap (p. 13). These six points are that list, rephrased — if you revise nothing else, revise these.
- Baseline: you must know the pre-independence economy to judge post-independence development — the whole book’s method.
- Motive: colonial policies protected British economic interests, not Indian development.
- Agriculture: the sector stagnated even though the largest share of the population lived off it.
- Industry: world-famous handicrafts collapsed without a modern industrial base replacing them.
- Demography: poor public health, frequent famines and natural calamities kept mortality high.
- Infrastructure: it was built with selfish motives, yet independent India had to build on that base through planning.
Three boxed facts are commonly asked about: Daccai muslin, the fine Bengal cotton whose best variety was called malmal, was world-famous (p. 4); Bernier described 17th-century Bengal as richer than Egypt (p. 5); and the Suez Canal opened in 1869, shortening the sea route between Britain and India (p. 9).
Activities in the Chapter That Practise These Ideas
The “Work These Out” prompts turn the chapter’s facts into skills — map reading, research and debate. Try them as self-test:
- Compare the map of British India with independent India, identify what went to Pakistan, and work out why those areas mattered economically (p. 6).
- Research the different revenue settlements the British used, where they applied them, and how far they still affect agriculture today (p. 6).
- Mark India’s cotton and jute mills at independence on a map (p. 8).
- Compare pre-independence exports and imports with today’s, using the Economic Survey (p. 9).
- Read Amartya Sen’s Poverty and Famines to understand why famines recurred before independence (p. 11).
- Prepare a pie chart of the occupational structure at independence (p. 11).
- Hold the class debate: “Was the British Raj good for India?” (p. 12).
The chapter also closes with four Suggested Additional Activities (p. 15) — including the discussion of whether the zamindari system has really been abolished in India.
Related Chapters and Sources
This listing is maintained for the 2026-27 academic session using the NCERT textbook information available to us. NCERT remains the authority for confirming the latest edition.
Chapter 1 is the first half of unit 1 — the book says the unit’s two chapters give an overview of the economy from the eve of independence through four decades of planned development (p. 1). The chapter that follows carries the story from 1950 to 1990; open the Class 11 Economics book page to reach it.
To revise, the Class 11 Economics notes and the Indian Economic Development notes cover this chapter’s ground, and the Class 11 notes hub gathers study material across the class. The main CBSE notes index is the fastest starting point if you search across classes, and the Class 11 NCERT books hub lists every textbook this site covers.
Reference: NCERT Class 11 Economics textbook, chapter 1, official edition on ncert.nic.in.
Sources and Data Verification
This page describes the NCERT Class 11 Indian Economic Development textbook, English edition, as published on ncert.nic.in, and is maintained for the current academic session. Every figure, page number and exercise reference comes from that edition of chapter 1.
This page covers chapter 1 of this book only, not the full Class 11 Economics syllabus. NCERT settles the textbook, its editions and the official PDF; CBSE settles the curriculum, syllabus and examinations. Because textbook contents and the examinable syllabus are not always identical, check the current official syllabus before preparing.
Frequently Asked Questions About Development Policies and Experience (1947-90)
What was the state of agriculture on the eve of independence?
Agriculture employed about 85 per cent of the population, mostly in villages, yet the sector was stagnant (NCERT, p. 5).
The zamindari system sent profits to landlords rather than cultivators, fixed revenue deadlines forced zamindars to squeeze tenants, and low technology, missing irrigation and negligible fertiliser use kept productivity low. Some cash-crop areas did better, but that commercialisation served British industry.
What does the drain of Indian wealth mean in this chapter?
It means the colonial export surplus enriched Britain, not India. Because no gold or silver flowed in, the surplus paid for the colonial government’s office in Britain, British war expenses and imported invisibles, while essential goods like food grains and kerosene stayed scarce at home (NCERT, pp. 8–9).
NCERT, pp. 9″>
div> The end —
Explore Class 11 Economics Books
Related chapters:
- Why Economics?
- Collection of Data
- Economic Reforms Since 1991