
Water (Oceans) is Chapter 12 of the NCERT Class 11 Geography book Fundamentals of Physical Geography. These notes reorganise the chapter into four revision blocks — the hydrological cycle, relief of the ocean floor, temperature of ocean waters and salinity of ocean waters — with the definitions, number facts and diagrams you need for quick revision in the 2026-27 session.
Use the jump links below to skip to any block. Tables carry the data, the worked examples show the two number skills the chapter uses, and the common-mistakes table plus the night-before recap are the fastest self-check. This chapter is number-heavy but contains no equations — most of your revision is recalling definitions and fixed values.
What Chapter 12 Water (Oceans) covers — a revision map
Chapter 12 is organised into four content blocks. The table shows where each block sits in the textbook and what deserves most of your revision time.
| Content block | Textbook pages | Priority while revising |
|---|---|---|
| Hydrological cycle | NCERT pp. 100–101 | Definition; the 91 per cent and 59 per cent figures; component–process pairs. |
| Relief of the ocean floor | NCERT pp. 101–103 | Four major divisions with gradient, depth and width values; five minor features with one example each. |
| Temperature of ocean waters | NCERT pp. 103–105 | Four controlling factors; three-layer vertical profile; thermocline; surface averages by latitude. |
| Salinity of ocean waters | NCERT pp. 104–106 | Definition in parts per thousand; four influencing factors; ocean-wise horizontal averages; halocline. |
The unit heading also lists waves, tides and currents, but those are movements of ocean water and belong to the next chapter. Here the focus stays on where ocean water is, how warm or cold it is, and how salty it is.
This page sits inside the Class 11 Geography notes hub — pair it with the other chapter notes, or jump to the Class 11 notes index and the full list of CBSE notes when you switch subjects.
Hydrological cycle: how Earth’s water moves and why it is unevenly distributed
The hydrological cycle is the circulation of water within Earth’s hydrosphere in its three phases — liquid, solid and gaseous. It is a continuous exchange of water between the oceans, the atmosphere, the land surface, the subsurface and living organisms (NCERT, p. 100). Because the same water is used and re-used, it is a renewable resource.
The chapter calls water a rare commodity in the solar system and Earth the ‘Blue Planet’ because of its abundant surface water.
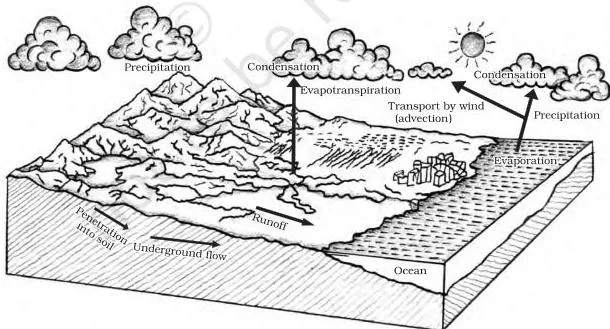
Figure 12.1 draws these exchanges as one connected cycle. The storage components and the processes that move water between them are the chapter’s Table 12.1; the compressed version below keeps the same pairs.
| Component (where water is stored) | Process (what happens there) |
|---|---|
| Water storage in oceans | Evaporation, evapotranspiration, sublimation |
| Water in the atmosphere | Condensation, precipitation |
| Water storage in ice and snow | Snowmelt runoff to streams |
| Surface runoff | Stream flow, freshwater storage, infiltration |
| Groundwater storage | Groundwater discharge, springs |
Bank-account analogy for the cycle. Read the whole cycle like a bank account:
- Evaporation is a withdrawal — water leaves the ocean and enters the atmosphere.
- Precipitation is a deposit — rain and snow put water back on land and sea.
- Groundwater is savings — water stored underground for long periods.
- Rivers are the cash flow — they carry water from land back to the ocean.
Two percentages anchor the quantitative side: about 91 per cent of planetary water is in the oceans, and nearly 59 per cent of the water that falls on land returns to the atmosphere through evaporation; the rest runs off, infiltrates underground, or becomes glacier (NCERT, p. 101).
The renewable supply is constant while human demand rises sharply, so shortages appear across space and time — and river pollution intensifies the crisis. The chapter just before this one covered the atmospheric side of the same cycle; the Water in Atmosphere notes are the right companion while revising.
Relief of the ocean floor: the four major divisions
Geographers divide the oceans into five — Pacific, Atlantic, Indian, Southern and Arctic. A major portion of the ocean floor lies between 3 and 6 km below sea level, and it is as rugged as the continents: it holds the world’s largest mountain ranges, deepest trenches and largest plains, shaped by tectonic, volcanic and depositional processes (NCERT, p. 101).
The floor is divided into four major divisions.
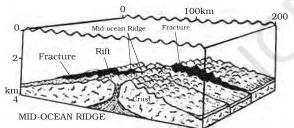
Figure 12.2 shows the four divisions in their natural order across an ocean basin. Read it from the continent outward: continental shelf → shelf break → continental slope → deep sea plain → oceanic deeps. The measurements below are the ones to quote in an answer.
| Division | Signature measurements | Points to remember |
|---|---|---|
| Continental shelf | Gradient 1° or less; average width about 80 km; depth 30–600 m | Shallowest part, covered by shallow seas; ends at the steep shelf break; Siberian shelf (Arctic) is the largest at 1,500 km; thick sediments become a source of fossil fuels. |
| Continental slope | Gradient 2–5°; depth 200–3,000 m | Connects the shelf to the ocean basins; its boundary marks the end of the continents; canyons and trenches occur here. |
| Deep sea plain | Depth 3,000–6,000 m | Flattest and smoothest regions of the world; covered with fine-grained clay and silt. |
| Oceanic deeps / trenches | 3–5 km deeper than the surrounding floor | Steep-sided narrow basins at the bases of continental slopes and along island arcs; associated with active volcanoes and strong earthquakes, so significant in plate-movement studies; 57 explored — 32 Pacific, 19 Atlantic, 6 Indian. |
Two details usually get missed. The shelf break is the steep edge where the shelf ends and the slope begins. And the oceanic deeps matter in plate-tectonic studies precisely because of their link to volcanoes and earthquakes (NCERT, p. 102).
Minor relief features: ridges, seamounts, canyons, guyots and atolls
Five smaller features stand out on the ocean floor. Learn each as a pair: what it looks like and an example or where it is found.
| Feature | What it is | Example |
|---|---|---|
| Mid-oceanic ridge | Two chains of mountains separated by a large depression; peaks can reach 2,500 m and some rise above the surface | Iceland, part of the mid-Atlantic Ridge |
| Seamount | Volcanic mountain with a pointed summit, rising from the seafloor but never reaching the surface; 3,000–4,500 m tall | Emperor seamount, an extension of the Hawaiian Islands |
| Submarine canyon | Deep valley cutting across shelves and slopes, often continuing from large river mouths; some rival the Grand Canyon | Hudson Canyon |
| Guyot | A flat-topped seamount, formed by gradual subsidence through stages | More than 10,000 seamounts and guyots estimated in the Pacific alone |
| Atoll | Low island in tropical oceans made of coral reefs surrounding a central depression, often a lagoon | Found in tropical oceans |
The seamount–guyot pair is the one to separate carefully: a seamount has a pointed summit; a guyot is a flat-topped seamount whose peak subsided gradually through stages (NCERT, pp. 102–103).
Temperature of ocean water: four factors and a three-layer profile
Ocean water is heated by solar energy, but it heats and cools more slowly than land. Four factors control where ocean water is warm and where it is cold (NCERT, p. 103):
- Latitude — surface temperature decreases from the equator poleward because insolation decreases in the same direction.
- Unequal land–water distribution — northern-hemisphere oceans receive more heat because of their greater contact with land.
- Prevailing winds — offshore winds push warm surface water away and cause upwelling of cold water from below; onshore winds pile warm water against the coast.
- Ocean currents — warm currents raise temperatures, cold currents lower them. The Gulf Stream warms the eastern coast of North America and western Europe; the Labrador Current cools the north-east coast of North America.
Enclosed seas behave predictably: warmer than open seas in low latitudes, colder than open seas in high latitudes.
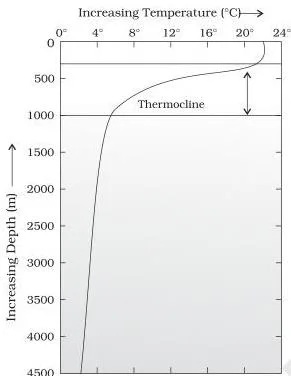
Figure 12.3 is the chapter’s temperature–depth profile. The thermocline is the boundary region between warm surface waters and the deeper layers, where temperature falls rapidly. It usually begins around 100–400 m below the surface and extends several hundred metres downward. About 90 per cent of the total volume of ocean water lies below the thermocline, where temperatures approach 0°C (NCERT, p. 103).
In middle and low latitudes the ocean has a three-layer structure from surface to bottom:
| Layer | Thickness and temperature | Notes |
|---|---|---|
| 1. Warm surface layer | About 500 m thick; 20–25°C | Present all year in the tropics; develops only in summer in mid-latitudes. |
| 2. Thermocline layer | 500–1,000 m thick | Rapid decrease of temperature with increasing depth. |
| 3. Cold deep layer | Extends to the deep ocean floor | Approaches 0°C; holds about 90 per cent of ocean volume. |
In the Arctic and Antarctic circles this structure collapses to one layer: surface water is already near 0°C, so temperature changes very little with depth (NCERT, p. 104).
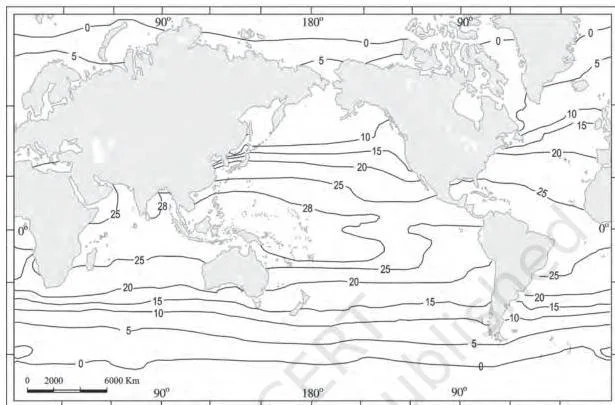
Figure 12.4 maps the spatial pattern of surface temperature — use it to confirm the equator-to-pole cooling trend. Keep these surface averages ready:
- Overall average surface temperature of the oceans is about 27°C, falling by about 0.5°C per degree of latitude.
- About 22°C at 20° latitude; about 14°C at 40° latitude; near 0°C at the poles (NCERT, p. 104).
- Northern-hemisphere oceans average about 19°C; southern-hemisphere oceans about 16°C — the difference comes from unequal land–water distribution.
- The warmest surface water sits slightly north of the equator, not exactly on it.
Temperature is always highest at the surface because the sun heats the surface directly and heat is carried downward by convection. The fall is rapid down to about 200 m and then slows (NCERT, p. 104).
Salinity of ocean water: definition, factors and distribution
Salinity is the total content of dissolved salts in sea water. It is calculated as the amount of salt, in grams, dissolved in 1,000 g (1 kg) of sea water and is expressed in parts per thousand (ppt) — also called per mille (NCERT, p. 104). A salinity of 24.7 ppt is the upper limit that separates brackish water from saline water.
Four factors control ocean salinity:
- Evaporation and precipitation in the surface layer — the main drivers.
- Fresh water inflow from rivers in coastal regions, and freezing and thawing of ice in polar regions.
- Wind, which transfers water from one area to another.
- Ocean currents, which move water of different salinities around. Salinity, temperature and density are interrelated, so a change in any one affects the others.
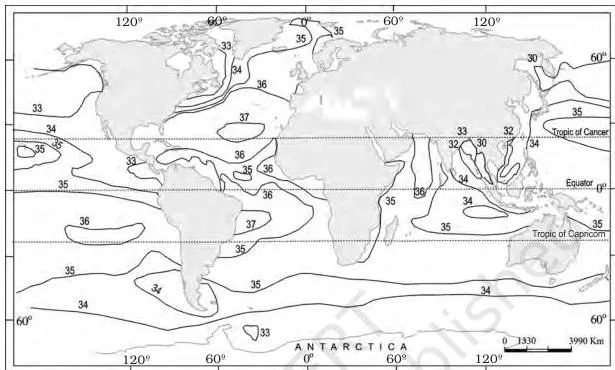
Figure 12.5 maps the surface salinity of the world’s oceans. The values students most often confuse are the extremes and the normal range, so keep them in separate mental boxes:
| Water body or condition | Salinity (ppt) | Note |
|---|---|---|
| Normal open ocean | 33–37 | Standard range for open-ocean water |
| Red Sea (land-locked) | 41 | High because it is nearly enclosed |
| Estuaries and the Arctic | 0–35 | Fluctuates seasonally with fresh water mixing |
| Hot, dry regions with high evaporation | Sometimes up to 70 | Evaporation concentrates the salts |
| Lake Van (Turkey) | 330 | Highest salinity among the named water bodies |
| Dead Sea | 238 | Second-highest named value |
| Great Salt Lake | 220 | Third-highest named value |
Horizontally, each ocean has a signature average (NCERT, p. 105):
| Ocean | Average salinity | Pattern to quote |
|---|---|---|
| Atlantic | About 36 ppt | Maximum 37 ppt between 20°N–30°N and 20°W–60°W; North Sea is saltier because the North Atlantic Drift brings saline water; Baltic Sea records low salinity from large river inflow; Mediterranean Sea has higher salinity due to high evaporation; Black Sea is very low because of enormous fresh water inflow. |
| Indian | About 35 ppt | Bay of Bengal shows low salinity due to river inflow; Arabian Sea shows higher salinity due to high evaporation and low fresh water inflow. |
| Pacific | 35 ppt, falling to 31 ppt | Shape and large areal extent matter; western parts of the northern hemisphere drop to 31 ppt from the influx of melted Arctic water; south of 15–20°S it decreases to 33 ppt. |
Vertically, salinity behaves differently from temperature. Surface salinity rises when water is lost to evaporation or ice formation and falls when fresh water arrives. At depth, salinity is nearly fixed because water is not ‘lost’ and salt is not ‘added’ there. The general pattern: salinity increases with depth, and the zone where it rises sharply is the halocline.
Saltier water is denser, so high-salinity water sinks below lower-salinity water, producing stratification by salinity (NCERT, pp. 105–106).
Definitions table: ocean-water terms to write word-perfect
A complete short answer usually opens with one of these definitions. Learn the meaning column first, then attach the example or trigger.
| Term | Meaning | Example or trigger |
|---|---|---|
| Hydrological cycle | Circulation of water within Earth’s hydrosphere in liquid, solid and gaseous phases (NCERT, p. 100) | Ocean → atmosphere → land → ocean |
| Salinity | Total dissolved-salt content of sea water, in grams per 1,000 g (1 kg) of sea water (p. 104) | 35 ppt water = 35 g salt per 1 kg |
| Brackish water | Water with salinity at or below 24.7 ppt (p. 104) | Estuaries and lagoons |
| Continental shelf | Submerged margin of a continent covered by shallow seas (p. 101) | Siberian shelf |
| Shelf break | Steep edge where the continental shelf ends (p. 101) | Shelf → slope transition |
| Continental slope | Steep zone connecting the shelf to the ocean basins; marks the end of the continents (p. 102) | Gradient 2–5° |
| Deep sea plain | Flattest and smoothest regions of the ocean floor, 3,000–6,000 m deep (p. 102) | Covered with clay and silt |
| Oceanic deep | Steep-sided narrow basin forming the deepest parts of the ocean (p. 102) | 57 explored so far |
| Mid-oceanic ridge | Two chains of mountains separated by a large depression (p. 102) | Iceland / mid-Atlantic Ridge |
| Seamount | Pointed volcanic mountain rising from the seafloor without reaching the surface (p. 102) | Emperor seamount |
| Submarine canyon | Deep valley cutting across continental shelves and slopes (pp. 102–103) | Hudson Canyon |
| Guyot | Flat-topped seamount formed by gradual subsidence (p. 103) | Pacific has over 10,000 seamounts and guyots |
| Atoll | Low tropical island of coral reefs surrounding a central depression (p. 103) | Lagoon in tropical oceans |
| Thermocline | Zone of rapid temperature decrease below the surface layer (p. 103) | Begins around 100–400 m depth |
| Halocline | Zone where salinity increases sharply with depth (pp. 105–106) | Separates lower-salinity surface water from dense deep water |
The most commonly swapped pair deserves a direct comparison:
| Term | What changes sharply | Memory link |
|---|---|---|
| Thermocline | Temperature falls rapidly with depth | Thermos = heat |
| Halocline | Salinity rises sharply with depth | Halite = rock salt |
Memory hook: thermos = heat → thermocline is about temperature; halite = rock salt → halocline is about salinity.
The number rules that work like formulas
This chapter has no equations, but it has number rules that behave like formulas — fixed values you recall directly. The only genuine ratio is the salinity definition: grams of salt per 1,000 g of sea water. Worked example 1 below uses it.
| Rule | Value or range | Textbook page |
|---|---|---|
| Salinity ratio | Salt in grams per 1,000 g (1 kg) of sea water | p. 104 |
| Upper limit of brackish water | 24.7 ppt | p. 104 |
| Normal open-ocean salinity | 33–37 ppt | p. 105 |
| Surface temperature fall with latitude | About 0.5°C per degree | p. 104 |
| Average surface temperature of oceans | About 27°C | p. 104 |
| Thermocline thickness | 500–1,000 m | p. 103 |
| Average shelf width | About 80 km | p. 101 |
| Shelf gradient | 1° or less | p. 101 |
| Continental slope gradient | 2–5° | p. 102 |
| Deep sea plain depth | 3,000–6,000 m | p. 102 |
Worked examples: applying the chapter’s number rules
Two skills appear again and again: converting salinity in ppt into an actual mass of salt, and identifying a relief feature from depth and gradient values. Both examples below use original numbers.
Worked example 1: salinity conversion
Method: start from the definition of salinity, then scale the mass down proportionally.
Step 1: Write what 35 ppt means.
A seawater sample of salinity 35 ppt contains 35 g of dissolved salts in every 1,000 g (1 kg) of sea water (NCERT, p. 104).
Step 2: Set up the proportion for a 500 g sample:
\[ \text{salt} = 35\ \text{g} \times \frac{500\ \text{g}}{1{,}000\ \text{g}} \]
Step 3: Multiply and divide:
\[ \text{salt} = \frac{35 \times 500}{1{,}000} = \frac{17{,}500}{1{,}000} = 17.5\ \text{g} \]
Final answer: A 500 g sample of sea water with salinity 35 ppt contains 17.5 g of dissolved salts.
Worked example 2: relief identification
Method: compare each measurement with the ranges in the chapter’s table of divisions.
Step 1: The steep segment has a gradient of about 3° and depths increasing from 250 m to 2,800 m.
A gradient of 3° rules out the continental shelf (1° or less) and matches the continental slope (2–5°); the depth of 2,800 m also fits the slope’s 200–3,000 m range (NCERT, p. 102).
- Step 1: The slope boundary marks the end of the continents, so identify this segment as a continental slope.
- Step 2: The profile then flattens at about 4,200 m depth.
The deep sea plain lies between 3,000 m and 6,000 m, so 4,200 m sits inside that band (NCERT, p. 102).
Final answer: The steep segment is a continental slope; the flat segment at about 4,200 m is a deep sea plain. It is not an oceanic deep, because deeps are defined as lying 3–5 km below the surrounding floor, not by a fixed depth band.
Common mistakes students make in Water (Oceans)
The five errors below are the ones that cost the most revision time. Each row shows the wrong idea, the correct rule and a quick self-check.
| Mistake | Correct rule | How to check your answer |
|---|---|---|
| “24.7 ppt is normal ocean salinity.” | 24.7 ppt is only the upper limit for brackish water; normal open-ocean salinity is 33–37 ppt. | Ask: am I naming a brackish boundary or an open-ocean range? |
| “The shelf gradient is steeper than the slope’s.” | Shelf gradient is 1° or less; slope gradient is 2–5°. | The shelf is nearly flat; the slope is the steep drop. |
| “The warm surface layer is the thermocline.” | The thermocline is the zone of rapid temperature decrease below the surface layer. | Ask: is the temperature changing fast here? That zone is the thermocline. |
| “Salinity decreases with depth.” | Salinity generally increases with depth; the sharp increase is the halocline. | Dense high-salinity water sinks below fresher, lighter surface water. |
| “The Red Sea is the saltiest water body.” | The saltiest named water body is Lake Van at 330 ppt; the Red Sea (41 ppt) is the saltiest named sea. | Check the extremes list first: Lake Van > Dead Sea > Great Salt Lake > Red Sea. |
How to structure answers to this chapter’s exercises
The exercise set for this chapter has five multiple-choice questions, six short questions and two long questions. A complete answer does two things every time: it defines the term in its own words, and it supports that definition with one number or one named example.
Short answers (about 30 words). Use a two-sentence frame: definition + one supporting fact. Open with the term defined (salinity, thermocline, continental margin), then attach the single most relevant number or location from the page where that term appears. One quantitative fact is enough — do not list everything you remember.
For a question such as “What is a thermocline?”, the frame would join the definition of rapid temperature decrease to a value from the same page, such as the depth range where the boundary begins (NCERT, p. 103).
Long answers (about 150 words). Use a three-part frame: definition opener → process chain → closing verdict.
- Open with the definition of the central term (hydrological cycle, temperature distribution of the oceans).
- Build the chain step by step: name each factor, explain its mechanism in one line, and attach a named example — Gulf Stream, Labrador Current, Siberian shelf, Baltic Sea, Mediterranean Sea.
- Close with one sentence that directly answers the question asked.
Use named examples from the chapter whenever a factor is involved — the warm Gulf Stream and cold Labrador Current make the ocean-current factor concrete, and the Baltic versus Mediterranean contrast does the same for salinity.
For the question about the deepest trenches of various oceans, the chapter supplies only counts, not names: 57 explored deeps, of which 32 are in the Pacific, 19 in the Atlantic and 6 in the Indian Ocean (NCERT, p. 102).
The multiple-choice questions check the same concept facts in objective form — a process that is not part of the hydrological cycle, the depth range of the continental slope, a feature that is not minor relief, the unit in which salinity is expressed, and the smallest of the five oceans. Some of those facts sit in the number-rules table above.
Night-before revision: Water (Oceans) in one page
Final pass — three tables that carry everything. If you can reproduce these, you have the chapter.
Table 1: Ocean-floor divisions and their signature numbers.
| Division | Signature number |
|---|---|
| Continental shelf | Gradient 1° or less; depth 30–600 m; average width ~80 km; Siberian shelf 1,500 km |
| Continental slope | Gradient 2–5°; depth 200–3,000 m; marks the end of the continents |
| Deep sea plain | 3,000–6,000 m; flattest and smoothest; clay and silt |
| Oceanic deeps | 3–5 km deeper than the surrounding floor; 57 explored (32 Pacific, 19 Atlantic, 6 Indian) |
Table 2: Temperature and salinity snapshots.
| Property | Values to recall |
|---|---|
| Surface temperature | ~27°C average; 22°C at 20° latitude; 14°C at 40° latitude; near 0°C at poles; ~0.5°C fall per degree |
| Hemisphere contrast | Northern ~19°C vs southern ~16°C; warmest water slightly north of the equator |
| Salinity | Normal 33–37 ppt; Atlantic ~36 ppt; Indian ~35 ppt; Pacific 31–35 ppt |
| Vertical structure | Thermocline layer 500–1,000 m; halocline = sharp salinity rise with depth |
Table 3: Do-not-forget facts.
| Fact | Value |
|---|---|
| Planetary water in oceans | 91 per cent |
| Water falling on land that returns to the atmosphere | 59 per cent |
| Brackish-water boundary | 24.7 ppt |
| Ocean volume below the thermocline | About 90 per cent |
| Word pair to keep straight | Thermocline = heat; halocline = salt |
One last check: if a number feels shaky, open the official NCERT chapter PDF (kegy212.pdf) and re-read the original table. This chapter prepares the temperature and salinity of ocean water; the next chapter explains what those waters do in motion — see the Movements of Ocean Water notes.
Reference: NCERT Class 11 Fundamentals of Physical Geography textbook, chapter Water (Oceans).
Water (Oceans) revision FAQs
Why is the Baltic Sea less salty than the Mediterranean Sea?
The Baltic Sea receives a large inflow of river water, which dilutes its salinity, while the Mediterranean Sea lies in a dry region where evaporation is high and salts concentrate (NCERT, p. 105). Same mechanism, opposite outcomes — dilution versus concentration.
What is the difference between a seamount and a guyot?
A seamount is a volcanic mountain with a pointed summit that rises from the seafloor but never reaches the surface; a guyot is a flat-topped seamount formed when the peak subsides gradually through stages (NCERT, pp. 102–103). Think pointed versus flat. The Emperor seamount is the textbook example, and the Pacific alone is estimated to hold more than 10,000 seamounts and guyots.
How do you convert salinity in parts per thousand into grams of salt in a smaller water sample?
Start from the definition: salinity in ppt is grams of salt per 1,000 g of sea water. Multiply the salinity value by the sample mass and divide by 1,000. For a 500 g sample at 35 ppt: \(35 \times 500 \div 1{,}000 = 17.5\) g of salt.
Why does temperature fall rapidly at the thermocline but not in polar oceans?
The thermocline is the transition from warm surface water to colder deep water; temperature drops quickly across it, usually beginning around 100–400 m below the surface.
In polar oceans the surface water is already near 0°C, so there is no warm layer to lose — temperature changes very little with depth and the water column stays cold from top to bottom (NCERT, pp. 103–104).
Which is the largest continental shelf in the world and where is it located?
The Siberian shelf in the Arctic Ocean is the largest in the world, stretching about 1,500 km in width (NCERT, p. 101). Most shelves average only about 80 km wide, so the Siberian value stands out sharply.
Explore Class 11 Geography Notes
- Class 11 Geography Notes
- Class 11 CBSE Notes
- CBSE Notes for Classes 1 to 12
- Previous: World Climate and Climate Change
- Next: Movements of Ocean Water
Class 11 Geography on LearnCBSE:
Related chapters:
- Geography as a Discipline notes
- The Origin and Evolution of the Earth notes
- Interior of the Earth notes