
These notes revise Chapter 5, Topographical Maps, from the NCERT Practical Work in Geography textbook for Class 11 — everything a student needs to read a Survey of India topo sheet the way a geographer does: the two map series, the five official scales, contour rules, slope types, landform signatures, the 8-step cross-section method, settlement types and site factors, and the full map-interpretation framework.
Consider this your compact set of topographical maps Class 11 notes — two worked examples and a common-mistakes table let you practise on the spot, and the one-page recap at the end is your shortest revision pass.
These notes follow the NCERT Practical Work in Geography textbook for the 2026-27 session, Chapter 5 (pages 49–68). Reference: NCERT Class 11 Geography (Practical Work in Geography) textbook, Chapter 5 — Topographical Maps. If you want to verify any sheet extract or diagram, the official PDF is on the NCERT website.
Related revision pages sit under the Class 11 notes hub, and every subject hub is gathered in the CBSE notes library.
What Is a Topographical Map? India’s Two Map Series
A topographical map (commonly called a topo map) is a general purpose map drawn at a relatively large scale that shows both natural and cultural features of an area: relief, vegetation, water bodies, cultivated land, settlements and transportation networks (NCERT, p. 49).
Because they record the terrain in detail, topo maps serve as base maps — every other map is drawn over them.
Each country’s topo maps are prepared by its National Mapping Organisation. In India that body is the Survey of India, which publishes maps for the whole country as a series; every sheet in a series uses the same reference point, scale, projection, conventional signs, symbols and colours (p. 49).
The map-as-tool idea behind this chapter starts in Chapter 1 of the book, Introduction to Maps; the Class 11 Geography notes hold the other map-reading chapters in the same series.
India’s topo maps fall into two series:
| Series | What it covers | Key fact to remember |
|---|---|---|
| India and Adjacent Countries Series | India plus adjoining countries | Prepared until the 1937 Delhi Survey Conference; afterwards adjoining countries were dropped, but the numbering system and layout plan of the old series were retained (p. 50) |
| International Map Series of the World | The entire world | Standardised maps at 1:10,00,000 and 1:250,000 scales (p. 50) |
Survey of India Scales and Sheet Coverage
The Survey of India prepares topo sheets at five scales. Each scale covers a fixed block of latitude and longitude, and the coverage shrinks as the scale denominator shrinks (NCERT, p. 50):
| Representative fraction (R.F.) | Latitudinal × longitudinal coverage | Map series |
|---|---|---|
| 1 : 10,00,000 | \( 4^\circ \times 4^\circ \) | International Map Series of the World |
| 1 : 250,000 | \( 1^\circ \times 1^\circ \) | International Map Series of the World |
| 1 : 1,25,000 | \( 30′ \times 30′ \) | Survey of India topographical series |
| 1 : 50,000 | \( 15′ \times 15′ \) | Survey of India topographical series |
| 1 : 25,000 | \( 5′ \times 7′ 30” \) | Survey of India topographical series |
Read the table this way: the larger the R.F. denominator, the smaller the map’s scale and the bigger the area a single sheet covers. One 1:10,00,000 sheet spans \( 4^\circ \) of latitude and \( 4^\circ \) of longitude, while a 1:25,000 sheet spans only \( 5′ \times 7’30” \) (minutes and seconds of arc).
Note that the first two scales are the International Map Series scales; the other three carry India’s own topo series.
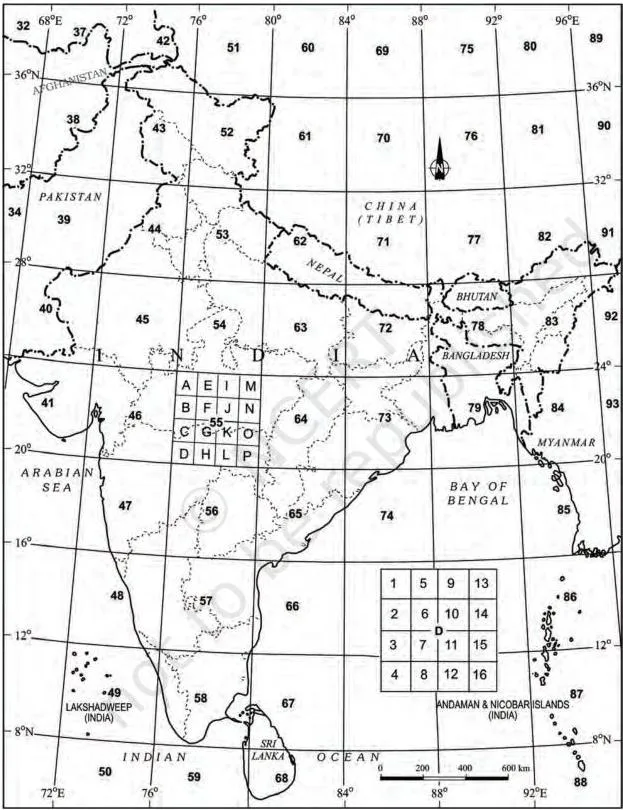
Figure 5.1 is the index that ties the five scales together — the textbook states that the numbering system of each of the five maps is shown here.
Use it to see how sheets at different scales relate to one another; when a question gives a sheet number such as 63K/12, an index like this locates the sheet within the national grid and identifies its scale.
You also need one conversion rule for every scale question:
- Ground distance = map distance \( \times \) R.F. denominator
- R.F. = map distance \( \div \) ground distance (both in the same units)
- 1 km = 1,00,000 cm (so 1 m = 100 cm)
Fully worked conversions appear in the worked examples section below; the map projection and scale notes develop R.F. conversion problems further.
Contour Vocabulary: Key Terms at a Glance
Seven terms carry almost every topo-map question. Memorise the pair contour interval and horizontal equivalent first — the whole chapter builds on it (NCERT, pp. 50 and 53):
| Term | Meaning | Note / example |
|---|---|---|
| Topographic map | Map of a small area drawn on a large scale, showing detailed natural and man-made features | Relief is shown by contours (p. 50) |
| Contours | Imaginary lines joining all points of equal elevation above mean sea level | Also called “level lines” (p. 50) |
| Contour interval (V.I.) | Vertical interval between two successive contours | Constant for a given map; commonly 20, 50 or 100 m (p. 53) |
| Horizontal equivalent (H.E.) | Horizontal distance between two successive contours | Large on gentle slopes; decreases as the slope steepens (p. 53) |
| Cross-section | Side view of the ground cut vertically along a straight line | Also called a section or profile (p. 50) |
| Hachures | Small straight lines drawn along the direction of maximum slope, running across the contours | Give an idea of differences in slope (p. 50) |
| Bench marks and spot heights | Point elevations marked directly on the map | Contours and spot heights are the predominant relief method on topo maps (p. 52) |
Contours: The Rules Behind Every Relief Map
Every contour map obeys five basic rules (NCERT, p. 53):
- A contour line joins places of equal height.
- The shape of contour lines represents the height and the slope or gradient of the landform.
- Closely spaced contours = steep slope; widely spaced = gentle slope.
- Two or more contours that merge represent vertical slopes — cliffs or waterfalls.
- Two contours of different elevation usually do not cross.
Why the rules hold: two different elevations cannot occupy one point on the ground, so differently valued contours cannot cross — the exception is a vertical face, where the flat map collapses the contours into one merged line.
And because the vertical interval is constant on a given map while the horizontal equivalent varies with the slope, spacing becomes the map’s visual language for steepness.
Two process facts worth keeping: contours were once drawn by ground surveys and levelling, but aerial photography has replaced those conventional methods (p. 53) — a thread that continues in Chapter 6 of this book, Introduction to Aerial Photographs.
The chapter also lists the other relief methods — hachures, hill shading, layer tints, bench marks and spot heights — but on topo maps, contours and spot heights predominate (p. 52).
Slope Types and Their Contour Spacing
Slopes are classified as gentle, steep, concave, convex and irregular or undulating (NCERT, p. 54). The single reading habit that saves most errors: read any slope from lower ground upward.
| Slope type | Contour spacing | Clue on the map |
|---|---|---|
| Gentle | Contours far apart | Low angle of slope (p. 54) |
| Steep | Contours close together | High angle of slope (p. 54) |
| Concave | Widely spaced in the lower parts, closely spaced in the upper parts | Gentle at the bottom, steep at the top (p. 55) |
| Convex | Widely spaced in the upper parts, closely spaced in the lower parts | Gentle at the top, steep at the bottom (p. 55) |
| Irregular / undulating | No single spacing pattern dominates | Mixed slope behaviour (p. 54) |
The textbook sets gentle and steep side by side (p. 54) and concave against convex (p. 55); sketch each pair once from the book and you will recognise the patterns instantly on any sheet.
Conical Hill and Plateau: Reading Closed Contours
Both features are drawn as closed, concentric contours; the difference is what happens at the top (NCERT, p. 56):
| Feature | Contour signature | Identifying clue |
|---|---|---|
| Conical hill | Concentric contours spaced at almost regular intervals | Rises almost uniformly from the surrounding land; narrow top |
| Plateau | Contours close spaced at the margins; the innermost contour shows a wide gap between its two sides | Widely stretched flat-topped high land with relatively steeper slopes rising above the adjoining plain or sea |
In short, a hill narrows to a point while a plateau flattens into a broad summit — and the contour signature tells you which one you are looking at in a single glance.
Valleys, Spurs, Gorges, Cliffs and Waterfalls
These are the open-contour landforms — learn each as a pair: one line of formation, one line of contour signature (NCERT, pp. 57–59):
| Landform | Formation | Contour signature |
|---|---|---|
| V-shaped valley | River valley in mountainous areas | Innermost contour has the smallest gap and the lowest value; values rise outward at uniform intervals (p. 57) |
| U-shaped valley | Strong lateral erosion by glaciers at high altitudes | Flat wide bottom and steep sides; innermost contour has a wide gap; values rise outward (p. 57) |
| Gorge | Vertical erosion by the river dominates at high altitudes | Deep, narrow valley with very steep sides; very closely spaced contours with a small innermost gap (p. 58) |
| Spur | A tongue of land projecting from higher ground into lower ground | V-shaped contours in reverse: the arms of the V point to higher ground, the apex to lower ground (p. 58) |
| Cliff | Very steep or almost perpendicular face of landform | Contours run very close and finally merge into one (p. 59) |
| Waterfall | Sudden, near-perpendicular descent of river water | Contours merge into one another while crossing the river stream (p. 59) |
| Rapids | Cascading stream upstream or downstream of a waterfall | Relatively distant contour lines (p. 59) |
Memory device: “Valley V points up, Spur V points down.” The textbook reasoning: in a spur the arms of the V point to higher ground and the apex to lower ground; in a V-shaped valley the innermost contour carries the lowest value.
So when two V-shaped patterns face each other across a ridge, the contour values — not just the shapes — settle the identification. Reversing these two Vs is the most common error in the chapter; always confirm with the values.
Drawing a Cross-section From Contours in 8 Steps
A cross-section is the side view of the ground cut vertically along a straight line — the “section or profile” of the glossary (NCERT, p. 50). Draw one on any contour map in eight steps (p. 60):
- Draw a straight line cutting across the contours and label it AB.
- Place the edge of a strip of white paper or graph paper along AB.
- Mark the position and value of every contour that cuts AB.
- Choose a suitable vertical scale (e.g. \( \frac{1}{2}\,\text{cm} = 100\,\text{m} \)) and draw horizontal lines parallel to AB, equal to its length, one for each contour value (or more).
- Number the horizontal lines from the lowest contour value upward.
- Lay the marked strip along the bottom line of the cross-section so its AB matches the map’s AB, and mark the contour points.
- Drop perpendiculars from the AB points down to the corresponding level lines at the cross-section base.
- Join all the marked points with a smooth curve.
Cross-check your finished profile: it must rise where contours are close together and flatten where they are far apart. If it does the opposite, the vertical scale or the numbering is wrong.
Settlements, Transport and Site Factors
Settlements, buildings, roads and railways are the main cultural features on a topo sheet, shown through conventional signs, symbols and colours (NCERT, p. 60). Study a settlement through four attributes — site, location pattern, alignment and density — and always compare the settlement layer with the contour map (p. 60). The textbook lists these settlement types:
| Rural settlements | Urban settlements |
|---|---|
| Compact | Cross-road town |
| Scattered | Nodal point |
| Linear | Market centre |
| Circular | Hill station |
| Coastal resort centre | |
| Port | |
| Manufacturing centre with suburban villages or satellite towns | |
| Capital town | |
| Religious centre |
Three of these carry special pattern descriptions (p. 61): linear settlements spread along a river valley, road, embankment or coastline; a cross-road town is fan-shaped, with the road crossing at its heart as the main market place; and a nodal town has roads radiating in all directions. The remaining types are identified by function from the symbols around them.
Five factors decide the site of a settlement (p. 61), and each one shows up as concrete map evidence:
| Site factor | What it supplies | Map evidence to look for |
|---|---|---|
| Source of water | Drinking, domestic and irrigation needs | Drainage lines, tanks, wells |
| Provision of food | Sustenance for the population | Cultivated land around the settlement |
| Nature of relief | Suitable, buildable ground | Contour spacing and values |
| Nature and character of occupation | The economic base of the people | Land-use type and settlement form |
| Defence | Protection from attack | Elevated or hilltop position |
Examine any settlement site with reference to the contour and drainage map together — the textbook makes this comparison a rule (p. 61). Also remember the direct link: density of settlement is directly related to food supply.
Transport and communication: relief, population, size and resource development of an area directly influence the means of transport and their density (p. 61). Recognise the conventional signs for highways, district roads, cart tracks, camel tracks, footpaths, railways, waterways and post offices (pp. 61, 63).
Interpreting a Topo Sheet: Five Heads and Four Steps
Reading a topo sheet needs two things first: the northline (to orient yourself) and the scale, plus a thorough knowledge of the legend (NCERT, p. 62). Every sheet carries a table of conventional signs — and those signs are internationally accepted, so anyone can read any map anywhere in the world without knowing the language of that country. That table is Figure 5.2:
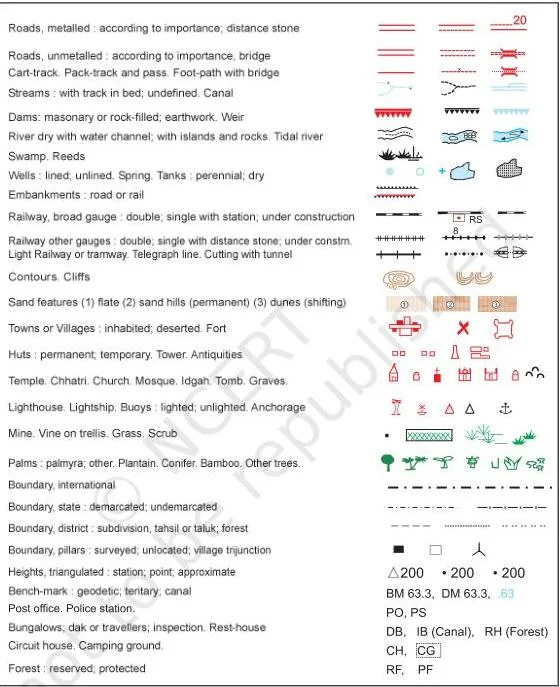
Keep Figure 5.2 open while you practise the exercise on drawing conventional signs (international boundary, bench mark, villages, metalled roads, footpaths with bridges, places of worship, railway lines) — the symbols in this table are the ones that exercise expects.
A topographic sheet is interpreted under five heads (p. 62):
- Marginal information — sheet number, location, grid references, extent in degrees and minutes, scale, districts covered.
- Relief and drainage — hills, plateaus, plains, mountains (with peaks, ridges, spurs and the general direction of slope); rivers, tributaries and valleys; drainage patterns such as dendritic, radial, ring, trellis and internal.
- Land use — natural vegetation and forest (dense or thin; Reserved, Protected, Classified/Unclassified categories), agriculture, orchard, wasteland, industrial land; facilities and services such as schools, hospitals, parks, airports and electric substations.
- Transport and communication — highways, district roads, cart tracks, camel tracks, footpaths, railways, waterways, communication lines and post offices.
- Human settlement — rural settlements (compact, semi-compact, dispersed, linear) and urban settlements by function; occupation is inferred from land use and settlement type: agriculture in rural areas, lumbering and primitive agriculture in tribal regions, fishing in coastal areas, and services and business in cities (p. 63).
The textbook’s own procedure for interpreting a sheet has four steps (pp. 63–64). Merging the five heads with those four steps gives a single six-step reading routine for any topo sheet:
- Orient — locate the northline, note the scale, study the legend.
- Marginal information — read the sheet number, grid references, extent and districts.
- General landform — from the index number fix the area’s location in India; from the scale and contour interval fix its extent and general landform.
- Trace the four layers — landforms, drainage and water features, land use, and settlement plus transport pattern, each on a separate tracing sheet.
- Describe — describe the distributional pattern of each layer separately, drawing attention to its most important aspect.
- Superimpose and relate — place pairs of tracings over each other and note the relationship; for example, a contour map superimposed over a land-use map reveals the relationship between the degree of slope and the type of land used. Aerial photographs or satellite imageries of the same area and scale can be compared with the sheet to update the information (p. 64).
Finally, map interpretation itself means the study of factors that explain the causal relationship among features: natural vegetation and cultivated land are understood against the background of landform and drainage, and settlements are examined in association with the transport network and the nature of topography (p. 63).
Worked Examples: Scale Conversion and Contour Reading
Example 1: Convert R.F. 1:25,000 into a statement of scale and a ground distance
Method: R.F.-to-statement conversion — read the fraction as a ratio, convert the unit, then restate.
- Step 1: State the meaning of the R.F.: \( 1\,\text{cm} \) on the map = \( 25{,}000\,\text{cm} \) on the ground.
- Step 2: Convert centimetres to metres, using \( 100\,\text{cm} = 1\,\text{m} \): \( 25{,}000 \div 100 = 250\,\text{m} \).
- Step 3: Write the statement of scale: \( 1\,\text{cm} \) represents \( 250\,\text{m} \) (equivalently \( 4\,\text{cm} = 1\,\text{km} \)).
- Step 4: Convert a sample map distance: \( 5\,\text{cm} \times 250\,\text{m/cm} = 1{,}250\,\text{m} = 1.25\,\text{km} \).
Final answer: Statement of scale — \( 1\,\text{cm} = 250\,\text{m} \); a 5 cm map distance is 1.25 km on the ground.
Exercise B question 1 asks for the same conversion at R.F. 1:50,000 — the identical three steps (meaning, divide by 100, statement) apply without memorising anything.
Example 2: Find the contour interval and classify slopes from labelled contours
Contour values on a sheet: \( 300, 350, 400, 450, 500 \) metres.
Method: contour-interval and slope classification — subtract successive values for the interval, then use spacing for the slope.
Step 1: Subtract successive values: \( 350 – 300 = 50\,\text{m} \).
Check the next pair: \( 400 – 350 = 50\,\text{m} \) — same result.
- Step 1: State the contour interval: \( 50\,\text{m} \).
- Step 2: Read slope from spacing: contours \( 2\,\text{mm} \) apart indicate a steep slope; contours \( 8\,\text{mm} \) apart indicate a gentle slope.
Close = steep, wide = gentle, every time.
Step 4: Classify a closed feature: concentric contours spaced at almost regular intervals with values rising inward and a narrow top — that is a conical hill.
Final answer: Contour interval = 50 m; 2 mm spacing = steep slope, 8 mm spacing = gentle slope; the closed set of contours is a conical hill.
Common Mistakes When Reading Topo Sheets
| Mistake | Correct rule | How to check your answer |
|---|---|---|
| Stopping at “1 cm = 25,000 cm” | Continue the conversion — a statement of scale is expected in readable units such as metres or kilometres (1 km = 1,00,000 cm). | Your statement names a real unit (m or km), not just cm. |
| Reading concave and convex slopes from top to bottom | Read from lower ground upward: concave = gentle bottom, steep top; convex = steep bottom, gentle top. | Name which end is gentle first — bottom for concave, top for convex. |
| Treating “contours never cross” as absolute | Contours of different elevations do not cross, but contours merge into one line at vertical features such as cliffs and waterfalls. | Scan for merged lines before applying the no-crossing rule. |
| Calling a spur a valley because both form V’s | In a spur the arms of the V point to higher ground and the apex to lower ground; in a V-shaped valley the innermost contour carries the lowest value. | Read the contour values on both sides before naming the feature. |
| Expecting the contour interval to vary across a map | The vertical interval is constant on a given map; it is the horizontal equivalent that changes with the slope. | Subtract successive contour values in two different parts of the sheet — the interval matches. |
| Quoting hachures or hill shading for relief on a topo sheet | Topo maps predominantly use contours and spot heights for relief. | Name the relief method the sheet actually prints. |
Exam Notes: How to Write the Exercise Answers
This section is answer-shaping strategy for the textbook’s own exercises; the final answers to those exercises are not listed here.
About-30-words questions (what are topographical maps, which organisation prepares them, the common scales used by the Survey of India, what contours are, what contour spacing indicates, what conventional signs are): use the response formula one-line definition + one supporting fact. A definition followed by an example or a function is more complete than a definition alone.
Short notes (Contours; Marginal Information in Topographical Sheets; The Survey of India): use a 3–4 point structure — define the term, give its key facts, then one example or function. For Marginal Information, the natural points are what it is, the items it contains (sheet number, grid references, extent, scale, districts), and why it matters for locating the sheet.
“Map interpretation”: open with the definition — the study of factors that explain the causal relationship among features (p. 63). Then give the procedure: locate the area from the index number, note scale and contour interval, trace the four feature layers, and superimpose pairs to find relationships.
Cultural features from a topo sheet: state what information you would seek — site, pattern, density, alignment and occupation — and how you would derive it: by comparing the settlement layer with the contour and drainage maps (p. 61). Support with examples such as linear settlements along a road or river, or a hilltop site chosen for defence.
The three exercise formats each target a different skill. Exercise A is pure contour-pattern work: naming features, finding the contour interval, converting map distance to ground distance, naming slope types, and giving directions. Exercises B and C use extracts of sheet 63K/12 (Mirzapur–Varanasi districts) at R.F.
1:50,000 and test real sheet reading: scale conversion, direction of river flow, settlement pattern and type, the meaning of map colours, the bank of a river on which a village lies, and locating features in a named quarter of the map.
One-page Revision Recap
Night-before pass — read this block and you have the chapter (NCERT, pp. 49–64):
| Topic | What to recall |
|---|---|
| Definition | Topo maps = general purpose maps at relatively large scales showing relief, vegetation, water bodies, cultivated land, settlements and transport; they serve as base maps (p. 49). |
| Two series | India and Adjacent Countries Series; International Map Series of the World (1:10,00,000 and 1:250,000) (pp. 49–50). |
| Five scales | 1:10,00,000 — \( 4^\circ \times 4^\circ \); 1:250,000 — \( 1^\circ \times 1^\circ \); 1:1,25,000 — \( 30′ \times 30′ \); 1:50,000 — \( 15′ \times 15′ \); 1:25,000 — \( 5′ \times 7’30” \) (p. 50). |
| Five contour rules | Equal-height lines; shapes show height and slope; close = steep, wide = gentle; merged = cliff or waterfall; different-elevation contours usually do not cross (p. 53). |
| Five slope types | Gentle, steep, concave, convex, irregular — always read from lower ground upward (pp. 54–55). |
| Landform signatures | Conical hill: even concentric circles. Plateau: close-spaced margins, wide inner gap. V-valley: values rise outward. Spur: V apex points to lower ground. Cliff and waterfall: merged contours. Gorge: very close contours, small inner gap (pp. 56–59). |
| Five heads of interpretation | Marginal information; relief and drainage; land use; transport and communication; human settlement (p. 62). |
| Interpretation procedure | Orient → marginal information → scale and contour interval → trace four layers → describe patterns → superimpose pairs for causal relations (pp. 63–64). |
| One conversion rule | Ground distance = map distance × R.F. denominator; 1 km = 1,00,000 cm. |
| Relief method on topo sheets | Contours and spot heights predominate (p. 52). |
Frequently Asked Questions
What is the difference between contour interval and horizontal equivalent?
Contour interval (V.I.) is the vertical distance between two successive contours — it is constant for a given map, commonly 20, 50 or 100 m. Horizontal equivalent (H.E.) is the horizontal distance between two successive contours — it is large on gentle slopes and small on steep ones (NCERT, p. 53). So V.I. measures height and stays fixed, while H.E.
measures spacing and changes with the slope.
How do V-shaped contours help me identify a valley and a spur?
Both features draw V-shaped contours, so you must read the values. In a spur, the arms of the V point to higher ground and the apex to lower ground (p. 58). In a V-shaped valley, the innermost contour carries the lowest value and the values rise outward at uniform intervals (p. 57).
Remember “Valley V points up, Spur V points down” — then confirm with the numbers.
How do I convert a representative fraction into a statement of scale?
Three steps. Take \( 1 : 25{,}000 \): first read the meaning — \( 1\,\text{cm} \) on the map = \( 25{,}000\,\text{cm} \) on the ground; then convert to metres by dividing by 100 to get \( 250\,\text{m} \); finally state it as “1 cm represents 250 m” (or 4 cm = 1 km). The identical steps work for any R.F.
Why do contour lines merge on a topographical map?
Merged contours represent vertical or near-vertical slopes, where the ground surface appears as a single line in map view — the textbook names cliffs and waterfalls (pp. 53, 59). The face is so steep that the contour lines collapse into one. This is the exception to the rule that contours of different elevation do not cross.
What information is given in the marginal information of a topo sheet?
Marginal information includes the topographical sheet number, its location, grid references, its extent in degrees and minutes, the scale, and the districts covered (NCERT, p. 62). It is the first place to look when you need to locate the sheet within India.
Which slopes do contours show, and how does spacing change for each?
Contours show five slope types (NCERT, pp. 54–55): gentle (far apart), steep (close together), concave (wide at the bottom, close at the top), convex (wide at the top, close at the bottom), and irregular or undulating (no regular pattern). Always read slopes from lower ground upward to keep concave and convex straight.
Reference: NCERT Class 11 Geography (Practical Work in Geography) textbook, Chapter 5 — Topographical Maps.
Explore Class 11 Geography Notes
- Class 11 Geography Notes
- Class 11 CBSE Notes
- CBSE Notes for Classes 9 to 12
- Previous: Map Projections
Class 11 Geography on LearnCBSE: