
Sectors of the Indian Economy Class 10 is Chapter 2 of the NCERT Understanding Economic Development textbook, one of the Class 10 Social Science books. The official NCERT Class 10 Economics Chapter 2 PDF is available free below, hosted by NCERT on ncert.nic.in, and this page is maintained for the 2026-27 session. What follows explains what the chapter actually contains, section by section.
Download the NCERT Class 10 Economics Chapter 2 PDF
The NCERT Class 10 Economics Chapter 2 Sectors of the Indian Economy PDF below is the official government file, identical to the printed NCERT book, with no login or payment required. Keep it saved for revision — the page numbers quoted on this page refer to this same official edition.
| What the chapter holds | Count | Where it is used |
|---|---|---|
| Printed pages | 20 | |
| Figures with NCERT captions | 10 | |
| Tables | 7 | |
| Exercise questions | 23 | answered in our NCERT Solutions |
| Official NCERT PDF | Download the chapter PDF | the chapter exactly as NCERT publishes it |
Chapter 2 at a glance
The table below summarises what is inside the chapter — its sections, figures and exercises — so you can see at once how much of it there is and what to expect.
What this chapter covers: three ways to classify an economy
Economists make sense of the economy by sorting its activities into groups called sectors, and the whole chapter is built on three such classifications (NCERT, p. 18). Each uses a different test, so keep the three criteria separate:
- By the nature of the activity — primary, secondary and tertiary sectors (the chapter’s core, NCERT pp. 19–21).
- By employment conditions — organised and unorganised sectors (NCERT, p. 30).
- By ownership of assets — public and private sectors (NCERT, p. 33).
Classification is not an end in itself. Once the groups exist, the chapter uses them to analyse which sector produces the most, which employs the most people, and what problems — like underemployment — follow. It also stresses that the roles of sectors change over time, above all the rapid growth of the service sector.
The three sectors: primary, secondary and tertiary
This first classification sorts work by what is actually done with nature’s resources. The test is simple: does the activity take a natural product, change a natural product, or support other activities?
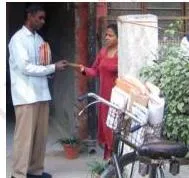
The photograph spread above shows ordinary people already at work in all three kinds of activity — some producing goods, some producing services (NCERT, p. 19). Here is each sector in the chapter’s own terms:
- Primary sector — produces goods by exploiting natural resources: agriculture, dairy, fishing, forestry and mining. Cotton, milk and minerals are natural products, and this sector is also called the agriculture and related sector (NCERT, p. 19).
- Secondary sector — changes natural products into other forms through manufacturing, in a factory, workshop or home: cotton fibre into yarn and cloth, sugarcane into sugar or gur, earth into bricks. It is also called the industrial sector (NCERT, pp. 19–20).
- Tertiary sector — provides services that support the other two — transport, storage, communication, banking, trade — plus essential services like teaching and health care. It is also called the service sector (NCERT, p. 20).
The three sectors are not independent boxes. They are highly interdependent (NCERT, p. 21): if farmers refuse to sell sugarcane to a sugar mill, the mill must shut down; if transporters strike, vegetables and milk stop reaching cities and farmers cannot sell their produce. Table 2.1 of the chapter builds this point with examples like these.
Final goods, intermediate goods and GDP: how production is counted
The chapter then asks a practical question: with thousands of goods and services produced, how do we add up an economy? Economists use money values, because adding cars, computers and nails by counting pieces makes no sense (NCERT, p. 22). One precaution matters: only final goods and services are counted.
Consider a mango chain with fresh numbers to see why. A farmer sells 1,000 kg of mangoes at Rs 30 per kg to a pulp maker. The pulp maker sells the pulp to a juice company, and the company sells packaged juice to consumers.
| Stage | Good produced | Value |
|---|---|---|
| Farmer sells 1,000 kg mangoes (Rs 30 per kg) to a pulp maker | Mangoes — intermediate good | Rs 30,000 |
| Pulp maker sells mango pulp to a juice company | Pulp — intermediate good | Rs 45,000 |
| Juice company sells packaged juice to consumers | Juice — final good | Rs 75,000 |
Mangoes and pulp are intermediate goods because they are used up in making the final good. The juice sold for Rs 75,000 already contains the value of the pulp (Rs 45,000) and the mangoes (Rs 30,000). If we added all three stages — Rs 30,000 + Rs 45,000 + Rs 75,000 = Rs 1,50,000 — the mangoes would be counted three times over.
That error is double counting, and it is why the chapter insists that final goods alone enter the total (NCERT, p. 22).
The value of all final goods and services produced in each sector during a year is that sector’s total production; the sum across sectors is the Gross Domestic Product (GDP) — the value of all final goods and services produced within a country during a particular year (NCERT, p. 23). GDP shows how big an economy is.
The chapter adds that India now reports sectoral production as Gross Value Added (GVA) — the contribution of the three sectors adjusted for taxes and subsidies — to match global practice (NCERT, p. 23).
Underemployment and the search for more jobs
The chapter’s graphs, read in detail below, show a puzzle: the primary sector produces only about one-sixth of India’s GVA but still employs more than half of all workers (NCERT, p. 25). That is the starting point for underemployment.
Meet Laxmi, a small farmer with about two hectares of unirrigated land who depends only on rain (NCERT, p. 26). All five members of her family work on the plot the whole year — no one sits idle. Yet if a landlord hires one or two of them away, farm output does not fall.
Everyone is busy, but each person works below their potential. This is disguised unemployment, also called underemployment: it is hidden, unlike the clear case of a person with no job at all.

The photograph at NCERT page 26 makes the point that underemployment is not only rural. Thousands of casual workers in cities — painters, plumbers, repair persons — do not find work every day, and street vendors may spend the whole day yet earn very little, simply because no better opportunity exists.
How can employment be created? The chapter recommends a package of measures (NCERT, pp. 27–29):
- Irrigation — a well, a dam, canals; an irrigated Laxmi can take a second wheat crop in the rabi season, and one hectare of wheat can employ two people for 50 days (NCERT, p. 27).
- Transport and storage — rural roads, mini-trucks and godowns so produce can reach nearby towns and be sold at good prices.
- Cheap agricultural credit — bank loans at reasonable interest instead of moneylenders’ high rates; this connects to Chapter 3, Money and Credit.
- Agro-processing in semi-rural areas — dal mills for pulses, cold storage for potatoes and onions, honey collection centres, and vegetable and fruit processing units.
- Education and health jobs — more school buildings, teachers, doctors and nurses; a Planning Commission (now NITI Aayog) study estimated about 20 lakh jobs in education alone and more than 35 lakh additional jobs a year from tourism.
- A short-term Right to Work — a law guaranteed 100 days of employment a year to rural people who need it, in about 625 districts, with an unemployment allowance if the government failed to provide work.

The photograph of gur making in Haryana (NCERT, p. 28) shows exactly the kind of processing work the chapter wants placed in semi-rural areas — sugarcane is converted into gur near where it is grown, instead of in a distant city factory.
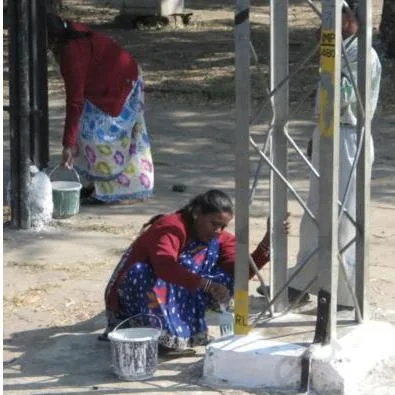
The Right to Work law was Mahatma Gandhi National Rural Employment Guarantee Act 2005 (MGNREGA 2005); in 2025 it was replaced by Viksit Bharat-Guarantee for Rozgar and Ajeevika Mission (Viksit Bharat-G RAM G 2025) (NCERT, p. 29). The photograph on that page underlines the chapter’s warning: some suggestions take a long time, so a quick, guaranteed measure was needed in the short term.
Organised and unorganised sectors: Kanta versus Kamal
This second classification ignores what work is done and asks how people are employed — whether the work is regular, secure and covered by rules. Two neighbours show the contrast (NCERT, p. 30).
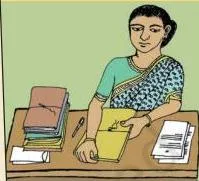
Kanta works in an office from 9.30 a.m. to 5.30 p.m. She gets her salary monthly, plus provident fund and medical allowances. Sundays are paid holidays, and she received an appointment letter stating all her terms of work when she joined.
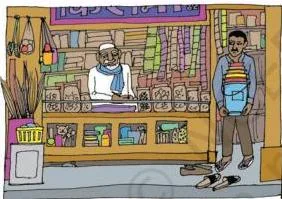
Kamal, her neighbour, works as a daily wage labourer in a grocery shop from 7.30 a.m. to 8.00 p.m. He gets only his wages — no allowances, no leave, no paid holidays, no appointment letter — and he can be asked to leave any day. The table below sets the two side by side:
| Aspect | Kanta (organised sector) | Kamal (unorganised sector) |
|---|---|---|
| Working hours | Fixed, 9.30 a.m. to 5.30 p.m.; overtime paid if longer | Long, 7.30 a.m. to 8.00 p.m.; no overtime provision |
| Wages and allowances | Regular monthly salary plus medical and other allowances | Daily wages only, no allowances |
| Leave | Paid holidays and leave | No leave or paid holidays; unpaid for days not worked |
| Job security | Secure; employs a formal appointment letter | Can be asked to leave anytime, without reason |
| Social security benefits | Provident fund, gratuity, pension | None |
From the two stories the chapter generalises (NCERT, pp. 30–31). The organised sector covers registered enterprises that must follow government rules — laws such as the Factories Act, Minimum Wages Act, Payment of Gratuity Act and Shops and Establishments Act — and its workers get secure jobs, fixed hours, overtime pay, paid leave, provident fund, medical benefits and pensions.
The unorganised sector is made up of small, scattered units largely outside government control, where pay is low and irregular, benefits are absent, and jobs can end without reason. Farmers hiring labourers as needed and people selling on the street also belong here.
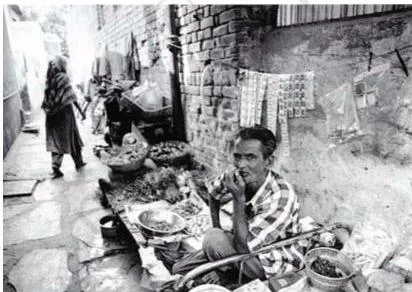
Protection matters because most Indian workers are in this sector (NCERT, p. 32). Nearly 80 per cent of rural households are small and marginal farmers, who need timely seeds, agricultural inputs, credit, storage and marketing outlets. Urban casual workers — street vendors, headload workers, garment makers, rag pickers, construction and transport workers — need protection too.
The chapter adds that a majority of workers from scheduled castes, tribes and backward communities work in the unorganised sector and face social discrimination on top of low, irregular pay.
Public and private sectors: who owns and who serves
The third classification uses ownership. In the public sector the government owns most assets and delivers services; in the private sector, individuals or companies own assets and run services (NCERT, p. 33). Railways and the post office are public; TISCO and Reliance are private.
Private activity is guided by the profit motive. Public activity exists to serve, and the chapter lists three jobs the government must do (NCERT, pp. 33–34):
- Provide what the private sector will not supply at reasonable cost — roads, bridges, railways, harbours, dams and electricity generation. The sums are huge, collecting payment from millions of users is hard, and private firms would charge high rates.
- Support activities that need help — supplying electricity at rates small industries can afford, and buying wheat and rice from farmers at a fair price to sell cheaper through ration shops. The government bears part of the cost.
- Take primary responsibility for health and education — plus safe drinking water, housing, food and nutrition, and increased spending on the poorest regions of the country.
Reading the chapter’s figures and graphs
Three graphs carry the chapter’s data story. Before answering the questions on NCERT page 24, read the story each graph tells, in order.
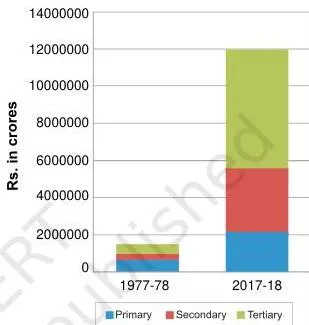
Graph 1 (NCERT, p. 24) shows production of goods and services by the three sectors for 1977–78 and 2026-27, roughly forty years apart. All three sectors grew, but the tertiary sector grew most, so by 2026-27 it had replaced the primary sector as the largest producing sector. The two years are used because their data are comparable and authentic.
Your job with this graph: read the largest producing sector in each year, and identify which sector grew most.
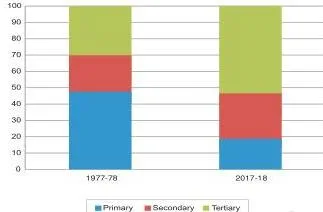
Graph 2 (NCERT, p. 25) gives the percentage share of each sector in GVA, so the changing importance of the sectors over the forty years can be seen directly. The primary sector’s share falls; the tertiary sector’s share rises.
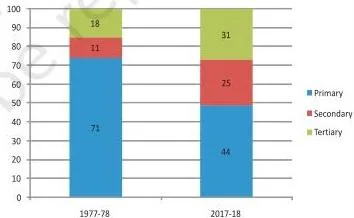
Graph 3 (NCERT, p. 25) carries the surprise: the share of employment did not shift the same way. The primary sector continues to be the largest employer even today. The chapter explains why: not enough jobs were created in the secondary and tertiary sectors.
Industrial output rose more than nine times while industrial employment rose only about three times; service production rose about fourteen times while service employment rose about five times (NCERT, p. 25).
Put together, the graphs say this: more than half of India’s workers are in the primary sector, mainly agriculture, producing only about one-sixth of GVA — which is the basis of the underemployment discussion. The data sources are the Economic Survey for GVA and the five-yearly employment surveys of the NSSO, now known as the NSO (NCERT, p. 18).
For exact rupee values and percentages, read them from the graph bars themselves — the chapter’s questions on page 24 ask you to do exactly that.
Definitions at a glance
Here is every key term in one place, with the page where the chapter defines it. Learn the term and its criterion together, not separately.
| Term | Meaning |
|---|---|
| Primary sector | Activities that produce goods by exploiting natural resources — agriculture, dairy, fishing, forestry, mining (NCERT, p. 19) |
| Secondary sector | Activities that change natural products into other forms through manufacturing, in a factory, workshop or home (NCERT, p. 19) |
| Tertiary sector | Activities that support the primary and secondary sectors — transport, storage, communication, banking, trade — plus services like teaching and health care (NCERT, p. 20) |
| Final goods | Goods that reach consumers; their value already includes all intermediate goods used to make them (NCERT, p. 22) |
| Intermediate goods | Goods used up in producing final goods and services (NCERT, p. 22) |
| GDP | The value of all final goods and services produced within a country during a particular year (NCERT, p. 23) |
| GVA | The contribution of the three sectors to production after adjusting for taxes and subsidies (NCERT, p. 23) |
| Disguised unemployment | Underemployment where people appear to work but each works less than their potential, hidden from view (NCERT, p. 26) |
| Organised sector | Registered enterprises that follow government rules; employment is regular and secure with benefits (NCERT, p. 30) |
| Unorganised sector | Small, scattered units largely outside government control; low, irregular pay and no job security (NCERT, p. 31) |
| Public sector | The government owns most assets and delivers services (NCERT, p. 33) |
| Private sector | Private individuals or companies own assets and deliver services, guided by the profit motive (NCERT, p. 33) |
Common mistakes students make in this chapter
These are the errors this chapter most often produces in answers. Each row pairs the mistake with the rule that fixes it.
| Mistake | Correct rule | How to check your answer |
|---|---|---|
| Counting intermediate goods along with final goods when estimating GDP | Only final goods and services are counted; their value already includes all intermediate goods (NCERT, p. 22) | Ask: does this good reach a consumer? If it is used up in making something else, leave it out |
| Thinking underemployment means sitting idle | In disguised unemployment everyone looks busy, but each person works below their potential — like Laxmi’s family (NCERT, p. 26) | Ask: would output fall if some workers moved away? If not, they are underemployed |
| Saying the tertiary sector employs the most Indians | Tertiary produces the most GVA, but the primary sector still employs more than half of all workers (NCERT, p. 25) | Keep production (GVA) and employment in separate sentences in your answer |
| Calling every small workplace unorganised | The test is employment conditions and government registration, not the size of the workplace (NCERT, p. 31) | Ask: is the enterprise registered and are rules followed? |
| Assuming the public sector exists to earn profit | Its purpose is to provide services the private sector will not supply at reasonable cost (NCERT, p. 33) | Ask: who benefits — the public or shareholders? |
| Treating the three sectors as independent | Sectors are highly interdependent — each depends on the others for inputs, services and customers (NCERT, p. 21) | For any activity, ask: what does it need from the other two sectors? |
How the chapter’s exercises test these ideas
The chapter’s own questions keep returning to five skills (NCERT, pp. 21–37). Practise these and you cover the whole chapter. One caution: textbook contents and the examinable syllabus are not always identical, so check the current official CBSE syllabus as well.
- Classify occupations into sectors — tailor, potter, fisherman, call centre employee and more (LET’S WORK THESE OUT, p. 21; odd-one-out Exercise 4, p. 36).
- Read graphs and complete tables — the share of primary sector in GVA and employment from Graphs 2 and 3 (p. 27), and Exercise 24’s GVA table for 2001–02 and 2026-27 (p. 37).
- Match farming problems to government measures — Exercise 3, p. 35, pairs each problem with a possible measure:
| Farming problem | Government measure |
|---|---|
| Unirrigated land | Construction of canals by the government (d) |
| Low prices for crops | Procurement of food grains by the government (c) |
| Debt burden | Banks providing credit at low interest (e) |
| No job in the off season | Setting up agro-based mills (a) |
| Compelled to sell grains cheaply to local traders after harvest | Cooperative marketing societies (b) |
- Compare and contrast — organised versus unorganised working conditions (pp. 31, 36) and private versus public activities (p. 36).
- Turn data into a table and interpret it — Exercise 23’s Ahmedabad data, where 11,00,000 of 15,00,000 workers were in the unorganised sector (p. 37).
For a complete answer on compare questions, state the criterion first — for example, “organised and unorganised sectors differ in their conditions of employment” — then give concrete differences with detail: hours, pay, security, benefits — and end with one conclusion.
In data questions, always name the sector a number belongs to, and read the exact value off the graph or table before writing it.
What to remember from this chapter
The chapter closes with SUMMING UP (NCERT, p. 34). The three-row table below condenses it: learn the criterion and the conclusion for each classification, and you can rebuild the whole chapter from them.
| Classification | Criterion used | Most important conclusion |
|---|---|---|
| Primary, secondary, tertiary | Nature of activity | The tertiary sector contributes the most to GDP, but employment remains in the primary sector (NCERT, p. 34) |
| Organised, unorganised | Conditions of employment | Most workers are in the unorganised sector and need protection and support |
| Public, private | Ownership of assets and delivery of services | The government must run or support activities the private sector will not provide at reasonable cost |
To the conclusions, add the problems the chapter attached to each classification: underemployment and how to create jobs; exploitation and how to protect unorganised workers; and unequal access and why the government must provide key services.
Related chapters and resources
Development (Chapter 1) sets the development goals this chapter’s employment measures serve, and Money and Credit (Chapter 3) follows up the need for cheap agricultural credit raised here. For study material across the subject, see the Class 10 Social Science notes and the Class 10 notes hub.
The full CBSE notes collection covers later chapters in the same plain style, and other Social Science chapters such as Water Resources are there as well.
The chapter also opens with notes for the teacher that suggest classroom activities around classifying the work people do — useful if you are helping someone else study this chapter. All NCERT textbooks, including every Class 10 Social Science book, are published free on the official NCERT portal at ncert.nic.in.
Sources and data verification
- This page describes Chapter 2 of the NCERT Class 10 Understanding Economic Development textbook (English), official edition on ncert.nic.in.
- It covers this one chapter of this one book; other Class 10 Social Science textbooks and chapters are not described here.
- It is maintained for the 2026-27 session against the current NCERT edition.
- NCERT settles textbook editions, contents and PDFs; CBSE settles curriculum, syllabus and examinations. Where the examinable syllabus differs from textbook contents, the current official CBSE syllabus is the authority.
Frequently asked questions about Sectors of the Indian Economy Class 10
Why is the tertiary sector the largest producer but not the largest employer in India?
Because employment did not grow as fast as production. Between 1977–78 and 2026-27, service production rose about fourteen times but service employment only about five times, while industrial output rose more than nine times while industrial employment rose about three times (NCERT, p. 25).
So the tertiary sector produces the largest share of GVA, yet the primary sector still employs more than half of all workers.
What is the difference between GDP and GVA?
Gross Domestic Product is the value of all final goods and services produced within a country in a particular year, and it shows how big an economy is (NCERT, p. 23). Gross Value Added measures the contribution of the three sectors after adjusting for taxes and subsidies; India now reports GVA to be at par with global practice.
What is disguised unemployment and how is it different from open unemployment?
Disguised unemployment, or underemployment, is hidden: people appear to work but each person works below their potential, as with Laxmi’s family on their small plot, or a street vendor who spends the whole day yet earns little (NCERT, p. 26). Open unemployment is the visible case of someone who has no job at all.
Why are only final goods and services counted when calculating GDP and not intermediate goods?
Because the value of a final good already includes the value of all the intermediate goods used to make it (NCERT, p. 22). Counting an intermediate good separately would count the same value more than once — the error called double counting.
How are the organised and unorganised sectors different from each other?
They differ in the conditions of employment. The organised sector is registered, must follow labour laws, and offers secure work, fixed hours, overtime pay, paid leave, provident fund, gratuity and pensions (NCERT, p. 30). The unorganised sector is small, scattered and largely outside government control, with low, irregular pay and no job security or benefits (NCERT, p. 31).
What is the difference between public and private sectors with examples?
The difference is who owns the assets and delivers the services (NCERT, p. 33). In the public sector the government does this — railways and the post office are examples. In the private sector individuals or companies do — like TISCO and Reliance — and their activity is driven by the profit motive.
Reference: NCERT Class 10 Understanding Economic Development textbook, chapter 2, official edition on ncert.nic.in.
Explore Class 10 Social Science Books
- Previous: Development
- Next: Water Resources
Class 10 Social Science on LearnCBSE:
Related chapters:
- Resources and Development
- Power-sharing
- The Rise of Nationalism in Europe