
This page gives you the official NCERT Class 10 Economics Chapter 1, Development, from the book Understanding Economic Development — the chapter that asks what development means, how countries are compared, and whether today’s development can last. It runs over about 16 printed pages, and the official PDF is right below.
The rest of the page maps the chapter’s sections, key concepts, figures, definitions and exercises, so you can find what you need without hunting through the file.
Download the Official NCERT Class 10 Economics Chapter 1 Development PDF
Download NCERT Class 10 Economics Chapter 1 Development PDF (official NCERT edition) — this is the chapter exactly as NCERT publishes it, with every table, cartoon, photograph and the full set of exercises at the end. It is the same chapter that appears in the printed book, so your school copy and this file match page for page.
Download it to read offline or study it in any PDF reader.
| What the chapter holds | Count | Where it is used |
|---|---|---|
| Printed pages | 16 | |
| Figures with NCERT captions | 7 | |
| Tables | 8 | |
| Exercise questions | 30 | answered in our NCERT Solutions |
| Activities | 3 | |
| Official NCERT PDF | Download the chapter PDF | the chapter exactly as NCERT publishes it |
Chapter at a Glance
The chapter statistics table on this page shows at a glance how much of the chapter there is — its sections, figures, activities and exercise questions, exactly as they appear in the official PDF. The main sections, in order, are:
- What development promises — different people, different goals (NCERT, p. 3)
- Income and other goals (p. 4)
- National development (p. 5)
- How to compare different countries or states (p. 7)
- Income and other criteria (p. 9)
- Public facilities (p. 10)
- Human Development Report (p. 12)
- Sustainability of development (p. 13)
- Exercises (p. 15)
The chapter works through several data tables — on individual goals, on income and health, on India and its neighbours, and on crude oil reserves — and ends with a set of exercises plus an additional project for group discussion.
What This Chapter Covers: From Personal Goals to National Measures
The chapter builds its argument in one direction: it starts with what individuals hope for, then asks how whole countries can be compared, and finally asks whether today’s development can last for future generations.
- It opens with Table 1.1, the developmental goals of different categories of people, which shows that each person wants different things (NCERT, p. 3).
- It then asks what national development should mean: whose goals count, and whether the chosen path benefits a large number of people or only a small group (p. 5–6).
- It introduces income — and average per capita income — as the standard tool for comparing countries and states (p. 7–8).
- It tests income against health and education data for Haryana, Kerala and Bihar, and finds that income alone gives a misleading picture (p. 9–10).
- It brings in public facilities and the UNDP’s Human Development Index, which combine income with health and education (p. 10–12).
- It closes with sustainability, using groundwater and crude oil to show why the current path of development may not last (p. 13–15).
The chapter’s data comes from official sources named on its opening page: Government of India reports such as the Economic Survey, the UNDP’s Human Development Report and the World Bank’s World Development Indicators (NCERT, p. 1).
The three activities
Three activities sit inside the chapter, each practising a different skill:
- Activity 1 (p. 7): find a development controversy in the news or from local people and collect the arguments from different sides — the point being that even the way to develop can be disputed.
- Activity 2 (p. 12): study the Uttar Pradesh rural literacy table and fill in the blanks by calculating percentages — practising how to read and interpret data.
- Activity 3 (p. 13): calculate your own Body Mass Index from your weight and height, and discuss nutrition — introducing health as a development indicator.
Key Concepts in the Chapter
These are the ideas the chapter builds on, in the order the book uses them. Each one is a tool you will need for the exercises at the end.
Different people, different goals
People want what is missing from their own lives, so their goals are rarely the same. Table 1.1 shows a landless rural labourer wanting more days of work and better wages, a prosperous farmer from Punjab wanting higher support prices and cheap labour, and a girl from a rich urban family wanting the same freedom as her brother (NCERT, p. 3–4).
Goals can also conflict. Industrialists may want more dams for electricity, but a dam can submerge land and disrupt the lives of displaced tribals, who would prefer small check dams or tanks to irrigate their fields.
National development means asking who benefits
If individuals disagree about development, ideas of national development will differ too (NCERT, p. 5). The deciding question is fairness: would the path benefit a large number of people or only a small group? That is what the chapter means by a fair and just path for all.
Average income and per capita income
To compare countries you need one measure, and income is the one the chapter treats as most important. A country’s total income is not useful for comparison because countries have different populations, so we divide total income by total population to get the average income, also called per capita income (NCERT, p. 7–8).
The World Bank uses per capita income in its World Development Reports to classify countries. In 2024, high-income countries were those with per capita income of US$ 66,500 or more a year, low-income countries about US$ 2,300 or less, and India — at about US$ 11,000 — fell in the low middle-income category (NCERT, p. 8).
Averages hide disparities
The chapter proves this with two imaginary countries, A and B, each with five citizens, whose average incomes are identical (NCERT, p. 8). The difference is in distribution: in Country A incomes run from Rs 9,500 to Rs 10,500, while in Country B four citizens earn Rs 500 each and the fifth earns Rs 48,000.
Most people would choose Country A, where people are neither very rich nor extremely poor.
Here is the same point with a fresh set of numbers. Take two villages with five families each.
Village P incomes (Rs): 8,000, 9,000, 10,000, 11,000, 12,000 \[ \text{Village P average} = \frac{8000+9000+10000+11000+12000}{5} = \frac{50000}{5} = 10{,}000 \]
Village Q incomes (Rs): 2,000, 2,500, 3,000, 3,500, 39,000 \[ \text{Village Q average} = \frac{2000+2500+3000+3500+39000}{5} = \frac{50000}{5} = 10{,}000 \]
Both villages average Rs 10,000 per family, yet the villages are nothing alike. In Village P every family earns between Rs 8,000 and Rs 12,000; in Village Q four families earn less than Rs 4,000 while one family earns Rs 39,000. The average puts the two villages on equal footing; the distribution shows they are not.
This is exactly why the chapter insists that averages are useful for comparison but hide how income is shared.
Income is not the only goal
People also want equal treatment, freedom, security and respect, and they resent discrimination. These non-material goals can matter more than money, because material goods are not all we need to live (NCERT, p. 4).
Money cannot buy everything either. Income alone is not an adequate indicator of the goods and services citizens can actually use: money cannot buy a pollution-free environment or unadulterated medicines, and it cannot protect you from infectious diseases unless the whole community acts together (NCERT, p. 10).
Human Development Index
Once income is seen as inadequate, the question becomes which few indicators matter most. The UNDP’s Human Development Report compares countries on their educational levels, their health status and their per capita income, combined into the Human Development Index (HDI) (NCERT, p. 12).
The word “human” carries the argument: what matters in development is what is happening to the citizens of a country — their health and well-being.
Sustainability
Development that cannot last is not real development. Renewable resources such as groundwater are replenished by nature, but even they can be overused — if we extract more than rain replenishes, we are overusing the resource. Non-renewable resources such as crude oil have a fixed stock on Earth that cannot be replenished; new discoveries only delay exhaustion (NCERT, p. 13–14).
The chapter reports that about 300 districts in India saw groundwater levels fall by over 4 metres in the past 20 years, and nearly one-third of the country is already overusing its groundwater reserves (NCERT, p. 13).
Figure Walkthrough: Reading the Chapter’s Cartoons and Photos
NCERT uses cartoons and photographs in this chapter to carry economic ideas visually. Each one below is explained so you can read it as part of the argument rather than as decoration.

The opening image (NCERT, p. 3) frames development as aspiration. The chapter’s first sentences say we have desires about how we would like to live and ideas about what a country should be like — so development begins as a set of hopes, not as a fixed definition.
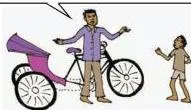
The rickshaw-puller cartoon (p. 4) makes the same point as Table 1.1: a person’s life situation decides what they can reasonably hope for. Asking for a car is meaningless to someone whose immediate dream is owning the rickshaw he pulls.
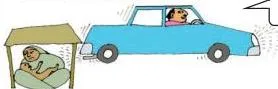
This cartoon (p. 5) carries the chapter’s two big conclusions in one frame: goals differ, and one person’s development can be another person’s loss. The dam example works the same way — electricity for industrialists versus submerged land and disrupted lives for displaced tribals.

The chairs cartoon (p. 9) contrasts a country with no rich and no poor — where the people who made the chairs use them — with its partner panel, “we made the chairs and he took them”.
It is the visual version of the averages argument: two places can have the same average income while the chairs in one are shared and in the other are taken by one person.
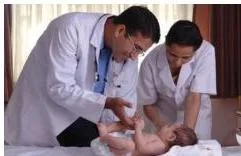
The infant mortality photo (p. 11) puts a human face on a statistic. The chapter asks you to think of parents whose children die before their first birthday: in Kerala, 6 of every 1,000 children died before age one, while in Haryana the figure was 28 — nearly three times higher (NCERT, p. 9–10).
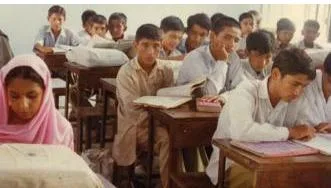
The collective-provision photo (p. 11) explains why Kerala does better on health than its income suggests: basic health and education facilities provided together reach everyone cheaply.
A locality’s shared security or a government school costs far less per person than every household buying its own — and money in your pocket cannot buy a pollution-free environment or protect you from infectious diseases on its own.
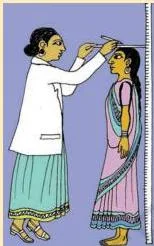
The BMI image (p. 13) introduces nutrition as a development indicator. Body Mass Index is weight in kilograms divided by the square of height in metres:
\[ \text{BMI} = \frac{\text{weight (kg)}}{\text{height (m)}^2} \]
Activity 3 asks you to measure and calculate your own BMI and compare it with BMI-for-age tables. A BMI below 18.5 for adults counts as underweight, which is why Exercise 13 asks why about one-fifth of people in India are undernourished even though the country produces enough food.
Terms Defined in the Chapter: Average Income, IMR, HDI and More
The chapter names several terms that need clarification before the data makes sense. Here is each one in plain language, with the page where NCERT defines it.
| Term | Plain meaning | NCERT page |
|---|---|---|
| Average income / per capita income | The total income of a country or state divided by its total population; used instead of total income because population sizes differ. | p. 8 |
| Infant Mortality Rate (IMR) | The number of children who die before the age of one year, out of every 1,000 live children born in that year. | p. 10 |
| Literacy Rate | The proportion of literate people in the population aged 7 and above, out of everyone in that age group. | p. 10 |
| Net Attendance Ratio | Children aged 15–17 who attend school, as a percentage of all children in that age group. | p. 10 |
| Life Expectancy at birth | The average expected length of life of a person at the time of birth. | p. 12 |
| Purchasing Power Parity (PPP) | Incomes converted into dollars so that one dollar buys the same goods and services in any country, making comparison meaningful across countries. | p. 12 |
| Human Development Index (HDI) | The UNDP’s composite measure that combines per capita income, health status and educational levels into a single index. | p. 12 |
| Renewable and non-renewable resources | Renewable resources are replenished by nature (crops, plants, groundwater); non-renewable resources have a fixed stock on Earth that cannot be replenished once used (crude oil). | p. 13–14 |
Common Mistakes Students Make in This Chapter
Four confusions show up again and again in this chapter. Here they are, named before you make them.
| The mistake | The correction | How to check your answer |
|---|---|---|
| Treating “different developmental goals” and “conflicting developmental goals” as the same thing (NCERT, p. 4). | Different means the goals are not the same; conflicting means one person’s goal works against another’s — the girl versus her brother, and industrialists’ dams versus displaced tribals. | Ask: does one person’s gain cause another’s loss? If yes, the goals conflict; they do not merely differ. |
| Believing a high average income means everyone is well off (NCERT, p. 8). | Averages hide disparities. Country A and Country B have identical averages but very different distributions; the Village P and Village Q example above makes the same point. | List the individual incomes, not just the average. If most people earn far less than the average, the distribution is unequal. |
| Concluding that Haryana is more developed than Kerala because its per capita income is higher (NCERT, p. 9–10). | Income is one criterion among several. Kerala is far ahead on IMR (6 vs 28), literacy (94% vs 82%) and net attendance (94 vs 73). | Read every row of Tables 1.3 and 1.4 before concluding. One column never tells the whole story. |
| Thinking renewable resources cannot be overused (NCERT, p. 13–14). | Renewable only means nature replenishes the resource. If extraction exceeds replenishment — as with groundwater — the resource is being overused. | Ask the replenishment question: is the resource being used faster than nature restores it? |
Exam Notes: World Bank, UNDP and the Data Comparison Questions
NCERT textbook contents and the examinable CBSE syllabus are not always identical, so check the current official syllabus before deciding what to study. Keep the Class 10 notes hub handy for syllabus-linked revision material.
The two institutions in this chapter measure development differently, and most comparison questions test exactly that difference.
| Aspect | World Bank | UNDP |
|---|---|---|
| What it measures | Per capita (average) income alone (NCERT, p. 7–8) | Per capita income plus health status and educational levels, combined into the Human Development Index (p. 12) |
| Where it appears | World Development Reports, which classify countries as high income, low income or middle income | Human Development Report, which ranks countries by HDI |
| Idea of development | Higher income means more developed; ignores how income is distributed and ignores non-income goals | Development is about people — their health and well-being come first |
The exercises on pages 15–16 test the same ideas in different ways. A quick map:
| Exercise | What it tests |
|---|---|
| Q1–Q3 | Basic concepts: Q1 the all-round idea of development, Q2 comparing India with its neighbours on human development, Q3 an average income calculation with four families. |
| Q4 | The World Bank’s criterion and its limitations. |
| Q5 | The difference between the UNDP’s and the World Bank’s approaches. |
| Q6 | Why we use averages and their limitations. |
| Q7 | The Kerala versus Haryana debate — is per capita income useless? |
| Q9, Q10 | Sustainability: why it matters, and the relevance of the statement that the earth has enough for everyone’s need but not for one person’s greed. |
| Q12, Q13 | Reading data: Q12 finds the top and bottom country for each item in Table 1.6; Q13 reads the BMI-by-state table on nutrition. |
Answering the Kerala versus Haryana question (Exercise 7)
A full answer needs three parts, and the data must come first:
- State the data. Haryana’s per capita income (Rs 3,25,759 in 2026-27) is higher than Kerala’s (Rs 2,81,001) (NCERT, p. 9).
- Give Kerala’s better indicators. Kerala’s infant mortality rate is 6 against Haryana’s 28, literacy is 94% against 82%, and net attendance ratio is 94 against 73 (NCERT, p. 9–10). Kerala achieves this through adequate public health and education facilities (p. 11).
- Conclude with the balance. Per capita income is useful and should not be discarded, but it is not sufficient on its own. A complete comparison must include health, education and public facilities.
Five Ideas That Hold the Chapter Together
If you remember only five things from this chapter, remember these:
- Development means different things to different people, and goals can even conflict — one person’s development can be destructive for another (NCERT, p. 4–5).
- Income is the most common measure of development, and average or per capita income is used to compare countries and states (p. 7–8).
- Averages hide disparities — the same average can cover very unequal distributions (p. 8).
- Income alone is inadequate: health, education, public facilities and non-material goals such as freedom and respect matter too (p. 9–11).
- Development must be sustainable: renewable resources can be overused and non-renewable resources can be exhausted (p. 13–14).
The chapter closes by noting that the debate on development continues — at all times we need to ask where we want to go and what our goals are (p. 15).
Related Resources
Reference: NCERT Class 10 Understanding Economic Development textbook, chapter 1, official edition on ncert.nic.in.
This is Chapter 1 of the Class 10 Economics book. For the full set of Class 10 Social Science chapters — History, Geography, Political Science and Economics — see the NCERT Class 10 Social Science book page. The next chapter in this book is Sectors of Indian Economy — Class 10 Economics Chapter 2, also available from the same section.
For notes across all subjects of this class, visit the CBSE notes collection.
Another chapter in the same Class 10 Social Science set is Forest and Wildlife Resources from Geography. The official source of every chapter in this book is the NCERT Class 10 Understanding Economic Development textbook page on ncert.nic.in.
Sources and Data Verification
This page describes Chapter 1 of the NCERT Class 10 Understanding Economic Development textbook, English edition, as published on ncert.nic.in. All page references, figure captions, tables and statistics above come from that textbook, and the page numbers match the printed NCERT edition.
The page is maintained for the current academic session using the NCERT information available to us. NCERT settles textbook editions and PDFs; CBSE settles the curriculum, syllabus and examinations. As noted above, textbook contents and the examinable syllabus are not always identical, and the official CBSE syllabus is the final authority for examinations.
Frequently Asked Questions on Development (Class 10)
What is the main criterion used by the World Bank to classify countries?
The World Bank uses per capita (average) income. In its World Development Reports it groups countries by per capita income: in 2024, high-income countries earned US$ 66,500 or more per person per year, low-income countries about US$ 2,300 or less, and India, at about US$ 11,000, was a low middle-income country (NCERT, p. 7–8).
The limitation is that this measure ignores how income is distributed and ignores goals like health, education, freedom and security.
How is the UNDP’s measure of development different from the World Bank’s?
The UNDP uses the Human Development Index, which combines educational levels, health status and per capita income (NCERT, p. 12). The World Bank looks only at per capita income. The UNDP’s approach puts people at the centre: what matters in development is what is happening to the citizens of a country — their health and well-being.
Why does Kerala rank better on human development than Haryana despite lower per capita income?
Because income is only one indicator. Kerala’s per capita income (Rs 2,81,001 in 2026-27) is lower than Haryana’s (Rs 3,25,759), but Kerala has far better health and education outcomes: an infant mortality rate of 6 against Haryana’s 28, literacy of 94% against 82%, and a net attendance ratio of 94 against 73 (NCERT, p. 9–10). Kerala achieves this through adequate public health and education facilities (p. 11).
What is the difference between different developmental goals and conflicting developmental goals?
Different means the goals are not the same — a landless labourer wants work and wages while a prosperous farmer wants higher support prices. Conflicting means one person’s goal works against another’s: the girl who wants the same freedom as her brother, or the tribals displaced by a dam that industrialists want for electricity (NCERT, p. 4).
All conflicting goals are different, but not all different goals conflict.
Why is average income not enough to judge a country’s development?
Because an average hides how income is distributed. The chapter’s Country A and Country B have identical average incomes, but in Country A everyone earns close to the average while in Country B four citizens earn tiny amounts and one earns Rs 48,000 (NCERT, p. 8).
Income also cannot buy everything: not a pollution-free environment, not unadulterated medicines, and not protection from infectious diseases without collective action (p. 10). People also value non-material goals such as freedom, security and respect.
What does the NCERT chapter say about sustainable development?
It says development must not use up what future generations will need. Renewable resources like groundwater are replenished by nature but can be overused when extraction exceeds what rain restores — about 300 districts in India have seen groundwater levels fall by over 4 metres in 20 years.
Non-renewable resources like crude oil have a fixed stock that cannot be replenished, so they will eventually be exhausted (NCERT, p. 13–14). The chapter quotes the idea that we have not inherited the earth from our forefathers but have borrowed it from our children (p. 13).
Explore Class 10 Social Science Books
- Next: Forest and Wildlife Resources
Class 10 Social Science on LearnCBSE:
Related chapters:
- Resources and Development
- Power-sharing
- The Rise of Nationalism in Europe