
These are revision notes for Chapter 7, Project Based Learning, from the Class 12 Informatics Practices textbook. The chapter shows how a real problem is turned into a working data project: identify the problem, plan it, split it into modules, process the data in Python Pandas, and report the outcome. These notes follow the NCERT rationalised textbook for the 2026-27 session.
You get the whole unit in one pass: the five project based learning steps, the six teamwork components, all four project briefs (APPAREL EASY, Bookworm Club, the social media survey and the census analysis), the 8-step Pandas pipeline, a worked example with original numbers, a walkthrough of the chapter’s bar chart, common mistakes, and a one-screen revision summary.
Everything is compressed from the chapter, so you can revise the entire unit in one sitting.
The chapter opens with Gautam Buddha’s line: “An idea that is developed and put into action is more important than idea that exists only as an idea.” That line states the unit’s whole method — you learn a skill by building a project, not by reading about one.
What Chapter 7 Covers: From a Problem to Four Projects
Project Based Learning (PBL) is the framework of the chapter; the four projects are its applications. Learn the framework first, then the Pandas pipeline that every project shares. The textbook previews four blocks in the chapter: an introduction to project based learning, approaches for solving projects, teamwork, and project descriptions — which is exactly the order of these notes.
| Project | Domain | Data you work with | Output you produce |
|---|---|---|---|
| I. APPAREL EASY | E-commerce clothing platform | Merchandise records: Apparel Code, Name, Category, Size, Price, Customer Name, Payment Mode, Discount Code | Sales plots for monthly and category-wise revenue, focused on the two mega events |
| II. Bookworm Club | Book donation and recycling camp | Three CSV files: collections, refurbished, orders | Plots of sales, items refurbished, items collected |
| III. Social media and mental health survey | Survey research | One CSV file exported from Google Forms | Mean, median and similar statistics, with charts |
| IV. Adolescent and youth census analysis | Government open data | Census CSV file: 12,168 rows, 123 columns | Filtered DataFrames, grouped sums and a bar chart |
One honest note before the detail: this chapter has no formulas and no end-of-chapter exercise. Its reusable method is the 8-step Pandas pipeline covered later in these notes — that is the closest thing the unit has to a formula.
Definitions You Need Before the Projects
Scan this table once — every term in it is used again in the project briefs, so the rest of the page reads much faster afterwards.
| Term | Meaning in this chapter | Where it appears |
|---|---|---|
| Project Based Learning | Learning by solving a real problem as a project: students organise the project, manage time, and in groups practise working together, problem solving, decision making and investigating | Chapter introduction and the five steps (pp. 195-197) |
| Teamwork | A collective effort made by several individuals to accomplish a task | p. 197 |
| Structured or modular approach | Splitting the project into manageable modules, each with a well-defined task and a set of inputs; the module outputs are integrated into the desired outcome | p. 196 |
| Project leader | The one member identified to lead the project; the roles of the leader and of every member are defined before work starts | p. 196 |
| Project outcome | The final result of a project. It can be single or multiple, and it can be peer reviewed and modified on feedback | p. 197 |
| Peer review | Having the project output reviewed by others — the guide teacher or other users — and modifying it based on their feedback | p. 197 |
| CSV data file | A comma-separated values file that stores project data (collections, orders, survey responses); Pandas reads it with read_csv | pp. 200-205 |
Top-down and bottom-up are named in the chapter (NCERT, p. 196) as approaches for solving projects, but the textbook does not define them. The standard working meaning: a top-down approach starts from the whole problem and breaks it into smaller parts; a bottom-up approach first builds and tests the small parts, then combines them into the complete solution.
The Five Steps of Project Based Learning
The chapter names three approaches for solving a project — modular, top-down and bottom-up — and builds everything on the modular approach: the project is split into manageable modules, each with a well-defined task and a set of inputs, and the outputs of all modules are integrated to reach the desired outcome (NCERT, p. 196).
The five steps below are the project cycle the whole chapter builds on, and the textbook shows them as a flow in Figure 7.1.
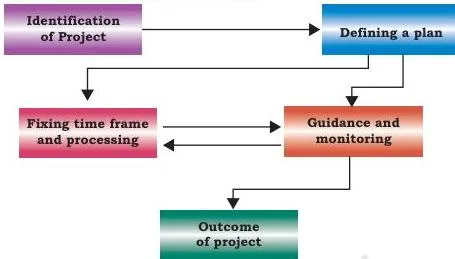
- Identification of a project — the idea comes from a real-life situation (the chapter’s example: organising a seminar). Students weigh the project’s usefulness and impact, and interdisciplinary projects are encouraged (NCERT, p. 196).
- Defining a plan — identify one project leader, define the roles of the leader and of every member, assign specific activities, know the tools the activities need, and think through extreme situations to reach a better solution (NCERT, p. 196).
- Fixing of a time frame and processing — every project is time-relevant; each activity needs a certain amount of time, so the project must be well structured yet flexible in its time frame (NCERT, pp. 196-197).
- Providing guidance and monitoring — participants can get stuck on a process; guidance comes from books, websites and experts, the project leader ensures monitoring, and the guide teacher also helps (NCERT, p. 197).
- Outcome of a project — understand the outcome thoroughly. It can be single or multiple, and the output can be peer reviewed and modified on feedback from the guide teacher or other users (NCERT, p. 197).
Memory device: “I Do Fine, Great Outcome” — Identify the project, Define the plan, Fix the time frame, Guide and monitor, Outcome.
Teamwork: Six Components of a Successful Group
Teamwork is defined in the chapter as a collective effort made by individuals to accomplish a task (NCERT, p. 197). The cricket example makes it concrete: a bowler may bowl a good ball, but if the fielder cannot take the catch, no wicket falls — and a match is won only through contributions in all three areas of batting, bowling and fielding.
One weak link breaks the team.
| Component | What it means in a project | Example from the chapter |
|---|---|---|
| Communicate with Others | Keep communication effective among all members | Via e-mails, telephones or group meetings, so members understand each other and sort out problems |
| Listen to Others | Understand others’ ideas while executing the job together | Listening in group meetings and following the steps the group agrees on |
| Share with Others | Exchange ideas, images and tools with teammates | A member well versed in an area shares that expertise so the goal is met within the time frame |
| Respect for Others | Treat every member respectfully | All thoughts and ideas put forward are respected and duly considered; ignoring a member’s views may stop that member giving their best |
| Help Others | Offer a helping hand to teammates | Members help each other; help may also come from people outside the team |
| Participate | Take an active part in the project and in discussions | Members encourage each other to participate so everyone feels their importance in the team |
Remember it in two buckets: the talk skills are Communicate, Listen and Share; the behaviour skills are Respect, Help and Participate.
The Four Projects: What Each One Asks You to Build
Every brief follows the same three-part shape — Description, Specification, Implementation. The comparison table below lines up the four projects so you can see at a glance which data file, which coding rules and which plots each one needs.
| Project | Domain | Data files and fields | Coding rules to follow | Plots required |
|---|---|---|---|---|
| I. APPAREL EASY | Online shopping | Records with Apparel Code, Name, Category, Size, Price, Customer Name, Payment Mode, Discount Code | Men/Women categories with Clothing, Footwear and Accessories under both; FEST = 10% and EOS = 15%; sale capped at 70% of merchandise; card payment asks number, name, CVV, validity; COD asks nothing | Category-wise and monthly sales, with focus on the Festive and End of Season sales |
| II. Bookworm Club | Book donation and recycling | collections CSV (Item category, Item ID, Item name, Item type, Condition); refurbished CSV (Item id, Item name, Item Category, Quantity, Price); orders CSV (Item Category, Item name, Quantity, Price) | Item ID prefix B for books, N for notebooks; Condition only Fit, Needs Mending, Unfit; refurbished categories only Paper bags, Notebook, Books; an order updates the refurbished quantity | Sales, items refurbished and items collected |
| III. Social media survey | Survey on teenage social media use and mental health | One CSV file of Google Forms responses | Import into a Pandas DataFrame; compute mean, median, etc.; visualise with charts | Charts of the survey findings |
| IV. Census analysis | Government open data | Census CSV file: 12,168 rows, 123 columns; columns like Area Name, Total/Rural/Urban, age categories, SC/ST, literacy and workers | Filter by Area Name, group by category, sum, drop overlapping categories before plotting | Bar chart of Total, Male and Female population by age category |
Project I: Online Shopping Platform ‘APPAREL EASY’
- Description. Murugan’s e-commerce platform for clothing. Two broad categories — Men and Women — each with the sub-categories Clothing, Footwear and Accessories. Two mega events drive sales: the Festive Sale (a month before Diwali to Christmas) and the End of Season Sale (February and August). Murugan wants records of monthly and category-wise revenue, with special focus on the mega events, and of discounts offered by manufacturers, payment sites or the portal itself (NCERT, pp. 199-200).
- Data fields. Apparel Code, Name, Category, Size, Price, Customer Name, Payment Mode, Discount Code, etc. Men’s items can be Men’s Trousers, Men’s Shirt, Men’s Jeans and Men’s T-shirt; women’s items can include Skirts, Top, Pants, Jeans, Kurta, etc.
- Rules to code. Card payment (Credit or Debit) asks for card number, name, CVV and validity; Cash on Delivery asks for nothing. Sale merchandise is selected randomly and must not exceed 70% of total merchandise. Discount codes are FEST at 10% and EOS at 15%.
- Output. Plots of the collected data to help Murugan decide future marketing and promotion strategies (NCERT, p. 200).
Project II: Bookworm Club
- Description. The Bookworm club runs an annual Book Donation Camp built on Reduce, Reuse, Recycle. Volunteers grade donated books as Fit, Needs Mending or Unfit; the unfit books’ pages are used to make paper bags and envelopes; the other categories are resold at half price. Notebooks with pages left are torn apart and attractively re-bound as new notebooks, and a variety of recycled objects are sold (NCERT, p. 200).
- Three CSV files. collections (Item category, Item ID, Item name, Item type, Condition), refurbished (Item id, Item name, Item Category, Quantity, Price) and orders (Item Category, Item name, Quantity, Price).
- Rules to code. A Book gets Item ID prefixed B and an Item Type of Academic or Non Academic (academic books also carry the class); a Notebook gets Item ID prefixed N and is Single line, Four Line or Five Line. Condition is limited to Fit, Needs Mending or Unfit. The refurbished Item Category is limited to Paper bags, Notebook or Books, and an incoming order updates the refurbished quantity (NCERT, pp. 200-201).
- Output. Plots of sales, items refurbished and items collected.
Project III: Social Media and Mental Health Survey
- Description. Teenagers spend a good amount of time on social networking sites, which can have a serious impact on mental health; a well-crafted survey questionnaire can explore and reveal the facts (NCERT, p. 201).
- Specification. Create the questionnaire with a free online tool such as Google Forms and store the responses in a CSV file; prepare the data analysis questions the survey should answer; import the CSV file into a Pandas DataFrame; perform statistical computation such as mean and median; and visualise the findings with appropriate charts (NCERT, p. 201).
- Note. Of the four projects this one has the smallest data load — a single CSV file of responses.
Project IV: Adolescent and Youth Census Analysis
- Data set. “Special Tabulation on Adolescent and youth population classified by various parameters for India, States and Union Territories, 2011”, contributed by the Ministry of Home Affairs and released under the National Data Sharing and Accessibility Policy (NDSAP). It is published on the Open Government Data (OGD) Platform India (NCERT, pp. 201-202).
- Size. The census CSV file has 12,168 rows and 123 columns (NCERT, p. 202).
- Key columns. State (serial numbers), Area Name, Total/Rural/Urban, adolescent and youth age categories, Total Male, Total Female, SC-M/F, ST-M/F, Literates-M/F, Illiterates-M/F, MainWorker-M/F and MarginalWorker-M/F — several repeated for Scheduled Castes and Scheduled Tribes (NCERT, pp. 202-203).
- Sample queries. The chapter lists eleven; a few are: the total, male and female population aged 10 to 24 in India; the state or UT with the maximum number of illiterates in the youth ages; the percentage of marginal workers and the top 5 states by marginal workers; urban vs rural sex ratio compared with a suitable graph; and the state with the highest and the lowest percentage of literate Scheduled Tribes and Scheduled Castes (NCERT, pp. 203-204).
- Working rule. Take any 4-5 of these questions and solve them step by step, with detailed explanation and documentation. The textbook solves its own Task 1 — the population aged 10 to 24 in India — as the demonstration (NCERT, p. 204).
The 8-Step Pandas Pipeline: This Chapter’s Working Formula
This chapter has no mathematical formulas. Its working formula is the 8-step Pandas pipeline, which the textbook runs on the census CSV file while solving Task 1. Master these steps once and you can approach any of the chapter’s census questions.
| Step | What you do | Short code outline | What it gives you |
|---|---|---|---|
| 0 | Import the libraries | import pandas as pd; import matplotlib.pyplot as plt | Pandas for data work, matplotlib for charts |
| 1 | Read the CSV into a DataFrame | df = pd.read_csv(‘PCA_AY_2011_Revised.csv’) | A DataFrame with all 12,168 rows and 123 columns |
| 2 | Check the shape | print(df.shape) | Confirms the row and column count |
| 3 | View the columns | print(df.columns.values) | Lists the 123 column names |
| 4 | Filter the data | Choose the columns to plot; inspect row values, e.g. print(df[‘Area Name’]) | Decides what the final plot will show |
| 5 | Build a new DataFrame with .loc | df1 = df.loc[(df[‘Area Name’] == ‘INDIA’), ‘Area Name’:’Total Population – Females’] | Row condition on the left of the comma, column slice on the right |
| 6 | Rename the columns | df1.columns = [‘Area’, ‘Class’, ‘Category’, ‘TotalPop’, ‘MalePop’, ‘FemalePop’] | Short names that are easier to group and plot |
| 7 | Group, sum and drop | d = df1.groupby(‘Category’).sum(); d = d.drop([‘Adolescent (10-19)’, ‘All Ages’, ‘Youth (15-24)’], axis=0) | Totals per category, with overlapping categories removed |
| 8 | Plot the bar chart | d.plot(kind=’bar’); plt.show() | The bar chart; show() renders it on screen |
Two details decide whether the pipeline works. First, .loc needs both halves: the row condition before the comma and the column slice after it (NCERT, p. 206).
Second, Step 7’s groupby must be followed by .sum() to produce a DataFrame of totals, and the drop removes the overlapping categories ‘Adolescent (10-19)’, ‘All Ages’ and ‘Youth (15-24)’ so the chart shows only 10-14, 15-19 and 20-24 (NCERT, p. 207).
Worked Example: What Share of the 20-24 Age Group Lives in Urban India?
Method: a filter-and-compare pipeline. This is an original question on the same census data set — it is not the textbook’s Task 1 and uses none of its output. Unlike Task 1, it needs no groupby: plain filtering answers it.
Step 1: Filter the census data to India’s rows and rename the columns, exactly as the chapter does (NCERT, p. 206):
df1 = df.loc[(df[‘Area Name’] == ‘INDIA’), ‘Area Name’:’Total Population – Females’] df1.columns = [‘Area’, ‘Class’, ‘Category’, ‘TotalPop’, ‘MalePop’, ‘FemalePop’]
Step 2: Select the 20-24 category. The filtered DataFrame has three rows for each age group — Total, Rural and Urban — so this filter keeps exactly the rows you need:
q = df1[df1[‘Category’] == ’20-24′]
Step 3: Read the TotalPop values you need from the filtered rows:
| Class | Category | TotalPop (persons) |
|---|---|---|
| Total | 20-24 | 111,424,222 |
| Rural | 20-24 | 73,835,046 |
| Urban | 20-24 | 37,589,176 |
Step 4: Divide the urban population (37,589,176 persons) by the total population of the age group (111,424,222 persons):
\[ \text{Urban share} = \frac{37{,}589{,}176}{111{,}424{,}222} \approx 0.337 \]
Final answer: about 33.7% of 20-24 year olds — roughly one in three — live in urban India. A complete answer states both the computation and the conclusion: “The urban population of the 20-24 age group is 37,589,176 out of 111,424,222, which is about 33.7%.”
Double-counting trap: notice that the Rural and Urban values add up to the Total value exactly:
\[ 73{,}835{,}046 + 37{,}589{,}176 = 111{,}424{,}222 \]
Because the Total row already contains Rural plus Urban, a groupby sum that adds Total, Rural and Urban together counts the population twice — it would report 222,848,444 for this age group. This question therefore needs a filter, not a groupby: before you aggregate anything, always check whether the data set’s Total row is itself the sum of Rural and Urban.
How to Read the Figure 7.2 Bar Chart
The chart below is the output of d.plot(kind=’bar’) after Step 8 of the pipeline (NCERT, p. 208). The x-axis has the three age categories that survived the drop — 10-14, 15-19 and 20-24 — and each category shows three bars: Total, Male and Female population.
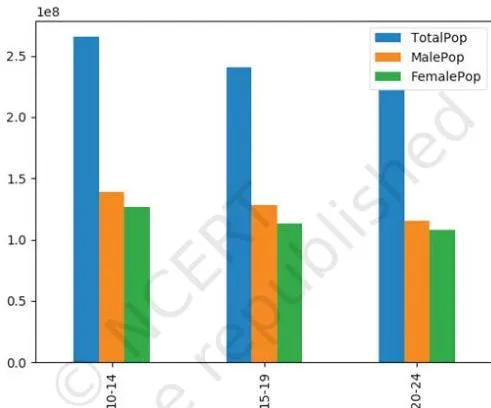
From the grouped table behind the chart, the population declines as age rises: 10-14 has about 265 million persons, 15-19 about 241 million, and 20-24 about 223 million. In every age group the male bar sits slightly above the female bar — for 10-14, males 138,837,670 against females 126,580,754 (NCERT, p. 207).
The 1e8 on the y axis. The value 1e8 marked at the top is an offset that matplotlib displays for the y axis: matplotlib switches to scientific notation when numbers fall outside a specified range (NCERT, p. 208). 1e8 means \( 1 \times 10^8 \) — that is, 100,000,000 — so the numbers printed along the axis are the true population counts divided by \( 10^8 \).
A sentence you could write about the chart: “All three age categories show the same pattern — the Total bar is the tallest, and the Male bar is slightly taller than the Female bar — so the male population exceeds the female population in every group between 10 and 24.”
Common Mistakes Students Make in This Chapter
The mistakes below are the code-level and specification-level traps in this unit. Each row gives the wrong move, the correct rule, and a quick way to check your work.
| Students write X | Correct is Y, because Z | How to check your answer |
|---|---|---|
| df1.groupby(‘Category’) with no aggregation | df1.groupby(‘Category’).sum() — groupby alone returns a GroupBy object, not a DataFrame of totals | Print the result: a DataFrame shows numbers in every cell |
| .loc with only a row condition | .loc needs both halves: df.loc[(df[‘Area Name’] == ‘INDIA’), ‘Area Name’:’Total Population – Females’] | Check there is a comma — condition on the left, column slice on the right |
| df1.columns = a list with the wrong number of names | The name list must match the column count exactly — six columns need six names | Count len(df1.columns) and compare it with the length of your list |
| Plotting before dropping the extra categories | Drop ‘Adolescent (10-19)’, ‘All Ages’ and ‘Youth (15-24)’ first, so only 10-14, 15-19 and 20-24 remain | Print d before plotting and confirm only three categories are left |
| Forgetting plt.show() | plot() builds the figure, show() displays it | Always end the plotting code with plt.show() |
| Summing Total, Rural and Urban together in a groupby | Do not sum all three — the Total row already includes Rural and Urban | Verify that Rural + Urban equals Total for the same category |
| Putting more than 70% of merchandise on sale | Sale items are randomly selected but limited to 70% of total merchandise | Count the chosen items against the total stock |
| Swapping the FEST and EOS discounts | FEST = 10%, EOS = 15% | Write the percentage next to each code: FEST → 10, EOS → 15 |
| Swapping the Item ID prefixes | B for Books, N for Notebooks | Check the first letter of a sample Item ID |
| Using a Condition value outside the allowed set | Condition can only be Fit, Needs Mending or Unfit | Scan the Condition column for any fourth value |
| Asking card details on a COD order | Cards need number, name, CVV, validity; COD asks for nothing | Branch on Payment Mode before prompting for details |
Exam Notes: Writing Complete Answers
This chapter has no exercise questions of its own, so a complete answer simply names everything the chapter lists. Here is what each kind of question must include.
- “List the steps of project based learning.” Name all five steps in order — identification of the project, defining a plan, fixing a time frame and processing, providing guidance and monitoring, and the outcome — with one explanation sentence each. Close with the chapter’s point that the outcome can be single or multiple and can be peer reviewed and modified on feedback (NCERT, pp. 196-197).
- “Explain teamwork.” Give the definition (a collective effort to accomplish a task), the cricket example (a good ball is wasted if the fielder drops the catch; winning needs batting, bowling and fielding), and all six components (NCERT, pp. 197-198).
- “Describe a project.” Follow the Description → Specification → Implementation shape: say what the project is about, then the data fields and coding rules, then the plots it must produce. For APPAREL EASY, that means the Apparel Code to Discount Code fields, the FEST/EOS and 70% rules, and the sales plots for marketing decisions.
- “Answer a census query.” Reproduce the 8 pipeline steps in order — import libraries, read_csv, check shape, view columns, filter, .loc into a new DataFrame, rename, groupby + sum + drop, then plot. The textbook itself expects queries to be solved step by step, with detailed explanation and documentation (NCERT, p. 204).
Need the rest of the book in the same compact form? The Class 12 Informatics Practices notes hub holds the other chapters, the Class 12 revision notes index covers the whole class, and the CBSE notes library reaches every subject. Where a project touches online behaviour, privacy or society, the societal impacts chapter notes are the natural next stop.
Revision Summary: The Whole Chapter on One Screen
The five PBL steps
- Identification of a project
- Defining a plan (leader, roles, activities, tools)
- Fixing a time frame and processing
- Guidance and monitoring
- Outcome — single or multiple, peer reviewed and modified
The six teamwork components
- Talk skills: Communicate, Listen, Share
- Behaviour skills: Respect, Help, Participate
The four projects in one line each
- I. APPAREL EASY — e-commerce platform with Men/Women categories, FEST 10% and EOS 15% discounts, and a 70% sale cap.
- II. Bookworm Club — donation camp running three CSV files (collections, refurbished, orders) with B/N Item ID prefixes.
- III. Survey — Google Forms responses in one CSV file; mean, median and charts.
- IV. Census analysis — 12,168-row, 123-column government data set; groupby sums and a bar chart.
The 8 pipeline steps
- Import pandas and matplotlib
- read_csv into a DataFrame
- Check the shape
- View the columns
- Filter: choose the columns and rows you need
- Build a new DataFrame with .loc and rename its columns
- groupby + sum, then drop the unwanted categories
- Plot with kind=’bar’ and call show()
Numbers to remember
| Number or code | What it belongs to |
|---|---|
| 70% | Maximum share of merchandise that may go on sale (APPAREL EASY) |
| FEST 10%, EOS 15% | Discount codes for the Festive and End of Season sales |
| B / N | Item ID prefixes for Books / Notebooks (Bookworm Club) |
| 12,168 rows, 123 columns | Size of the census data set |
| 1e8 | Y-axis scientific notation offset on the population bar chart |
For the full project tables and screenshots, the official NCERT Class 12 Informatics Practices textbook chapter PDF is the reference copy.
Reference: NCERT Class 12 Informatics Practices textbook, chapter Project Based Learning.
Frequently Asked Questions
What is project based learning in Class 12 Informatics Practices?
Project based learning is a way of learning by carrying out a real project, which gives students thorough practical exposure to the problem the project is based on (NCERT, p. 195). Students organise the project and use their time effectively, usually working in groups where they build skills such as working together, problem solving, decision making and investigating.
The chapter’s method is: analyse the problem, split it into small modules, apply a method to solve each module, then integrate the module solutions into the complete solution (NCERT, pp. 195-196).
What are the five steps of project based learning?
The five steps are: (1) identification of a project, (2) defining a plan, (3) fixing of a time frame and processing, (4) providing guidance and monitoring, and (5) the outcome of the project (NCERT, pp. 196-197). The outcome can be single or multiple, and the output can be peer reviewed and then modified according to feedback from the guide teacher or other users.
What are the six components of teamwork?
The six components are: communicate with others, listen to others, share with others, respect for others, help others, and participate (NCERT, p. 198). A useful split is talk skills (Communicate, Listen, Share) and behaviour skills (Respect, Help, Participate).
Which of the four projects in Chapter 7 is the simplest to build?
Judged by data size and the number of rules, Project III, the social media and mental health survey, is the lightest: it starts from one CSV file of Google Forms responses and needs mean/median computations plus charts. Projects I and II add business rules such as the FEST/EOS discounts, the 70% sale cap, Item ID prefixes and Condition limits.
Project IV is the heaviest, because the census data set has 12,168 rows and 123 columns and needs the full 8-step pipeline (NCERT, pp. 199-204).
Why does the population bar chart show 1e8 on the y axis?
1e8 is a scientific-notation offset that matplotlib displays for the y axis when the plotted numbers are outside its specified range (NCERT, p. 208). 1e8 means \( 1 \times 10^8 \), or 100,000,000 — so the values printed along the axis are the actual population counts divided by \( 10^8 \).
How do I filter only India’s rows from the census CSV in Pandas?
Use .loc with both a row condition and a column slice (NCERT, p. 206):
df1 = df.loc[(df[‘Area Name’] == ‘INDIA’), ‘Area Name’:’Total Population – Females’]
The part before the comma keeps only the rows where ‘Area Name’ equals ‘INDIA’; the part after the comma slices the columns from ‘Area Name’ through ‘Total Population – Females’. Both halves are required — leaving out either one breaks the selection.
Explore Class 12 Informatics Practices Notes
- Class 12 Informatics Practices Notes
- Class 12 CBSE Notes
- CBSE Notes for Classes 1 to 12
- Previous: Societal Impacts
Related chapters:
- Data Handling Using Pandas – I notes
- Data Handling using Pandas – II notes
- Plotting Data using Matplotlib notes