
These Motion in a Straight Line Class 11 notes compress Chapter 2 of the NCERT Physics Part I textbook into one revision page. You get velocity, acceleration, the kinematic equations, graph rules, free fall and two fully worked examples with fresh numbers — everything you need the night before the test.
This is kinematics: it describes motion without asking what causes it. The causes arrive in Chapter 4. All content follows the rationalised NCERT edition, and the printed textbook page numbers are cited so you can cross-check quickly.
If the measurement tools feel shaky, start with the Units and Measurement notes. When you move to two dimensions, the Motion in a Plane notes carry these same ideas further.
Motion, Rectilinear Motion and Why Kinematics Comes First
Motion is change of position of an object with time, and rectilinear motion is motion along a straight line (NCERT, p. 14). This chapter develops the ideas of velocity and acceleration for exactly this one-dimensional case.
- Point-object approximation: a moving object can be treated as a point when its size is much smaller than the distance it covers. A railway carriage moving between stations qualifies; a spinning cricket ball does not (NCERT, p. 14; applied in Exercise 2.1).
- Position convention: in one dimension, positions to the right of the chosen origin are positive and positions to the left are negative (NCERT, p. 22). Every sign in this chapter depends on this choice.
- Scope: kinematics only describes motion; the explanation of what causes it is the subject matter of Chapter 4 (NCERT, p. 14).
This chapter sits inside the Class 11 Physics notes collection; earlier chapters are listed in the Class 11 notes index and the main CBSE notes library.
Average Velocity, Instantaneous Velocity and Speed: The Core Ideas
Average velocity \( \bar{v} = \Delta x / \Delta t \) answers “how fast, overall?” for an interval, but it hides what happened inside the interval. The object could have raced, stopped or reversed without changing the average. That is why physics defines velocity at an instant (NCERT, p. 15).
The instantaneous velocity \( v \) is the limit of the average velocity as the time interval becomes infinitesimally small:
\[ v = \lim_{\Delta t \to 0} \frac{\Delta x}{\Delta t} = \frac{dx}{dt} \]
This is the rate of change of position with time at that instant (Eq. 2.1, NCERT, p. 15).
The limiting idea is easiest to see numerically: for the motion \( x = 0.08t^3 \), the average velocity at \( t = 4\ \text{s} \) computed over \( \Delta t = 2.0,\ 1.0,\ 0.5,\ 0.1,\ 0.01\ \text{s} \) takes the values \( 3.92,\ 3.86,\ 3.845,\ 3.8402,\ 3.8400\ \text{m s}^{-1} \) — closing in on \( 3.84\ \text{m s}^{-1} \), the value of \( dx/dt \) at \( t = 4\ \text{s} \) (NCERT, p. 15).
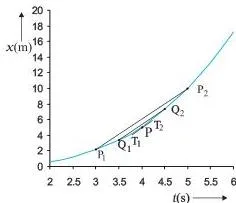
Figure 2.1 shows the same idea graphically: as \( \Delta t \) shrinks, the chord \( P_1P_2 \) rotates toward the tangent at point P, and the slope of that tangent is the velocity at that instant.
Speed is the magnitude of velocity: \( +24\ \text{m s}^{-1} \) and \( -24\ \text{m s}^{-1} \) both have speed \( 24\ \text{m s}^{-1} \). Two rules matter for exams (NCERT, p. 15):
- average speed \( \ge \) magnitude of average velocity over a finite interval;
- instantaneous speed = magnitude of instantaneous velocity, always.
| Quantity | Meaning | Magnitude rule |
|---|---|---|
| Displacement \( \Delta x \) | change in position: \( x_2 – x_1 \); its sign shows direction (NCERT, p. 23) | \( |\Delta x| \le \) path length |
| Path length | total distance actually covered along the path | \( \ge |\Delta x| \); equal only for motion without reversal |
| Average velocity \( \bar{v} \) | \( \Delta x/\Delta t \) over an interval | \( |\bar{v}| \le \) average speed |
| Instantaneous velocity \( v \) | \( \lim_{\Delta t \to 0}\Delta x/\Delta t = dx/dt \) at one instant | \( |v| = \) instantaneous speed, always |
| Average speed | total path length ÷ time interval | \( \ge |\bar{v}| \); equal if no doubling back |
| Instantaneous speed | magnitude of \( v \) at an instant | always \( = |v| \) |
Why the difference between average and instantaneous? Over a finite interval the object can double back, so path length can exceed \( |\Delta x| \). At a single instant there is no interval of time and no path to double back on, so the magnitudes agree.
Acceleration: How Velocity Changes with Time
Should the change of velocity be measured with distance or with time? This was debated even in Galileo’s time. Through his studies of freely falling objects and motion on inclined planes, Galileo concluded that the rate of change of velocity with time is constant for all objects in free fall, while the change with distance is not constant.
This led to acceleration as the rate of change of velocity with time (NCERT, p. 16).
Average acceleration over an interval is the change of velocity divided by the time interval:
\[ \bar{a} = \frac{v_2 – v_1}{t_2 – t_1} = \frac{\Delta v}{\Delta t} \]
Instantaneous acceleration is the limit of the average as \( \Delta t \to 0 \):
\[ a = \lim_{\Delta t \to 0} \frac{\Delta v}{\Delta t} = \frac{dv}{dt} \]
The SI unit is \( \text{m s}^{-2} \). On a v-t graph, average acceleration is the slope of the chord and instantaneous acceleration is the slope of the tangent (Eqs. 2.2 and 2.3, NCERT, p. 16).
Because velocity has both magnitude and direction, a change in velocity may come from a change in speed, a change in direction, or both. Acceleration can be positive, negative or zero (NCERT, p. 17). The curvature of the position-time graph shows the sign:


- positive acceleration: x-t graph curves upward;
- negative acceleration: x-t graph curves downward;
- zero acceleration: x-t graph is a straight line.
From here on, this chapter restricts itself to constant acceleration, for which the average acceleration equals the instantaneous value throughout the motion (NCERT, p. 17).
The Kinematic Equations: When Acceleration is Constant
For uniformly accelerated rectilinear motion, five quantities are linked: displacement \( x \), time \( t \), initial velocity \( v_0 \), final velocity \( v \) and acceleration \( a \). The three kinematic equations come from simple geometry and algebra (NCERT, pp. 17–18).
First equation \( v = v_0 + at \) comes directly from the definition of average acceleration with \( \bar{a} = (v – v_0)/(t – 0) \) (Eq. 2.4).
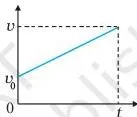
Second equation \( x = v_0 t + \frac{1}{2}at^2 \) comes from the area under the v-t graph (Fig. 2.5): the rectangle of area \( v_0 t \) plus the triangle of area \( \frac{1}{2}(v – v_0)t \). Since \( v – v_0 = at \), the displacement is \( v_0 t + \frac{1}{2}at^2 \) (Eq. 2.6).
Third equation \( v^2 = v_0^2 + 2ax \) is obtained by eliminating \( t \) between the first two equations: substitute \( t = (v – v_0)/a \) into \( x = \frac{1}{2}(v + v_0)t \) (Eq. 2.8).
If the particle is not at the origin when \( t = 0 \), replace \( x \) by \( (x – x_0) \):
\[ x = x_0 + v_0 t + \frac{1}{2}at^2, \qquad v^2 = v_0^2 + 2a(x – x_0) \]
Two validity warnings. First, \( \bar{v} = (v + v_0)/2 \) holds only for constant acceleration (Eq. 2.7b, NCERT, p. 18). Second, the whole set applies only when acceleration is constant; the definitions of instantaneous velocity and acceleration are exact and always correct, but the kinematic equations are not (NCERT, p. 24).
The same three equations can be derived by calculus: integrate \( a = dv/dt \) and \( v = dx/dt \) with the limits set by the motion. The advantage of the calculus method is that it extends to non-uniform acceleration as well (Example 2.2, NCERT, p. 19).
| Equation | Quantity it does NOT contain | Pick it when… |
|---|---|---|
| \( v = v_0 + at \) | position \( x \) | …you need velocity and position is never mentioned |
| \( x = v_0 t + \frac{1}{2}at^2 \) | final velocity \( v \) | …you need displacement and have no final velocity |
| \( v^2 = v_0^2 + 2ax \) | time \( t \) | …time is not given — the stopping-distance equation |
Which equation? Count what is missing. If the problem never gives \( x \), use \( v = v_0 + at \); if it never gives \( v \), use \( x = v_0 t + \frac{1}{2}at^2 \); if it never gives \( t \) — usually because time is not even mentioned — use \( v^2 = v_0^2 + 2ax \). Each equation omits exactly one of \( x,\ v,\ t \), so the missing quantity selects the equation.
Reading Motion Graphs: x-t, v-t and a-t
The golden rule of graph questions:
- slope of the x-t graph (tangent) = instantaneous velocity;
- slope of the v-t graph (tangent) = acceleration;
- area under the v-t graph = displacement over that time interval.
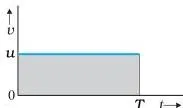
Why should an area equal a displacement? For constant velocity \( u \), the v-t graph is a horizontal line and the area under it between \( t = 0 \) and \( t = T \) is a rectangle of height \( u \) and base \( T \): area \( = uT \).
Check the dimensions of the axes — \( (\text{m s}^{-1})(\text{s}) = \text{m} \) — so the area has units of displacement (Fig. 2.4, NCERT, p. 17).
| Type of motion | x-t graph | v-t graph | a-t graph |
|---|---|---|---|
| Uniform motion (\( a = 0 \)) | straight line inclined to the time axis | straight line parallel to the time axis | zero line (on the time axis) |
| Uniform acceleration | parabola | straight line inclined to the time axis | horizontal line |
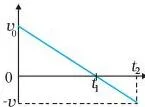
| Direction reversal at \( t_1 \) | turning point at \( t_1 \) (slope = 0) | crosses the time axis at \( t_1 \) | unchanged constant |
Figure 2.3(d) illustrates the reversal case: an object moves in the positive direction till time \( t_1 \), then turns back with the same negative acceleration. Its v-t graph crosses the time axis at \( t_1 \), where the velocity is momentarily zero (NCERT, p. 17).
One realism note: idealised graphs in textbooks have sharp kinks, meaning the functions are not differentiable at those points. In any real situation velocity and acceleration cannot change abruptly at an instant, so the graphs are smooth (NCERT, p. 17).
Figure walkthrough: revise the graphs in this order — Fig. 2.1 first (tangent slope = instantaneous velocity), then Fig. 2.2 (curvature of x-t = sign of acceleration), then Figs. 2.4 and 2.5 (area under v-t = displacement, and its use in deriving \( x = v_0 t + \frac{1}{2}at^2 \)). That sequence covers every graph skill the exercises demand.
Free Fall and Galileo’s Law of Odd Numbers
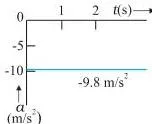
Free fall is motion under gravity with air resistance neglected. Near the Earth’s surface, and for heights small compared with the Earth’s radius, the acceleration due to gravity \( g \) is constant, \( 9.8\ \text{m s}^{-2} \) downward. Free fall is therefore uniformly accelerated motion (Example 2.4, NCERT, p. 20).
With the upward direction chosen as positive, gravity points down, so \( a = -g = -9.8\ \text{m s}^{-2} \). For an object released from rest at \( y = 0 \):
\[ v = -gt, \qquad y = -\frac{1}{2}gt^2, \qquad v^2 = -2gy \]
Galileo’s quantitative study of free fall led to his law of odd numbers: the distances traversed during successive equal intervals of time by a body falling from rest are in the ratio \( 1 : 3 : 5 : 7 : 9 \ldots \) (Example 2.5, NCERT, p. 20).
The proof is short. From \( y = -\frac{1}{2}gt^2 \), the positions after \( \tau,\ 2\tau,\ 3\tau \ldots \) are \( -\frac{1}{2}g\tau^2,\ -4(\frac{1}{2}g\tau^2),\ -9(\frac{1}{2}g\tau^2) \ldots \) In units of \( y_0 = \frac{1}{2}g\tau^2 \), the positions are \( 1,\ 4,\ 9,\ 16 \ldots \) and subtracting successive positions gives the distances:
| Time | Position (units of \( y_0 \)) | Distance in that interval | Ratio |
|---|---|---|---|
| \( \tau \) | 1 | \( y_0 \) | 1 |
| \( 2\tau \) | 4 | \( 3y_0 \) | 3 |
| \( 3\tau \) | 9 | \( 5y_0 \) | 5 |
| \( 4\tau \) | 16 | \( 7y_0 \) | 7 |
The pattern continues with 9, 11 and so on. You will meet the same ratio again in the worked free-fall example below, where the distances in successive seconds come out as 5 m, 15 m, 25 m.
Stopping Distance and Reaction Time: Kinematics on the Road
Stopping distance is the distance a vehicle travels from the instant brakes are applied to the instant it stops. Using \( v^2 = v_0^2 + 2ax \) with \( v = 0 \):
\[ d_v = \frac{-v_0^2}{2a} \]
Here \( a \) is the (negative) braking acceleration, so the distance comes out positive. The result is proportional to the square of the initial speed: doubling \( v_0 \) multiplies the stopping distance by \( 4 \). This quadratic dependence is exactly why speed limits exist in school zones (Example 2.6, NCERT, p. 21).
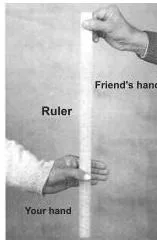
Reaction time is the time a person takes to observe, think and act. You can measure it with a falling ruler: drop it vertically through the gap between thumb and forefinger and catch it. The ruler falls freely from rest, so with \( d = -\frac{1}{2}gt_r^2 \):
\[ t_r = \sqrt{\frac{2d}{g}} \]
For a drop distance \( d = 21.0\ \text{cm} = 0.21\ \text{m} \) and \( g = 9.8\ \text{m s}^{-2} \), this gives \( t_r = \sqrt{2(0.21)/9.8} \approx 0.2\ \text{s} \) (Example 2.7, NCERT, p. 21).
Put the two ideas together for a driver’s total stopping distance: the car keeps moving at speed \( v_0 \) during the reaction time, then brakes. Total distance = reaction distance + braking distance:
\[ d_{\text{total}} = v_0 t_r + \frac{-v_0^2}{2a} \]
Both terms come straight from the kinematic equations — no new physics needed.
Worked Examples: Stepwise Solutions with Fresh Numbers
Worked Example A: A scooter’s three-stage trip
Method: split the motion into three stages, each with constant acceleration. Apply the kinematic equations stage by stage, then add distances and times.
Step 1 (accelerating): the scooter starts from rest, so \( v_0 = 0 \), with \( a = +2.0\ \text{m s}^{-2} \) for \( t = 8\ \text{s} \).
\[ v = v_0 + at = 0 + (2.0\ \text{m s}^{-2})(8\ \text{s}) = 16\ \text{m s}^{-1} \]
\[ x_1 = v_0 t + \frac{1}{2}at^2 = 0 + \frac{1}{2}(2.0)(8)^2 = 64\ \text{m} \]
Step 2 (cruising): constant velocity \( 16\ \text{m s}^{-1} \) for \( t = 10\ \text{s} \).
\[ x_2 = vt = (16\ \text{m s}^{-1})(10\ \text{s}) = 160\ \text{m} \]
Step 3 (braking): velocity falls from \( 16\ \text{m s}^{-1} \) to zero in \( t = 5\ \text{s} \), so the acceleration is negative.
\[ a = \frac{v – v_0}{t} = \frac{0 – 16}{5} = -3.2\ \text{m s}^{-2} \]
\[ x_3 = \frac{1}{2}(v + v_0)t = \frac{1}{2}(0 + 16)(5) = 40\ \text{m} \]
Step 4 (totals): the maximum velocity reached is \( 16\ \text{m s}^{-1} \).
\[ x = x_1 + x_2 + x_3 = 64 + 160 + 40 = 264\ \text{m}; \qquad t = 8 + 10 + 5 = 23\ \text{s} \]
\[ \bar{v} = \frac{x}{t} = \frac{264}{23} \approx 11.5\ \text{m s}^{-1} \]
Cross-check with the v-t graph area: the three areas are \( \frac{1}{2}(8)(16) = 64\ \text{m} \), \( (10)(16) = 160\ \text{m} \) and \( \frac{1}{2}(5)(16) = 40\ \text{m} \); their sum is \( 264\ \text{m} \), matching the stage-by-stage calculation.
Final answers: (i) maximum velocity \( 16\ \text{m s}^{-1} \); (ii) total distance \( 264\ \text{m} \); (iii) average velocity \( \approx 11.5\ \text{m s}^{-1} \) in the direction of motion.
Worked Example B: A stone dropped from a 45 m cliff
Method: free fall under constant gravity. Choose the top of the cliff as the origin and upward as positive, so \( a = -g = -10\ \text{m s}^{-2} \) and the ground is at \( y = -45\ \text{m} \).
Step 1 (time to hit the ground): released from rest means \( v_0 = 0 \).
\[ y = y_0 + v_0 t + \frac{1}{2}at^2 \quad \Rightarrow \quad -45 = 0 + 0 + \frac{1}{2}(-10)t^2 = -5t^2 \]
\[ t^2 = 9 \quad \Rightarrow \quad t = 3\ \text{s} \]
Step 2 (impact speed): use \( v = v_0 + at \).
\[ v = 0 + (-10\ \text{m s}^{-2})(3\ \text{s}) = -30\ \text{m s}^{-1} \]
The negative sign means downward; the impact speed is \( 30\ \text{m s}^{-1} \).
Step 3 (distance in the last second): find the position after \( t = 2\ \text{s} \) and subtract it from 45 m.
\[ y(2) = \frac{1}{2}(-10)(2)^2 = -20\ \text{m} \]
\[ \text{distance in the 3rd second} = 45 – 20 = 25\ \text{m} \]
Check with Galileo’s law: the distances in successive seconds are \( 5\ \text{m},\ 15\ \text{m},\ 25\ \text{m} \), in the ratio \( 1 : 3 : 5 \), exactly as the law of odd numbers predicts.
Final answers: time of fall \( 3\ \text{s} \); impact speed \( 30\ \text{m s}^{-1} \) downward; distance covered in the last second \( 25\ \text{m} \).
Common Mistakes in Straight-Line Motion (and the Fix)
These five traps come straight from the chapter’s “Points to Ponder” (NCERT, p. 24) and from how the equations are actually used in the exercises.
| Students write… | Correct is… | Why / how to check |
|---|---|---|
| “Negative acceleration means slowing down.” | The sign of \( a \) alone tells you nothing; compare the direction of \( a \) with the direction of \( v \). | A ball thrown up has \( a = -g \) while rising (slowing) and the same \( a = -g \) while falling (speeding). Same acceleration, opposite behaviour. |
| “Zero velocity at an instant means zero acceleration.” | A particle momentarily at rest can still have non-zero acceleration. | At the top of a vertical throw, \( v = 0 \) but \( a = g \) downward continues to act. |
| “Just substitute the numbers.” | First specify the origin and the positive direction of the axis. | The signs of \( x,\ v,\ a \) have meaning only relative to your chosen axis; flip the axis and every sign flips with it. |
| “Use \( v = v_0 + at \) whenever there is acceleration.” | The three kinematic equations hold only for constant acceleration. | The definitions of instantaneous \( v \) and \( a \) are always exact; Eqs. 2.9 are not. Check that \( a \) is constant before applying them. |
| “Area under the v-t graph gives distance.” | It gives displacement; area below the time axis is negative. | If velocity changes sign, displacement = (area above) − (area below), while distance adds the magnitudes. |
Misconception autopsy: the thrown ball and the sign of acceleration. Take upward as positive and throw a ball with \( v = +20\ \text{m s}^{-1} \). Going up, \( v \) is positive and \( a = -g \), so \( v \) and \( a \) point opposite ways — the speed falls to zero at the top.
Coming down, \( v \) is negative and \( a = -g \), so they point the same way — the speed grows. The acceleration is identical in both halves of the trip, yet one phase slows the ball and the other speeds it up. Conclusion: to decide whether an object speeds up or slows down, compare the direction of \( a \) with the direction of \( v \).
The same direction means speeding up; opposite directions mean slowing down. This rule is independent of origin and axis choice (NCERT, p. 24).
Exam Notes: What an Examiner Looks For
- Name the operation. Slope of tangent on x-t = velocity; slope of chord on x-t = average velocity; slope of v-t = acceleration; area under v-t = displacement. Stating which operation you used is itself the mark.
- Sign convention is a marked step. Write down the origin and positive direction before substituting values; signs are algebraic and must be substituted with proper signs (NCERT, p. 24).
- Know both derivation routes for the kinematic equations: the geometric/area method of Fig. 2.5 (NCERT, p. 18) and the calculus method of Example 2.2 (NCERT, p. 19), which also works for non-uniform acceleration.
- Galileo’s law is a compact derivation question. State the \( 1 : 3 : 5 : 7\ldots \) ratio and prove it by substituting \( t = \tau,\ 2\tau,\ 3\tau\ldots \) into \( y = -\frac{1}{2}gt^2 \) (Example 2.5, NCERT, p. 21).
- Graph and classification skills are tested repeatedly. Point-object classification (Exercise 2.1), reading x-t graphs (Exercise 2.2), distinguishing average speed from magnitude of average velocity (Exercises 2.9–2.11), and interpreting signs and slopes (Exercises 2.12–2.18) — these reward practice at reading graphs, not just substituting numbers.
- Speed vs velocity has a story behind it. The “tired man” exercise (2.10) shows why average speed is defined as total path length ÷ time: reporting magnitude of average velocity would tell a man returning home that his average speed was zero, which is absurd.
Where to verify: the full chapter, with every derivation and exercise figure, is in the official Physics Part I textbook, which you can open on the NCERT textbook portal.
Motion in a Straight Line Class 11 Notes: Revision Summary
The kinematic equations box — valid only for constant acceleration, with \( v_0 \) initial velocity, \( v \) final velocity, \( a \) acceleration, \( t \) time, \( x \) displacement, and \( x_0 \) the position at \( t = 0 \):
| Equation | Use |
|---|---|
| \( v = v_0 + at \) | velocity from time; no \( x \) |
| \( x = v_0 t + \frac{1}{2}at^2 \) | displacement from time; no \( v \) |
| \( v^2 = v_0^2 + 2ax \) | velocity from displacement; no \( t \) |
| \( x = x_0 + v_0 t + \frac{1}{2}at^2 \); \( v^2 = v_0^2 + 2a(x – x_0) \) | general forms when \( x = x_0 \) at \( t = 0 \) (Eqs. 2.9b, 2.9c) |
Quantity table adapted from the chapter summary (NCERT, p. 23):
| Quantity | Symbol | SI unit | Formula / remark |
|---|---|---|---|
| Displacement | \( \Delta x \) | \( \text{m} \) | \( x_2 – x_1 \); sign indicates direction |
| Average velocity | \( \bar{v} \) | \( \text{m s}^{-1} \) | \( \Delta x / \Delta t \) |
| Instantaneous velocity | \( v \) | \( \text{m s}^{-1} \) | \( dx/dt \); sign indicates direction |
| Average speed | — | \( \text{m s}^{-1} \) | total path length ÷ time |
| Instantaneous speed | — | \( \text{m s}^{-1} \) | \( |v| \) |
| Average acceleration | \( \bar{a} \) | \( \text{m s}^{-2} \) | \( \Delta v / \Delta t \) |
| Instantaneous acceleration | \( a \) | \( \text{m s}^{-2} \) | \( dv/dt \); sign indicates direction |
Graph facts to recall in the last five minutes:
- slope of x-t = velocity; slope of v-t = acceleration; area under v-t = displacement;
- uniform motion: x-t is a straight inclined line, v-t is a horizontal line, a-t is a zero line;
- uniform acceleration: x-t is a parabola, v-t is a straight inclined line, a-t is a horizontal line;
- x-t curves upward for positive acceleration, downward for negative acceleration;
- average speed \( \ge |\bar{v}| \), but instantaneous speed always equals \( |v| \);
- free fall with upward positive: \( v = -gt \), \( y = -\frac{1}{2}gt^2 \), \( v^2 = -2gy \); successive-interval distances fall in the ratio \( 1 : 3 : 5 : 7\ldots \)
Frequently Asked Questions
Why is average speed always greater than or equal to the magnitude of average velocity, but instantaneous speed equals instantaneous velocity?
Average speed uses total path length, while the magnitude of average velocity uses displacement. Over any finite interval the path length is at least as large as the displacement because the object can double back; only a motion with no reversal makes them equal.
At a single instant there is no interval in which to double back, so the instantaneous speed is exactly the magnitude of the instantaneous velocity (NCERT, p. 15).
Does negative acceleration always mean the object is slowing down?
No. Slowing down depends on whether acceleration points opposite to velocity, not on the sign of acceleration. With upward positive, a falling ball has \( a = -g \) and speeds up, while a rising ball has the same \( a = -g \) and slows down (NCERT, p. 24).
Why is g taken as negative when an object falls, if the object is speeding up?
Because the sign of \( g \) follows your chosen axis, not the object’s behaviour. If upward is positive, gravity points downward, so \( a = -g \). The fall speeds up because \( v \) and \( a \) are both negative — same direction. If you choose downward as positive instead, the same fall has \( a = +g \) (NCERT, p. 24).
What does the area under a velocity-time graph give, and when is it not equal to the distance travelled?
It gives displacement. While velocity keeps one sign, the displacement magnitude equals the distance travelled. Once the v-t graph crosses the time axis, the object reverses direction; area below the axis is negative, so displacement is (area above) − (area below), while distance is the sum of the magnitudes (NCERT, p. 17).
Under what condition is the average velocity equal to the arithmetic mean of initial and final velocities?
Only for constant (uniform) acceleration: \( \bar{v} = (v + v_0)/2 \) from Eq. 2.7b (NCERT, p. 18). If acceleration varies, this equality fails and you must return to the definition \( \bar{v} = \Delta x / \Delta t \).
Reference: NCERT Class 11 Physics textbook, chapter Motion in a Straight Line.
Explore Class 11 Physics Notes
More for this chapter:
Class 11 Physics on LearnCBSE:
Related chapters: