
This page carries the full Enzymes and Bioenergetics Class 11 chapter — NCERT Biotechnology Chapter 4, which runs from page 85 to page 102 of the official textbook. It covers both halves of the topic: how enzymes are classified, controlled and inhibited, and how cells transform and spend energy. The official chapter PDF from ncert.nic.in is linked right below.
Official NCERT chapter file: Open the NCERT Class 11 Biotechnology Chapter 4 Enzymes and Bioenergetics PDF to read the chapter as printed in the book; it is the current NCERT edition, hosted on the official NCERT site (ncert.nic.in).
| What the chapter holds | Count | Where it is used |
|---|---|---|
| Printed pages | 18 | |
| Sections in the chapter | 10 | |
| Figures with NCERT captions | 13 | |
| Tables | 3 | |
| Exercise questions | 11 | answered in our NCERT Solutions |
| Official NCERT PDF | Download the chapter PDF | the chapter exactly as NCERT publishes it |
Chapter 4 at a Glance
The table below lists how much Chapter 4 holds — its sections, figures, worked examples and exercise questions.
What This Chapter Covers: Enzymes First, Then Energy
Chapter 4 is built in two halves. Section 4.1 — Enzymes: Classification and Mode of Action — occupies pages 85 to 95 and is the longer half: it defines enzymes, classifies them, explains how they bind substrates, what changes their speed, and how inhibitors and regulators control them.
Section 4.2 — A Brief Introduction to Bioenergetics — runs from pages 96 to 100 and steps back to the energy rules every cell obeys: the two laws of thermodynamics, the free-energy function that combines them, and ATP as the molecule that carries free energy between reactions. The SUMMARY and EXERCISES close the chapter on pages 100 to 102.
Section 4.1: Enzymes — classification and mode of action
The larger half of the chapter treats enzymes as biocatalysts that work both inside the cell (in vivo) and in the test tube (in vitro). It moves from classification, through the active site and the two binding models, to the factors that change reaction rate, then to inhibition and allosteric regulation.
The early pages are vocabulary and concepts; the only formula arrives with kinetics on page 92.
Section 4.2: Bioenergetics — thermodynamics and ATP
The second half leaves individual enzymes and asks how any reaction can happen at all: what makes a reaction spontaneous, what free energy means, and how cells store energy in ATP. It is shorter but more abstract, and the two laws of thermodynamics are its backbone.
Summary and exercises at the end of the chapter
The chapter closes with a SUMMARY of its own main points — a ready-made revision list — and an EXERCISES block that mixes multiple-choice and short-answer questions. Both sit on pages 100 to 102, and the exam-notes section below maps each exercise to the page that answers it.
Key Concepts: Enzymes as Biocatalysts
Enzymes are the molecules that make biochemical reactions fast enough for life. Without them a cell’s chemistry would crawl, which is why every later chapter of this book assumes you know how they work. This section covers the definitions, the classification and the factors that control enzyme speed.
What an enzyme is: proteins, ribozymes and cofactors
An enzyme is a biocatalyst: it speeds up a biochemical reaction, works in vivo and in vitro, is highly specific to its substrate, and is not changed by the reaction it accelerates (NCERT, p. 85). Almost all enzymes are proteins, with molecular masses from about 2000 to over a million daltons — the exceptions are catalytic RNA molecules called ribozymes (p. 85).
Many enzymes need a cofactor to work. The cofactor is either a complex organic molecule — a coenzyme — or a metal ion. The complete working enzyme plus its cofactor is the holoenzyme; the protein part alone is the apoenzyme. When the cofactor is held tightly by a covalent bond, it is called a prosthetic group (p. 86).
Coenzymes take part in catalysis only transiently and act as carriers of specific functional groups. Most are derived from vitamins — organic nutrients needed in small amounts in the diet (p. 86). Table 4.1 in the book lists the main coenzymes with their vitamin precursors:
| Coenzyme | Precursor vitamin | Group it carries |
|---|---|---|
| Biocytin | Biotin (B7) | \( CO_2 \) |
| Coenzyme B12 (5′-adenosylcobalamin) | Vitamin B12 | Alkyl group |
| Flavin adenine dinucleotide (FAD) | Riboflavin (B2) | Electrons |
| Coenzyme A | Pantothenic acid (B5) | Acyl and alkyl group |
| Nicotinamide adenine dinucleotide (NAD) | Niacin (B3) | Hydride |
| Pyridoxal phosphate | Pyridoxine (B6) | Amino group |
| Thiamine pyrophosphate | Thiamine (B1) | Aldehydes |
| Tetrahydrofolate | Folic acid (B9) | One-carbon group |
Notice the pattern: the B vitamins are the raw material for most coenzymes. NAD and FAD carry electrons, coenzyme A carries acyl groups, and biocytin carries \( CO_2 \) — the coenzyme’s name usually tells you what the enzyme handles.
Metal ions serve as cofactors for specific enzymes (Table 4.2 in the book). The pairs worth remembering are few:
| Metal ion | Enzymes that need it |
|---|---|
| \( \text{Fe}^{2+} \) or \( \text{Fe}^{3+} \) | Catalase, peroxidase, cytochrome oxidase |
| \( \text{Cu}^{2+} \) | Cytochrome oxidase |
| \( \text{Mg}^{2+} \) | DNA polymerase |
| \( \text{Mn}^{2+} \) | Arginase |
| \( \text{K}^{+} \) | Pyruvate kinase |
| \( \text{Mo}^{2+} \) | Nitrogenase, nitrate reductase |
| \( \text{Zn}^{2+} \) | Carbonic anhydrase, alcohol dehydrogenase |
| \( \text{Ni}^{2+} \) | Urease |
Two pairs to remember: \( \text{Zn}^{2+} \) with carbonic anhydrase and \( \text{Ni}^{2+} \) with urease. Note also that one enzyme can need more than one ion — cytochrome oxidase needs both iron and copper (p. 86).
The seven classes of enzymes
Because new enzymes were constantly being discovered, the International Union of Biochemistry (IUB) adopted a classification based on the type of reaction catalysed in 1964 (p. 86). Six classes were defined originally; a seventh, translocase, has been added recently (p. 87).
| Class | Reaction it catalyses |
|---|---|
| 1. Oxidoreductases | Oxidation-reduction reactions (transfer of electrons) |
| 2. Transferases | Transfer of groups between molecules |
| 3. Hydrolases | Hydrolytic reactions (functional groups transferred to water) |
| 4. Lyases | Addition or removal of groups to form double bonds |
| 5. Isomerases | Transfer of groups within a molecule to yield isomeric forms |
| 6. Ligases | Condensation of two molecules, coupled to ATP hydrolysis |
| 7. Translocase | Transfer of ions or molecules across membranes |
A memory aid for the order: “Old Tired Hippos Love Icy Lemon Tea” — Oxidoreductases, Transferases, Hydrolases, Lyases, Isomerases, Ligases, Translocases.
Isozymes and the active site
Isozymes (isoenzymes) are multiple molecular forms of the same enzyme present in one species, tissue or even one cell. They catalyse the same reaction but differ in amino acid composition, so their physicochemical properties differ (p. 87). The book’s examples: hexokinase exists in four isozyme forms, and lactate dehydrogenase (LDH) has five forms in humans.
The reaction happens at the active site — a pocket or cleft that forms only a small part of the enzyme’s total size. Because it is built from portions of the polypeptide chain, it has a three-dimensional structure into which the whole or part of the substrate fits.
Binding uses non-covalent forces: electrostatic interactions, hydrogen bonds, van der Waals forces and hydrophobic interactions (p. 88).
Lock and key versus induced fit
Two models explain how substrate and active site recognise each other. Fischer’s lock and key model (1894) says the active site is pre-shaped to fit the substrate exactly, and the substrate slips in as a key enters a lock, forming the enzyme-substrate complex (p. 88).
Koshland’s induced fit hypothesis (1958) says the free enzyme’s active site is not yet complementary to the substrate. The substrate’s approach induces a conformational change in the enzyme that aligns the amino acid residues needed for binding and catalysis.
The book’s analogy is a hand and a glove: the hand (substrate) stays rigid while the glove (active site) moulds around it (p. 88). Figures 4.1 and 4.2, in the figure walkthrough below, show the two models side by side.
Enzyme specificity: four types
“Enzymes are specific” is really four separate claims (p. 89):
- Group specificity — the enzyme acts on several closely related substrates.
- Absolute specificity — one enzyme, one substrate, nothing else.
- Stereochemical (optical) specificity — only one of two stereoisomers reacts; D-amino acid oxidase oxidises D-amino acids to keto acids.
- Geometrical specificity — the enzyme distinguishes cis from trans forms; fumarase interconverts fumarate and malate.
Temperature, pH and substrate concentration
Three environmental factors change the rate of an enzyme-catalysed reaction: temperature, pH and substrate concentration (p. 89).
Temperature: the rate rises with temperature up to a maximum and then falls, giving a bell-shaped curve. The peak is the optimum temperature. For most enzymes it lies between \( 40^\circ\text{C} \) and \( 45^\circ\text{C} \); most human enzymes are optimal near \( 37^\circ\text{C} \) and are denatured at extremes.
The exception that breaks the rule: Taq DNA polymerase from the thermophilic bacterium Thermus aquaticus stays active near \( 100^\circ\text{C} \), as do venom phosphokinase and muscle adenylate kinase (pp. 89-90).
pH: the same bell shape, with the peak at the enzyme’s optimum pH. Most enzymes of higher organisms work best between pH 6 and 8. Exceptions to know: pepsin at pH 1-2, acid phosphatases at pH 4-5, alkaline phosphatases at pH 10-11. Away from the optimum the rate drops, and at extreme pH the enzyme becomes totally inactive (p. 90).
Substrate concentration: the rate rises as more substrate is added, then stops rising once every enzyme molecule is busy — the enzyme is saturated and works at its maximum possible rate. At that stage, substrate is no longer the limiting factor (pp. 90-91). Figure 4.5 shows the plateau.
Units of enzyme activity and specific activity
Enzyme amount is measured by what it does. One enzyme unit (U) is the amount that converts 1 micromole of substrate per minute under standard conditions.
The IUB adopted this unit in 1964 but later discouraged it in favour of the katal, because the minute is not an SI unit: 1 katal converts 1 mole of substrate per second, so \( 1\ \text{kat} = 6 \times 10^7\ \text{IU} \) (p. 91).
Specific activity is the enzyme activity per milligram of enzyme protein — a measure of how pure the enzyme preparation is (p. 91). The purer the enzyme, the higher the specific activity.
Key Concepts: Enzyme Kinetics and Inhibition
This is where enzyme biology turns mathematical. One equation — the Michaelis-Menten equation — describes how fast single-substrate enzymes work, and three inhibition patterns explain how drugs and regulatory molecules switch enzymes off. Figures 4.6 to 4.12 are walked through in the figure section below.
Activation energy and why enzymes do not change ΔG
Every reaction has two different energies, and students confuse them constantly. \( \Delta G \) — the free-energy difference between products and reactants — decides whether the reaction is spontaneous. The activation energy, \( \Delta G^{\ddagger} \), is the extra energy needed to reach the transition state, and it decides how fast the reaction runs (p. 91).
The transition state has higher free energy than either the substrate or the product. Enzymes work by lowering \( \Delta G^{\ddagger} \) so that more molecules can cross the energy barrier per second. They cannot change \( \Delta G \), and they cannot alter the equilibrium of a biochemical reaction — the enzyme only speeds up the attainment of equilibrium (pp. 91-92).
The Michaelis-Menten equation and Km
For a single-substrate reaction, the substrate S binds the enzyme E to form an enzyme-substrate complex ES, which then breaks down into product P and free enzyme (p. 92):
\[ E + S \rightleftharpoons [ES] \rightarrow E + P \]
Leonor Michaelis and Maud Menten derived the equation that describes this kinetics in 1913 (p. 92):
\[ v_0 = \frac{V_{\max}[S]}{K_m + [S]} \]
Here \( v_0 \) is the initial velocity, \( V_{\max} \) the maximum velocity at a given enzyme concentration, \( K_m \) the Michaelis constant and [S] the substrate concentration. The graph of \( v_0 \) against [S] is a rectangular hyperbola (Figure 4.6).
Three limiting behaviours are worth learning exactly (p. 92):
- When [S] is much smaller than \( K_m \), \( v_0 \) is directly proportional to [S] — the rate rises linearly.
- When [S] is much larger than \( K_m \), \( v_0 \) equals \( V_{\max} \) — the rate is maximum and independent of [S].
- When [S] equals \( K_m \), \( v_0 \) equals \( V_{\max}/2 \). So \( K_m \) is the substrate concentration at which the reaction runs at half its maximum velocity.
Worked example with original numbers. Suppose an enzyme has \( V_{\max} = 80\ \mu\text{mol/min} \) and \( K_m = 4\ \text{mM} \).
Step 1: Substitute into the Michaelis-Menten equation.
At [S] = 4 mM, which equals \( K_m \), the equation must give half of \( V_{\max} \):
\[ v_0 = \frac{80 \times 4}{4 + 4} = \frac{320}{8} = 40\ \mu\text{mol/min} \]
Step 2: At [S] = 12 mM, well above \( K_m \), the rate climbs toward \( V_{\max} \):
\[ v_0 = \frac{80 \times 12}{4 + 12} = \frac{960}{16} = 60\ \mu\text{mol/min} \]
Step 3: At [S] = 1 mM, well below \( K_m \), the rate is nearly linear in [S]:
\[ v_0 = \frac{80 \times 1}{4 + 1} = \frac{80}{5} = 16\ \mu\text{mol/min} \]
Final answer: \( v_0 \) = 40, 60 and 16 \( \mu\text{mol/min} \) at [S] = 4, 12 and 1 mM respectively — confirming that velocity equals half of \( V_{\max} \) exactly when [S] equals \( K_m \).
Competitive inhibition
In competitive inhibition, the inhibitor resembles the substrate so closely that both compete for the same active site. The enzyme forms either the ES complex or the enzyme-inhibitor complex EI — never ESI (p. 93).
Because the competition is for the same site, a very high substrate concentration gives the substrate the advantage and the inhibitor is out-competed. So \( V_{\max} \) is unchanged, while the apparent \( K_m \) increases — the Michaelis-Menten curve shifts to the right (pp. 93-94, Figures 4.7 and 4.8).
Non-competitive inhibition
The non-competitive inhibitor has no structural similarity to the substrate and binds at a different site, not the active site. It can bind free enzyme E or the ES complex, so ES, EI and ESI all form (p. 94).
The substrate can still bind to the EI complex, but the ESI complex makes no product. The inhibitor effectively lowers the concentration of working enzyme, so \( V_{\max} \) drops while \( K_m \) is unchanged — and because the inhibitor is not competing with the substrate, extra substrate cannot overcome it (pp. 94-95, Figures 4.9 and 4.10).
Uncompetitive inhibition
The uncompetitive inhibitor binds only to the ES complex, never to the free enzyme, so it never competes with the substrate for the active site (p. 95).
Since it does not compete, increasing the substrate concentration cannot overcome it. The book’s key fact: both \( K_m \) and \( V_{\max} \) are altered (p. 95, Figure 4.11).
Keep the three inhibition types straight with this comparison:
| Type | What the inhibitor binds | Effect on \( K_m \) | Effect on \( V_{\max} \) | Can extra substrate overcome it? |
|---|---|---|---|---|
| Competitive | The active site (competes with substrate) | Increases (apparent \( K_m \)) | Unchanged | Yes — high substrate out-competes the inhibitor |
| Non-competitive | A different site (binds both E and ES) | Unchanged | Decreases | No |
| Uncompetitive | Only the ES complex | Altered | Altered | No |
All three rows are grounded in NCERT, pp. 93-95.
Allosteric enzymes
Allosteric enzymes break the Michaelis-Menten pattern: their \( v_0 \)-versus-[S] graph is sigmoidal (S-shaped), not a rectangular hyperbola (p. 95).
Each subunit carries a regulatory site alongside the active site. Regulatory molecules bind reversibly to that site and change the enzyme’s affinity for its substrate. These enzymes are the key regulators of metabolic pathways in the cell (p. 95, Figure 4.12).
Key Concepts: Bioenergetics and ATP
Enzymes do the work; energy pays for it. This half of the chapter explains the rules of energy exchange in cells — the laws every reaction obeys, the free-energy function that combines them, and the molecule, ATP, that carries energy between reactions.
What bioenergetics deals with
Bioenergetics (biological energetics) is the study of the transformation and use of energy by living cells. As reactions move from higher to lower energy levels, energy is released and used to perform work (p. 96).
Thermodynamics is the branch of physical chemistry that deals with energy changes. Bioenergetics is concerned only with the changes in energy — not with the mechanism or speed of a process (p. 96).
The two laws of thermodynamics explain three things: the direction a reaction takes, whether the work done is useful or non-useful, and whether the reaction needs energy from an external source (p. 96).
The first law of thermodynamics
The first law states that energy can neither be created nor destroyed, only converted between forms. The total energy of the universe — system plus surroundings — is constant (p. 96).
The system is the matter within a defined region; the surroundings are the rest of the universe. The law is written as:
\[ \Delta E = E_B – E_A = Q – W \]
where \( \Delta E \) is the change in internal energy, \( E_A \) and \( E_B \) are the system’s energy at the start and end, \( Q \) is the heat absorbed by the system and \( W \) is the work done by the system (pp. 96-97).
The key consequence: the energy change depends only on the initial and final states, not on the path taken between them (p. 97).
The second law and entropy
The first law cannot predict whether a reaction will happen spontaneously. The second law introduces entropy (S), the degree of randomness or disorder of a system. A process is spontaneous only if the total entropy of system plus surroundings increases (p. 97):
\[ (S_{\text{system}} + S_{\text{surroundings}}) \gt 0 \]
A system can become more ordered during a spontaneous process, provided the surroundings become disordered enough to keep the sum positive (p. 97).
Students often worry that living cells break the second law, because life is highly ordered. The chapter’s answer: life maintains its order only for a while, by consuming chemical energy (food) or, in photosynthetic organisms, light energy, and converting it to heat or work.
When the surroundings are included, total entropy still rises — and after death and decomposition, thermodynamic equilibrium and maximum entropy are certain (p. 97).
Free energy: combining the two laws
Entropy changes of a reaction cannot be measured directly, so in 1878 Gibbs combined the two laws into a single function, free energy (p. 98):
\[ \Delta G = \Delta H – T\Delta S \]
where \( \Delta G \) is the change in free energy, \( \Delta H \) the change in heat content (enthalpy), \( T \) the absolute temperature and \( \Delta S \) the entropy change. The equation applies at constant temperature and pressure, which is how biochemical reactions run.
\( \Delta G \) is the useful work theoretically available; the term \( T\Delta S \) is the part of \( \Delta H \) that cannot be used to do work (p. 98).
For a closed system — one that exchanges energy but not matter with its surroundings — the first law gives \( \Delta E = \Delta H – P\Delta V \), where \( P\Delta V \) is the work done on the surroundings by a volume change at constant pressure and temperature (p. 98).
ATP: the universal currency of free energy
Organisms get free energy from the environment: photosynthetic organisms capture it from sunlight, while chemotrophs (non-photosynthetic organisms) obtain it by oxidising food (p. 99). The cell uses this energy for four vital jobs: synthesising macromolecules from small precursors, active transport against a gradient, muscle contraction, and faithful genetic information transfer (p. 99).
Before use, much of this free energy is converted into adenosine triphosphate (ATP), the universal currency of free energy. ATP transfers free energy from exergonic (energy-releasing) processes to endergonic (energy-consuming) ones (p. 99).
During breakdown of energy-rich food, some free energy is used to build ATP from ADP and inorganic phosphate (Pi). ATP later donates that energy to biosynthesis, transport and contraction by splitting back into ADP and Pi, releasing about \( 7.3\ \text{kcal/mol} \) (pp. 99-100).
In some processes — such as the firefly’s light flashes — ATP is converted to AMP and pyrophosphate (PPi) instead (p. 100).
ATP, ADP and AMP are nucleotides: each is adenine (a purine base found in DNA and RNA) plus ribose (a pentose sugar) plus three, two or one phosphate groups respectively (p. 100, Figure 4.13).
How to Read the Figures of This Chapter
The chapter’s figures are its quickest revision tool. If you can read its two bell curves, the saturation plateau, the rectangular hyperbola, the inhibition plots and the sigmoid curve, most of the chapter’s questions answer themselves. Each figure below appears with what to look for in it.
The two models of enzyme-substrate binding: Figures 4.1 and 4.2
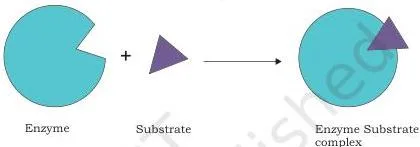
Figure 4.1 shows the lock and key idea: the active site is already the right shape, and the substrate fits it as a key fits a lock. Contrast it with Figure 4.2 below, where the enzyme changes shape around the substrate — the hand-and-glove idea. The contrast to remember is rigid versus flexible active site (p. 88).
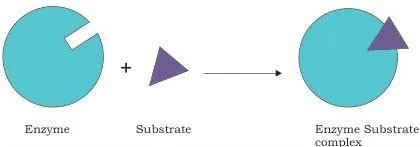
In Figure 4.2 the enzyme wraps around the substrate. The substrate (the hand) stays rigid while the active site (the glove) becomes complementary — that conformational change is what aligns the catalytic groups (p. 88).
Reading the bell curves: temperature and pH, Figures 4.3 and 4.4
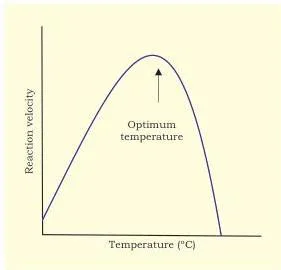
Figure 4.3 is the temperature bell curve. Read it left to right: activity climbs with temperature, peaks at the optimum temperature, then falls as heat denatures the enzyme (pp. 89-90).
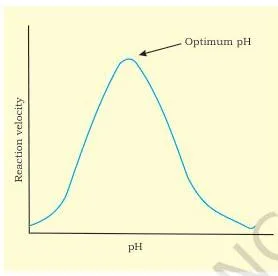
Figure 4.4 looks identical in shape but measures a different cause: the peak is the enzyme’s optimum pH, and activity falls on both sides because the enzyme’s shape depends on pH (p. 90).
Saturation: substrate concentration, Figure 4.5
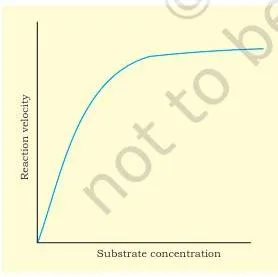
Figure 4.5 is the bridge to kinetics. The rate rises steeply at first — more substrate, more collisions, more product — then levels off. At the plateau every enzyme molecule is already busy, so more substrate no longer helps (pp. 90-91). That plateau is exactly the \( V_{\max} \) of the next figure.
The rectangular hyperbola: Figure 4.6
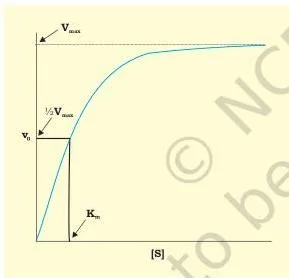
Figure 4.6 is the Michaelis-Menten graph. Three reading points matter: the curve approaches \( V_{\max} \) asymptotically at high [S]; at very low [S] the rise is nearly linear; and if you mark half of \( V_{\max} \) on the vertical axis, the value on the horizontal axis below it is \( K_m \) (p. 92). This figure sits behind Exercises 5 and 6.
Seeing inhibition in schemes and plots: Figures 4.7 to 4.11
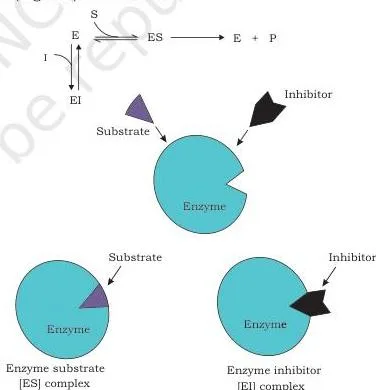
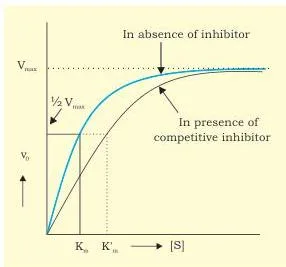
Figures 4.7 and 4.8 go together. The scheme shows inhibitor and substrate fighting for one site; the plot shows the result — the same ceiling (\( V_{\max} \) unchanged) but the curve pushed right (apparent \( K_m \) increased), because the inhibitor is out-competed as substrate rises (pp. 93-94).
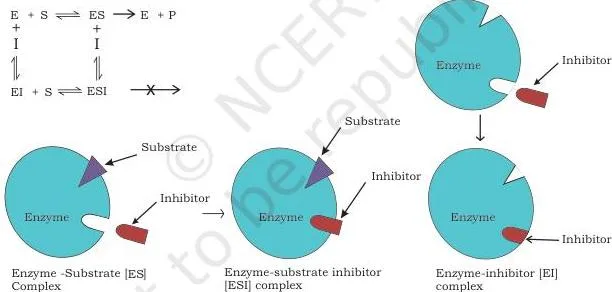
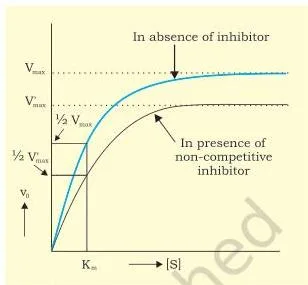
Figures 4.9 and 4.10 show the opposite pattern. The inhibitor sits at a separate site, the ESI complex forms but makes no product, and the plot’s ceiling drops (\( V_{\max} \) down) while the curve keeps its horizontal position (\( K_m \) unchanged) (pp. 94-95).
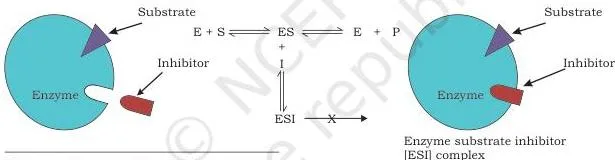
Figure 4.11 is the one students forget: the inhibitor binds only the ES complex, never the free enzyme, so substrate and inhibitor never compete — and extra substrate cannot reverse it. Both \( K_m \) and \( V_{\max} \) change (p. 95).
The visual shorthand for all three plots: a horizontal shift means a change in \( K_m \); a vertical drop means a change in \( V_{\max} \).
The sigmoid curve of allosteric enzymes: Figure 4.12
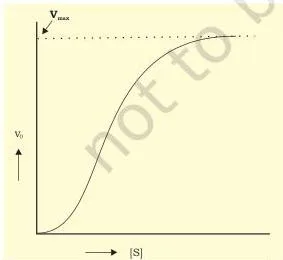
Figure 4.12 is the chapter’s odd-one-out: an S-shaped (sigmoidal) curve where a normal enzyme gives a hyperbola. The shape reflects the multiple subunits and the regulatory site on each one — it is the visual signature of an enzyme that regulates a metabolic pathway rather than merely catalysing one step (p. 95).
The nucleotides of energy: Figure 4.13
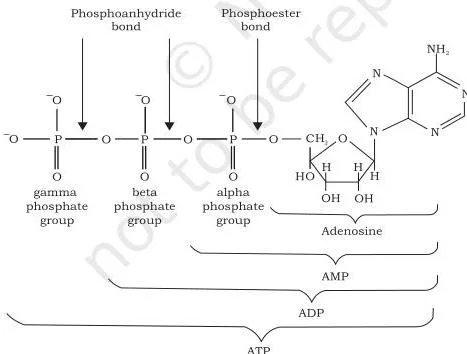
Figure 4.13 explains the phrase “universal currency”. All three molecules share the same adenine and ribose; they differ only in the number of phosphate groups — one for AMP, two for ADP, three for ATP. Breaking the terminal phosphate bond of ATP to give ADP and Pi is what releases the \( 7.3\ \text{kcal/mol} \) that powers the cell’s work (pp. 99-100).
Formulas from Chapter 4: What They Mean, Symbol by Symbol
Six equations carry the chapter. This table lists each one, what it describes, and the page where the book explains it.
| Formula | What it describes | Symbols | NCERT page |
|---|---|---|---|
| \( E + S \rightleftharpoons [ES] \rightarrow E + P \) | Reaction scheme of enzyme catalysis: substrate binds enzyme to form the ES complex, which decomposes to product and free enzyme | E = enzyme, S = substrate, [ES] = enzyme-substrate complex, P = product | p. 92 |
| \( v_0 = \frac{V_{\max}[S]}{K_m + [S]} \) | Michaelis-Menten equation: initial velocity as a function of substrate concentration | \( v_0 \) = initial velocity, \( V_{\max} \) = maximum velocity, \( K_m \) = Michaelis constant, [S] = substrate concentration | p. 92 |
| \( \Delta E = E_B – E_A = Q – W \) | First law of thermodynamics: change in internal energy | \( \Delta E \) = change in internal energy, \( E_A \), \( E_B \) = energy at start and end, Q = heat absorbed, W = work done by the system | p. 96 |
| \( (S_{\text{system}} + S_{\text{surroundings}}) \gt 0 \) | Spontaneity condition from the second law | S = entropy of the system and of the surroundings | p. 97 |
| \( \Delta G = \Delta H – T\Delta S \) | Free energy, combining the two laws | \( \Delta G \) = free energy change, \( \Delta H \) = enthalpy change, T = absolute temperature, \( \Delta S \) = entropy change | p. 98 |
| \( \Delta E = \Delta H – P\Delta V \) | Internal energy of a closed system at constant pressure | \( P\Delta V \) = work done on surroundings by a volume change | p. 98 |
Units to know: enzyme unit (U) = 1 micromole of substrate per minute under standard conditions; katal (kat) = 1 mole per second, with \( 1\ \text{kat} = 6 \times 10^7\ \text{IU} \) (p. 91); ATP hydrolysis to ADP + Pi releases \( 7.3\ \text{kcal/mol} \) (p. 100).
Key Terms Defined in This Chapter
Quick lookup list — each term as the book defines it, with the page where it appears.
- Biocatalyst — a substance that speeds up a biochemical reaction without being consumed; enzymes are biocatalysts (p. 85).
- Ribozyme — a catalytic RNA molecule; the small group of enzymes that are not proteins (p. 85).
- Holoenzyme — the complete enzyme plus its cofactor (p. 86).
- Apoenzyme — the protein part of a cofactor-requiring enzyme (p. 86).
- Coenzyme — the organic cofactor, usually vitamin-derived, that carries specific functional groups (p. 86).
- Prosthetic group — a coenzyme or metal ion tightly bound to the enzyme protein by a covalent bond (p. 86).
- Isozyme (isoenzyme) — multiple molecular forms of an enzyme catalysing the same reaction with different physicochemical properties (p. 87).
- Active site — the pocket or cleft, a small part of the enzyme, where the substrate fits and catalysis happens (p. 88).
- Lock and key model — Fischer’s 1894 idea that the active site is pre-shaped to fit the substrate exactly (p. 88).
- Induced fit model — Koshland’s 1958 idea that the substrate induces a conformational change in the flexible active site (p. 88).
- Group / absolute / stereochemical / geometrical specificity — acting on closely related substrates; on one substrate only; on one optical isomer; on cis or trans forms (p. 89).
- Optimum temperature / optimum pH — the temperature or pH at which an enzyme’s activity is maximum (pp. 89-90).
- Saturation — the state where all enzyme molecules are occupied, so more substrate no longer raises the rate (p. 91).
- Enzyme unit (U) — the amount of enzyme converting 1 micromole of substrate per minute under standard conditions (p. 91).
- Katal — the SI unit of enzyme activity: 1 mole of substrate per second (p. 91).
- Specific activity — enzyme activity per milligram of enzyme protein; a measure of purity (p. 91).
- Activation energy — the free energy needed to reach the transition state; enzymes lower it (pp. 91-92).
- Michaelis constant (\( K_m \)) — the substrate concentration at which the initial velocity is half of \( V_{\max} \) (p. 92).
- Competitive / non-competitive / uncompetitive inhibition — inhibition overcome by high substrate; inhibition that lowers \( V_{\max} \) by binding away from the active site; inhibition by binding only the ES complex (pp. 93-95).
- Allosteric enzyme — an enzyme with a regulatory site, showing sigmoidal kinetics, that regulates metabolic pathways (p. 95).
- Thermodynamics — the branch of physical chemistry dealing with energy changes (p. 96).
- System and surroundings — the matter in a defined region and the rest of the universe (p. 96).
- Entropy (S) — the degree of randomness or disorder of a system (p. 97).
- Enthalpy — the heat content change of a system (p. 98).
- Free energy — the useful work theoretically available from a reaction (p. 98).
- Exergonic / endergonic — energy-releasing / energy-consuming processes (p. 99).
- ATP, ADP, AMP — adenine + ribose + three, two or one phosphate groups; the energy currency and its hydrolysis products (p. 100).
Common Mistakes Students Make in This Chapter
These are the errors the chapter’s own wording sets traps for. Each row names the wrong belief, the correct rule, and a quick way to check yourself.
| Mistake | Correct rule | How to check your answer |
|---|---|---|
| Enzymes change the equilibrium or \( \Delta G \) of a reaction | Enzymes lower activation energy only; they speed up the attainment of equilibrium but cannot alter \( \Delta G \) or the equilibrium position (pp. 91-92) | Ask: would the reaction still happen without the enzyme? If yes, the enzyme only makes it faster |
| Every enzyme works best near \( 37^\circ\text{C} \) | Most human enzymes are optimal near \( 37^\circ\text{C} \), but Taq DNA polymerase from Thermus aquaticus stays active near \( 100^\circ\text{C} \) (p. 90) | Check the source organism before quoting an optimum temperature |
| More substrate always speeds up an enzyme reaction | Rate rises only until enzyme molecules are saturated; beyond that, substrate is no longer the limiting factor (pp. 90-91) | Look for the plateau in the rate-versus-substrate graph |
| Confusing the three inhibition types | Competitive: \( K_m \) up, \( V_{\max} \) unchanged. Non-competitive: \( V_{\max} \) down, \( K_m \) unchanged. Uncompetitive: both change (pp. 93-95) | Use the plot shorthand: horizontal shift = \( K_m \) change, vertical drop = \( V_{\max} \) change |
| Living cells violate the second law of thermodynamics | Local order is bought by consuming food or light energy and releasing heat; total entropy of system plus surroundings still increases (p. 97) | Always include the surroundings when judging entropy change |
| Using enzyme unit and katal interchangeably | U is 1 micromole per minute; katal is 1 mole per second; \( 1\ \text{kat} = 6 \times 10^7\ \text{IU} \) (p. 91) | Compare the units — micromole per minute versus mole per second |
| Assuming all enzymes are proteins | Almost all are proteins, but ribozymes are catalytic RNA molecules (p. 85) | The word “ribozyme” itself signals RNA |
Exam Notes: What to Practise from This Chapter
The chapter’s own exercises are the best check of your understanding. The table below maps all eleven exercise questions to the textbook page that answers each one, so you can revise each topic to its source. Note that textbook contents and the examinable syllabus are not always identical — check the current official CBSE syllabus.
| Question | What it tests | Answer source | What a full answer needs |
|---|---|---|---|
| 1 (multiple-choice) | What an enzyme must do to catalyse a reaction | pp. 91-92 | The enzyme must decrease the activation energy — it does not change the equilibrium constant or raise the activation energy |
| 2 | Pepsin’s optimum pH and the duodenum | p. 90 | State the acidic optimum (pH 1-2); the duodenum is alkaline, far from the optimum, so pepsin’s activity falls sharply — at extreme pH an enzyme becomes totally inactive |
| 3 | Vitamins and enzyme co-factors | p. 86 | Most coenzymes are derived from vitamins: the vitamin is the precursor, the coenzyme is the working carrier |
| 4 | Temperature, pH and substrate concentration | pp. 89-91 | Describe the two bell-shaped curves with optimum values, the saturation plateau, and the exceptions (Taq polymerase, pepsin) |
| 5 (multiple-choice) | Rate-determining step of Michaelis-Menten kinetics | p. 92 | The ES complex is the intermediate during catalysis; the rate-determining step is the decomposition of the ES complex into product and free enzyme (option a). The question’s diagram is not reproduced on this page, but the kinetics text on page 92 carries the answer |
| 6 | Define \( K_m \) and its significance | p. 92 | \( K_m \) = substrate concentration at half \( V_{\max} \); state the three limiting behaviours of the equation |
| 7 | One unit of enzyme | p. 91 | 1 micromole of substrate converted per minute under standard conditions |
| 8 | Specific activity | p. 91 | Enzyme activity per milligram of enzyme protein; a measure of purity |
| 9 | First and second laws of thermodynamics | pp. 96-98 | Conservation of energy (first law); entropy of the universe always increases (second law), with the spontaneity condition |
| 10 | Entropy and free energy | pp. 97-98 | Entropy is disorder; \( \Delta G = \Delta H – T\Delta S \) connects them, and \( \Delta G \) is the useful work available |
| 11 | ATP as universal energy currency | pp. 99-100 | ATP transfers free energy from exergonic to endergonic processes; made from ADP + Pi, it splits back releasing \( 7.3\ \text{kcal/mol} \) |
Quick Revision Summary of Chapter 4
Night-before recap, built from the chapter’s own summary points.
- Enzymes are biocatalysts that speed up biochemical reactions in living systems.
- Each enzyme has an active site into which the substrate fits; the lock and key hypothesis has been modified into the induced fit hypothesis.
- Temperature, pH, substrate concentration, inhibitors and activators all change the rate of enzyme-catalysed reactions.
- Enzymes lower the activation energy of the reaction they catalyse; they do not change its equilibrium.
- Single-substrate reactions follow Michaelis-Menten kinetics, with a hyperbolic \( v_0 \)-versus-[S] graph.
- Competitive, non-competitive and uncompetitive inhibitors slow or stop reactions; allosteric enzymes show sigmoidal kinetics and regulate metabolic pathways.
- Bioenergetics deals with the transformation and use of energy by living cells.
- The first law of thermodynamics: energy can neither be created nor destroyed, only converted between forms.
- The second law: the entropy or disorder of the universe is always increasing.
- Combining the two laws gives free energy, the useful work theoretically available.
- Photosynthetic organisms derive free energy from sunlight; chemotrophs get it by oxidising food.
- Free energy is partly converted into ATP, the universal currency: ATP is made from ADP + Pi in energy-releasing processes and split back into ADP + Pi in energy-requiring ones.
Related Resources
This listing is maintained for the 2026-27 academic session using the NCERT textbook information available to us. NCERT remains the authority for confirming the latest edition.
Continue studying the same book — the chapters around this one cover the molecules and processes enzymes work on.
- Class 11 Biotechnology notes — notes for the chapters of this book
- Chapter 3: Biomolecules — the previous chapter
- Chapter 5: Cellular Processes — the next chapter
- Class 11 hub — notes across all subjects
- CBSE notes home — all class and subject notes
For the official current edition of the textbook, visit the NCERT portal at ncert.nic.in.
Sources and Data Verification
- The page numbers, figures and facts above describe the NCERT Class 11 Biotechnology textbook, Chapter 4 (Enzymes and Bioenergetics), official NCERT edition.
- This page covers Chapter 4 of that book only — not other chapters of the book, and not other biotechnology textbooks.
- The page is maintained for the current academic session using the NCERT information available to us.
- NCERT settles the textbook, its editions and its official PDFs; CBSE settles the curriculum, syllabus and examinations. Textbook contents and the examinable syllabus are not always identical, so check the current official syllabus.
Frequently Asked Questions
What is the difference between competitive, non-competitive and uncompetitive inhibition?
A competitive inhibitor resembles the substrate and binds the active site: only ES or EI forms, \( K_m \) rises, \( V_{\max} \) is unchanged, and high substrate overcomes it. A non-competitive inhibitor binds a separate site: ESI forms but makes no product, \( V_{\max} \) drops, \( K_m \) is unchanged, and extra substrate cannot overcome it.
An uncompetitive inhibitor binds only the ES complex, and both \( K_m \) and \( V_{\max} \) change (pp. 93-95).
Why is ATP called the universal energy currency of the cell?
Because the same molecule carries free energy in all organisms. ATP transfers free energy from exergonic (energy-releasing) processes to endergonic (energy-consuming) ones: it is built from ADP and inorganic phosphate during breakdown reactions, and it donates energy by splitting back into ADP and Pi, releasing about \( 7.3\ \text{kcal/mol} \) (pp. 99-100).
What is Km in the Michaelis-Menten equation and why does it matter?
\( K_m \), the Michaelis constant, is the substrate concentration at which the initial velocity is half of \( V_{\max} \). It matters because it is a characteristic of a given enzyme-substrate pair: when [S] equals \( K_m \), \( v_0 = V_{\max}/2 \); below \( K_m \) the rate is nearly proportional to [S], and well above it the rate approaches \( V_{\max} \) (p. 92).
Does an enzyme change the equilibrium of a reaction?
No. An enzyme lowers the activation energy, so the reaction reaches equilibrium faster, but it cannot alter the free-energy change \( \Delta G \) or the equilibrium position. The book states this directly: enzymes cannot change the laws of thermodynamics (pp. 91-92).
Do living organisms violate the second law of thermodynamics?
No. Life is a state of high order (low entropy), but that order is maintained only for a while, by consuming chemical energy (food) or light energy and releasing heat or doing work. When system and surroundings are counted together, total entropy still increases — and after death and decomposition, equilibrium and maximum entropy are certain (p. 97).
What is the optimum pH of pepsin and what happens to it when it enters the duodenum?
Pepsin’s optimum pH is 1-2, which is acidic. The duodenum is alkaline — far outside that range — so pepsin’s activity drops sharply there, because below or above the optimum pH an enzyme’s activity is much lowered and at extreme pH it becomes totally inactive (p. 90).
Reference: NCERT Class 11 Biotechnology textbook, chapter 4, official edition on ncert.nic.in.
Explore Class 11 Biotechnology Books
- Previous: Biomolecules
- Next: Cellular Processes
Related chapters:
- An Introduction to Biotechnology
- G.N. Ramachandran (1922–2001)
- Basic Principles of Inheritance