
These are revision notes for Chapter 2: The World Population — Distribution, Density and Growth of the NCERT textbook Fundamentals of Human Geography (Class 12), prepared for the 2026-27 session.
The page condenses the chapter into short notes: every key concept, all three formulas, both NCERT figures, three worked examples with fresh numbers, and guidance for every textbook exercise — so you can revise with the book closed and save the quick revision summary for the very end.
This page sits inside the Class 12 Geography notes hub of this site. The chapter builds the whole unit on one claim: people are a country’s real wealth. People are the actual resources — they farm the land, extract the minerals and shape the policies, so a nation is ultimately known by its people.
From that starting point the chapter asks four questions: where the world’s people live, how crowded their land is, how and why population changes, and how societies control that change. Use the table of contents below to jump to any part.
Chapter 2 at a Glance: People as a Country’s Real Wealth
Keep the chapter’s four movements in your head — every section below is one of these four:
- Patterns of population distribution — how people are spread over the earth’s surface; nearly all of humanity crowds into a small fraction of the land.
- Density of population — the ratio of people to land, measured in persons per sq km.
- Growth of population — how numbers change through births, deaths and migration, the terms used to measure growth, and the three stages of demographic transition.
- Population control — the measures societies use to limit growth, and Thomas Malthus’s warning that population can outrun the food supply.
The chapter’s two figures carry the two big ideas: Fig 2.1 shows where the world’s people concentrate, and Fig 2.2 shows how a population’s growth changes as a society modernises.
Patterns of Population Distribution: Where the World’s People Live
Population distribution is the term for how people are spaced across the earth’s surface. Reading distribution and density together is how geographers understand the demographic character of any area (NCERT, p. 7). The chapter’s master pattern: 90 per cent of the world’s population lives on about 10 per cent of its land area.
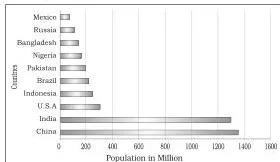
Fig 2.1 is the visual evidence for that unevenness. The textbook pairs it with three numbers you should know exactly (NCERT, p. 7):
- The ten most populous countries contribute about 60 per cent of the world’s population.
- Of those ten, six are located in Asia.
- At the start of the 21st century the world held over 6 billion people.
The textbook deliberately leaves one task to the figure: ‘Identify these six countries of Asia.’ Read the ten countries off Fig 2.1 and sort them by continent — the figure is the answer key, so use it rather than memory.
The chapter later quotes the geographer George B. Cressey, who remarked that Asia has many places where people are few but only a few places where people are very many — an unevenness the textbook extends to the whole world.
Density of Population: The Ratio of People to Land
Every unit of land has a limited capacity to support the people living on it, so geographers need the ratio between the number of people and the size of the land. That ratio is the density of population, normally measured in persons per sq km (NCERT, p. 8):
\[ \text{Density of Population} = \frac{\text{Population}}{\text{Area}} \]
Interpretation is simple: a high value means many people share each square kilometre (crowding), and a low value means settlement is sparse. Because density removes the size of the land from the comparison, it lets you contrast regions fairly — the Ganga plains against the Himalayan zone, for instance.
Factors That Influence Distribution: Three Groups in One Table
The textbook organises the reasons people live where they do into three factor sets (NCERT, pp. 8–9):
| Factor group | What attracts (or repels) people | Textbook example |
|---|---|---|
| Geographical | Water for drinking, farming and industry; flat land and gentle slopes; comfortable climate; fertile soils. | River valleys and the Ganga plains are densely populated; the Himalayas are scarcely populated; the Mediterranean was settled early for its pleasant climate. |
| Economic | Mineral deposits, urbanisation and industrial belts — all of which create jobs and services. | The Katanga-Zambia copper belt in Africa; megacities that keep attracting rural migrants; the Kobe-Osaka industrial region of Japan. |
| Social and cultural | Religious or cultural significance; stability. People move away from social and political unrest; governments may offer incentives to shift from overcrowded places. | Places of religious or cultural significance draw people in; unrest pushes them out. |
The textbook plants two reflection prompts here: can you name an Indian area that is thinly populated because of poor soils, and some unpleasant aspects of city life? They are thinking points — the chapter expects your own examples, not a memorised list.
These same factors become the skeleton of a long exercise answer, so the table doubles as your essay outline.
Growth and Growth Rate: The Core Population Terms
Population growth (or population change) is the change in the number of inhabitants of a territory over a specific period; it can be positive or negative and is expressed either in absolute numbers or as a percentage. Population change also serves as an indicator of a region’s economic development, social upliftment, and historical and cultural background (NCERT, p. 9).
The table below separates the four terms students most often mix up, each with a made-up miniature example.
| Term | What it measures | One-line example |
|---|---|---|
| Growth of population | Change in absolute numbers between two points of time. | A town goes from 10,000 to 12,000 people — growth is 2,000 people. |
| Growth rate of population | The same change written as a percentage. | 2,000 gained on a base of 10,000 is a 20 per cent growth rate. |
| Natural growth | Births minus deaths; migration ignored. | 500 births − 200 deaths = 300 people of natural growth. |
| Actual growth | Natural growth adjusted for migration: births − deaths + in-migration − out-migration. | 500 − 200 + 150 in − 50 out = 400 people of actual growth. |
Positive growth happens when births exceed deaths, or when people migrate in permanently. Negative growth — the chapter’s edge case — is population decreasing between two points of time: the birth rate falls below the death rate, or people emigrate.
That edge case goes to work in the map-skill exercise, which asks you to plot the countries of Europe and Asia whose population actually fell (see the exercise section).
Components of Population Change: Births, Deaths and Migration
Only three things can change a population’s size: births, deaths and migration (NCERT, p. 9). Births add to it, deaths remove from it, and migration moves people between regions. Each gets a rate so that populations of very different sizes can be compared.
Crude Birth Rate (CBR) is the number of live births in a year per thousand of population:
\[ CBR = \frac{B}{P} \times 1000 \]
Here B is the live births during the year and P is the estimated mid-year population of the area.
Crude Death Rate (CDR) measures mortality the same way — deaths in a year per thousand of population:
\[ CDR = \frac{D}{P} \times 1000 \]
Here D is the number of deaths in the year. The × 1000 is what makes the result read ‘per thousand’ — these are comparison rates, not percentages.
Remember that growth can rise even with an unchanged birth rate, simply because the death rate falls; mortality in a region is shaped by its demographic structure, its social advancement and its level of economic development (NCERT, p. 9).
Migration: Origin, Destination, and the Push-Pull Story
When people move, the place they leave is the place of origin and the place they settle in is the place of destination. The origin loses population; the destination gains it. Migration is often a spontaneous effort to strike a better balance between population and resources (NCERT, p. 10). Three facts about movement matter for definitions:
- Movement can be permanent, temporary or seasonal.
- It can run rural-to-rural, rural-to-urban, urban-to-urban or urban-to-rural.
- The same person is simultaneously an emigrant (leaving the origin) and an immigrant (arriving at the destination) — the label depends on which place you are standing in.
Two factor sets drive migration (NCERT, p. 10):
| Factor set | What it does | Reasons in this set |
|---|---|---|
| Push factors | Make the place of origin look less attractive — they push people out. | Unemployment, poor living conditions, political turmoil, unpleasant climate, natural disasters, epidemics, socio-economic backwardness. |
| Pull factors | Make the place of destination look more attractive — they pull people in. | Better job opportunities and living conditions, peace and stability, security of life and property, pleasant climate. |
Memory device: a push always comes from behind, a pull always comes from ahead. The origin’s problems push you out; the destination’s attractions pull you in. Test any single reason with one question — does it belong to the place you are leaving (push) or the place you are going to (pull)?
Demographic Transition Theory: Reading the Three Stages
Demographic transition theory describes — and even predicts — how a region’s population changes as society moves from a rural, agrarian, largely illiterate state to an urban, industrial, literate one: births and deaths both shift from high to low. The sequence of changes is called the demographic cycle (NCERT, p. 10).
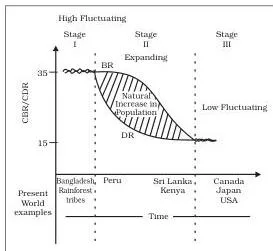
Fig 2.2 plots the model as curves of fertility and mortality across the three stages. Read the gap between the two curves — that gap is the growth. Here is the walkthrough:
- Stage I: both fertility and mortality are high and sit close together, so growth is slow. People reproduce more to compensate for deaths from epidemics and variable food supply; most work in agriculture, where large families are an asset; life expectancy and technology levels are low. Two hundred years ago all the countries of the world were in this stage (NCERT, p. 10).
- Stage II: fertility stays high at the start and declines only with time, while mortality falls because of better sanitation and health. The gap between the curves widens — and that widening gap is the high net addition to population the chapter describes (NCERT, p. 11). This is the stage of fastest growth.
- Stage III: both fertility and mortality decline considerably and the curves come close together again. The population is stable or grows slowly; society is urbanised, literate, technically advanced, and deliberately controls family size (NCERT, p. 11).
Today different countries sit at different stages, and the model shows how flexible human fertility is — people adjust their family size to circumstances. The stage table below doubles as the answer skeleton for the 150-word exercise on demographic transition:
| Stage | Birth rate | Death rate | Population growth | Society at this stage |
|---|---|---|---|---|
| I | High | High | Slow | Agrarian, illiterate, low life expectancy, large families valued. |
| II | High at first, then falling | Falling (better sanitation and health) | High net addition | The birth-death gap widens — fastest growth. |
| III | Low | Low | Stable or slow | Urbanised, literate, high technical know-how, deliberate family-size control. |
Population Control Measures and Malthus’s Warning
Family planning — spacing or preventing the birth of children — is the foundation. Access to family planning services limits population growth and improves women’s health. Around it the textbook lists three supporting measures (NCERT, p. 11): propaganda (spreading awareness), free availability of contraceptives, and tax disincentives for large families.
Thomas Malthus, in his 1798 theory, argued that the number of people would increase faster than the food supply; any further increase would end in a population crash through famine, disease and war. His conclusion: preventive checks are better than physical checks — it is better to prevent the problem than to let nature correct it brutally.
The chapter closes with its purpose: for the sustainability of our resources, the world will have to control rapid population increase (NCERT, p. 11).
Key Terms in This Chapter: Definitions Table
Every term the chapter defines, compressed to one line each (NCERT, pp. 7–11):
| Term | Meaning | Example |
|---|---|---|
| Population distribution | How people are spread across the earth’s surface. | Most of humanity clusters on a small share of the land. |
| Density of population | The ratio between the number of people and the size of the land, in persons per sq km. | 2,000 persons per sq km (worked example 1). |
| Growth of population | Change in a population between two points of time, in absolute numbers. | A town grows from 10,000 to 12,000 — growth is 2,000. |
| Growth rate | The same change expressed as a percentage. | 2,000 on a base of 10,000 is 20 per cent. |
| Natural growth | Increase from births minus deaths only (migration ignored). | 500 births − 200 deaths = 300. |
| Actual growth | Natural growth plus net migration: births − deaths + in-migration − out-migration. | 300 + 150 in − 50 out = 400. |
| Positive growth | Population rises — births exceed deaths, or permanent in-migration occurs. | A city whose population grows every decade. |
| Negative growth | Population falls between two points of time — deaths exceed births, or people emigrate. | A country whose population shrinks between two censuses. |
| Crude birth rate | Live births in a year per thousand people. | 14 live births per thousand (worked example 2). |
| Crude death rate | Deaths in a year per thousand people. | 5 deaths per thousand (worked example 3). |
| Place of origin | The place a migrant leaves; its population decreases. | The village a worker departs from. |
| Place of destination | The place a migrant arrives at; its population increases. | The city the worker settles in. |
| Immigration | Entering a new place as a migrant. | The same worker, seen from the city’s side. |
| Emigration | Leaving a place as a migrant. | The same worker, seen from the village’s side. |
| Push factor | A condition of the origin that drives people away. | Unemployment, epidemics, political turmoil. |
| Pull factor | An attraction of the destination that draws people in. | Better jobs, peace and security, pleasant climate. |
| Family planning | Spacing or preventing the birth of children on purpose. | Using contraceptives to limit family size. |
Formulas Used in This Chapter
All three formulas in one place, with every symbol defined. The density formula is on page 8 and the two rates on page 9 of the chapter. If you want to check any formula or figure against the print layout, the official NCERT chapter PDF on ncert.nic.in is the source.
| Formula | Symbols | Unit |
|---|---|---|
| \( \text{Density} = \frac{\text{Population}}{\text{Area}} \) | Population in persons; Area in sq km | persons per sq km |
| \( CBR = \frac{B}{P} \times 1000 \) | B = live births in the year; P = estimated mid-year population | live births per thousand people |
| \( CDR = \frac{D}{P} \times 1000 \) | D = deaths in the year; P = estimated mid-year population | deaths per thousand people |
The × 1000 exists so the result reads per thousand people — the standard convention for comparing regions of very different sizes. A CBR of 14 means 14 live births for every thousand people in that year, not 14 per cent.
Worked Examples: Density, Crude Birth Rate and Crude Death Rate
Three practice calculations with fresh numbers. Use the same shape in your own answer: name the formula, list the given values with their units, substitute, calculate, then state the answer with its unit.
Example 1: Density of population
Step 1: Name the formula: \( \text{Density} = \frac{\text{Population}}{\text{Area}} \).
Step 2: Given — Population = 5,00,000 persons; Area = 250 sq km.
\[ \text{Density} = \frac{5{,}00{,}000}{250} = 2{,}000 \]
Final answer: The density is 2,000 persons per sq km — a crowded region.
Example 2: Crude birth rate
Step 1: Name the formula: \( CBR = \frac{B}{P} \times 1000 \).
Step 2: Given — B = 700 live births in the year; P = 50,000 (estimated mid-year population).
\[ CBR = \frac{700}{50{,}000} \times 1000 = 14 \]
Final answer: The crude birth rate is 14 live births per thousand people for that year.
Example 3: Crude death rate
Step 1: Name the formula: \( CDR = \frac{D}{P} \times 1000 \).
Step 2: Given — D = 400 deaths in the year; P = 80,000 (estimated mid-year population).
\[ CDR = \frac{400}{80{,}000} \times 1000 = 5 \]
Final answer: The crude death rate is 5 deaths per thousand people for that year.
Common Mistakes Students Make in This Chapter
Misconception autopsy: a high birth rate alone does not mean fast growth
It feels logical that many births should mean fast growth — but the chapter’s own model contradicts it. Growth comes from the gap between births and deaths:
- Stage I: births are high, but so are deaths; the curves sit close, the gap is small, and growth is slow.
- Stage II: deaths fall (better sanitation and health) while births stay high for a while; the gap widens, and the net addition to population is high.
- Stage III: both are low; the gap is small again; growth is stable or slow.
So the same high birth rate produces slow growth in stage I and fast growth in stage II — the difference lies entirely in what the death rate is doing. Whenever you are asked why a population is growing fast, look for the birth-death gap, not the birth rate alone.
Migration is the third check: heavy in-migration can raise a population even when the gap is small.
Now the chapter-specific errors, each with its correction and a self-check:
| Common mistake | Correct rule (and why) | How to check your answer |
|---|---|---|
| ‘Natural growth and actual growth are the same.’ | Actual growth adds migration: births − deaths + in-migration − out-migration; natural growth ignores it. | Ask whether anyone moved into or out of the region — if yes, use the actual growth formula. |
| ‘Unemployment is a pull factor.’ | Unemployment is a push factor — it makes the origin less attractive; better jobs are the pull at the destination. | Ask: does this reason belong to the place being left or the place being chosen? |
| ‘Density is area ÷ population’ or ‘density has no units.’ | Density = Population ÷ Area, measured in persons per sq km. | Check that a larger population on the same land gives a larger density, and always write the unit. |
| ‘A high birth rate always means rapid growth.’ | The birth-death gap decides growth, not the birth rate alone (see the autopsy above). | Compare the death rate before judging — the gap is the growth. |
| ‘Immigrant and emigrant are interchangeable.’ | The same mover is an immigrant at the destination and an emigrant at the origin — the label depends on standpoint. | Fix your standpoint first: which place are you talking from? |
| ‘Malthus opposed any form of population control.’ | Malthus argued unchecked growth ends in famine, disease and war; he preferred preventive checks over physical checks. | Recall the crash mechanism: if people outrun the food supply, nature corrects it brutally — prevention is better. |
How to Answer This Chapter’s Exercise Questions
The chapter ends with four question sets, a map skill and a project (NCERT, pp. 11–12). Here is the shape a complete answer takes for each.
Q1 — choose the right answer from four alternatives. Each option survives or dies on one chapter fact:
- The continent with the highest growth is decided by the chapter’s growth data — reread the growth section and match each alternative to its facts rather than guessing.
- ‘Not an area of sparse population’ — apply the sparse-profile test: extreme climates, poor soils and rugged landforms thin out population, so the option that fits none of those is the one to pick.
- ‘Not a push factor’ — measure each option against the push list (unemployment, poor living conditions, political turmoil, unpleasant climate, natural disasters, epidemics, socio-economic backwardness); the option that is an attraction rather than a hardship is the non-push.
- ‘Not a fact’ — both statements are checked against the printed text: the chapter states population increased more than ten times in 500 years, and it also states that the first stage shows slow growth. The option that contradicts the chapter is the non-fact.
Q2 — answer in about 30 words. Three questions share one skeleton: name it, then support it in one sentence.
- Name three geographical factors — any three of water, landforms, climate and soils.
- For areas of high population density, name one or two attractions (a river valley, fertile plains, jobs) and connect each to why people crowd there.
- Name the three components of population change — births, deaths and migration.
Q3 — distinguish between two pairs. A complete answer is a two-column contrast, not two separate definitions:
- Birth rate vs death rate: birth rate counts live births per thousand people in a year; death rate counts deaths per thousand. One adds to the population, the other removes from it.
- Push vs pull factors: push factors drive people away from the origin (unemployment, turmoil, disasters); pull factors attract them to the destination (jobs, peace, pleasant climate).
Q4 — answer in about 150 words. Two essay-style answers, each with a three-part skeleton:
- Factors influencing distribution and density: open with the meaning of distribution and density, organise the body by the three factor groups (geographical, economic, social and cultural) with one example each, and close with the chapter’s claim that people are the real wealth of a country.
- Three stages of demographic transition: open with the definition (change from high births and deaths to low births and deaths), give each stage in one or two sentences covering growth and society, and close with the point that different countries are at different stages today.
Map skill — negative growth of population. Plot and name the countries of Europe and Asia whose population decreased between two points of time. The definition is your instrument: negative growth occurs when the birth rate falls below the death rate, or when out-migration is large.
Locate the countries from population data, mark them on the outline map, and write each name clearly. This is where the negative-growth edge case is put to work.
Project/Activity. The two project tasks are modelled in the next section — they convert the same vocabulary into a real-life write-up.
Try the Chapter’s Project Activities
Activity 1 — the family migration case study. The textbook asks you to write about someone in your family who migrated: their place of destination, and what made them migrate. Here is a model of the shape your write-up could take (details invented for illustration):
‘A relative of mine left a farming village that had faced repeated droughts for a city where factory work was available. The village is the place of origin; the city is the place of destination. The droughts and the loss of harvest were push factors — they made the origin less attractive.
The factory job and better schools were pull factors — they made the destination more attractive. The same person is an emigrant from the village and an immigrant in the city.’
Notice how every sentence uses the chapter’s vocabulary — origin, destination, push, pull, emigrant, immigrant. A report of that shape completes the activity.
Activity 2 — distribution and density in your state. The textbook asks for a brief report on the distribution and density of population in your own state. First present the pattern — where people are concentrated and where they are sparse.
Then explain it with the three factor groups: water, plains, soils and climate (geographical); jobs, industry and cities (economic); and cultural or religious significance (social and cultural). The explanation is where the chapter’s concepts do the real work.
Quick Revision Summary: The Chapter in One Place
The night-before screen. If you remember nothing else, remember this block:
- Key numbers: 90 per cent of the world’s people live on about 10 per cent of its land; the ten most populous countries hold about 60 per cent, six of them in Asia; the world crossed 6 billion at the start of the 21st century; population increased more than ten times in 500 years and four times in the twentieth century.
- Three formulas: \( \text{Density} = \frac{\text{Population}}{\text{Area}} \) (persons per sq km); \( CBR = \frac{B}{P} \times 1000 \) (live births per thousand); \( CDR = \frac{D}{P} \times 1000 \) (deaths per thousand).
- Three components of population change: births, deaths, migration.
- Three demographic stages in one line each: stage I — high births and deaths, slow growth; stage II — deaths fall while births stay high, and the gap produces the fastest growth; stage III — both low, stable or slow growth.
- Push-pull in one line: the origin’s problems push people out; the destination’s attractions pull them in.
- Malthus in one line: population grows faster than food supply, so unchecked growth ends in famine, disease and war — preventive checks are better than physical ones.
For the next step, the Human Development notes continue this textbook’s focus on people. You can also jump to any other Class 12 notes, or browse the full CBSE notes library for every class and subject.
Frequently Asked Questions
What is the difference between natural growth and actual growth of population?
Natural growth counts only births minus deaths, ignoring migration. Actual growth adds the movement of people: births − deaths + in-migration − out-migration. Use actual growth when you want the true change in a region’s numbers; natural growth tells you how much of that change came from births and deaths alone.
Why is population growth the fastest in the second stage of demographic transition?
Because mortality falls — better sanitation and health conditions — while fertility stays high at the start of the stage. The widening gap between the two produces the high net addition to population. In stage one the same high birth rate was matched by a high death rate, so growth stayed slow.
Is a high birth rate the only cause of rapid population growth?
No. What drives rapid growth is the gap between births and deaths, not the birth rate alone. And migration is a third component: in-migration raises a population even when the birth-death gap is unchanged.
How are density of population, crude birth rate and crude death rate calculated?
Density = Population ÷ Area, in persons per sq km. Crude birth rate = (B ÷ P) × 1000, giving live births per thousand people; crude death rate = (D ÷ P) × 1000, giving deaths per thousand. In the rates, B is live births in the year, D is deaths in the year, and P is the estimated mid-year population.
What are push factors and pull factors in migration?
Push factors make the place of origin look less attractive — unemployment, poor living conditions, political turmoil, unpleasant climate, natural disasters, epidemics and socio-economic backwardness. Pull factors make the place of destination look more attractive — better job opportunities and living conditions, peace and stability, security of life and property, and a pleasant climate.
Reference: NCERT Class 12 Geography textbook, chapter The World Population: Distribution, Density and Growth.
Explore Class 12 Geography Notes
- Class 12 Geography Notes
- Class 12 CBSE Notes
- CBSE Notes for Classes 1 to 12
- Next: Human Development
Class 12 Geography on LearnCBSE:
Related chapters:
- Primary Activities notes
- Secondary Activities notes
- Tertiary and Quaternary Activities notes
Official source: download the NCERT textbook free from ncert.nic.in.