
These revision notes follow the 2026-27 session and cover the NCERT Class 12 Practical Work in Geography Part-II chapter Data — Its Source and Compilation.
The page gives you the whole chapter in revision form: the exact meanings of data, datum and information, the primary and secondary sources, tabulation, tally marks and frequency tables, the two formulas, and the shape and purpose of ogives.
Use it as a second read — study the chapter once in the textbook, then come back here to revise. Two worked examples with fresh numbers show the index-number calculation and the tally-table technique step by step, and the closing tables compress the whole chapter for a last-minute recap.
To check any definition, table or figure against the book itself, open the official NCERT textbook PDF for this chapter at ncert.nic.in.
This page belongs to the CBSE notes library on this site — it sits in the Class 12 Geography notes collection, inside the wider Class 12 notes for every subject. Reference: NCERT Class 12 Geography textbook, chapter Data — Its Source and Compilation.
How this chapter builds: from raw measurements to graphs
This is Chapter 1 of Practical Work in Geography Part-II, and it reads like one continuous chain: each idea feeds the next. Revise it in this order and the links between ideas stay visible.
- Data and information — what the numbers mean (NCERT, p. 1).
- Why geographers need data — quantitative analysis of patterns such as cropping and city growth (NCERT, p. 2).
- Sources of data — primary versus secondary (NCERT, p. 2).
- Tabulation and classification — turning the jumble of raw data into statistical tables (NCERT, p. 6).
- Grouping into classes — range, class intervals and the four and cross tally method (NCERT, p. 8).
- Frequency distribution — simple and cumulative frequencies, exclusive and inclusive classes (NCERT, pp. 8–10).
- Graphs — the frequency polygon and the ogive (NCERT, pp. 10–11).
The tally, frequency and ogive skills are not one-off tricks. They are the tools the later practical chapters on data processing and graphical representation build on — the data processing notes carry that work forward. Keep this chain in mind and no part of the chapter will feel disconnected.
Data, datum and information: the three terms on page 1
Three terms open the chapter, and mixing them up makes everything after harder. Fix them now.
- Data are numbers that represent measurements from the real world. The word always refers to a collection of measurements, not one value.
- Datum is a single measurement — one value drawn from the real world.
- Information is a meaningful answer to a query, or a meaningful stimulus that can cascade into further queries.
All three definitions come from the opening page of the chapter (NCERT, p. 1). Fresh example: one weather-station reading of 24.6°C is a datum. The list of temperatures recorded through July is data. “This July was the warmest month in ten years” is information — it was deduced from the data, not measured directly.
The chapter warns that raw data alone rarely yields logical conclusions. Information has to be algorithmically derived, logically deduced or statistically calculated from multiple data (NCERT, p. 1). That is why the rest of the chapter exists: collection is only the beginning.
Why geographers need data — and why averages can mislead
Geography has shifted from describing patterns in words to measuring them with numbers. Two chapter examples show why data are now a necessity.
- Cropping pattern of an area — needs statistical information on cropped area, crop yield and production, irrigated area, rainfall, and inputs such as fertiliser, insecticides and pesticides (NCERT, p. 2).
- Growth of a city — needs data on total population, density, number of migrants, occupations, salaries, industries and means of transport and communication (NCERT, p. 2).
So data play an important role in geographical analysis. But the chapter immediately attaches a caution, and it deserves a full decode.
The statistical fallacy: what the average hid
The river-crossing story in the book is a warning about averages. A traveller measured the depth of a river at four points, worked out the average, and then led his family across — his child drowned. The numbers explain why.
| River depth measurement | Depth (m) |
|---|---|
| Point 1 | 0.6 |
| Point 2 | 0.8 |
| Point 3 | 0.9 |
| Point 4 | 1.5 |
| Average | 0.95 |
The average works out to 0.95 m and the child’s height was 1 m — the average looked safe. But the average hid the variation: at one of the four points the river was 1.5 m deep, well over the child’s height. That gap between the summary figure and the real spread is the statistical fallacy (NCERT, p. 2).
The lesson is the chapter’s whole point: collecting the facts and figures is necessary, but equally important is the presentation of data (NCERT, p. 2). Tabulation, grouping and graphs exist precisely to reveal the spread that a lone average hides.
Primary sources of data: the four first-hand methods
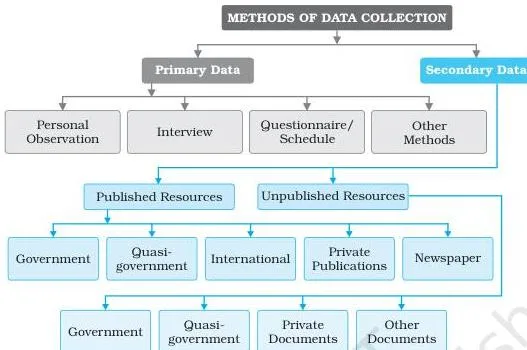
Primary sources are data collected for the first time by an individual, a group of individuals, an institution or an organisation (NCERT, p. 2). Fig. 1.1 is the chapter’s map of this whole section: it shows how every method of data collection falls into either the primary family (first-hand collection) or the secondary family (records someone else already made).
The four primary methods are:
- Personal observations — direct observation in the field. A field survey collects relief features, drainage patterns, soil types, natural vegetation, population structure, sex ratio, literacy, means of transport and communication, and the nature of urban and rural settlements. The observer must carry theoretical knowledge and a scientific attitude so the evaluation stays unbiased (NCERT, p. 3).
- Interview — direct information from the respondent through dialogue. The interview precautions, compressed into their essentials (NCERT, p. 3):
- prepare a precise list of items before starting;
- be clear about the objective of the survey;
- take the respondent into confidence and assure secrecy before any sensitive question;
- create a congenial atmosphere and keep language simple and polite;
- avoid questions that wound self-respect or religious feelings;
- invite additional information at the end, and thank the respondent for the time given.
- Questionnaire / schedule — simple questions with possible answers, where respondents tick the right option; sometimes space is given for the respondent’s opinion, and the objectives of the survey are stated on the sheet. Questionnaires suit large areas and can be mailed, but only literate people can respond to them. The schedule looks identical in content — one difference decides which is which: the respondent fills the questionnaire, while a properly trained enumerator fills the schedule by asking the respondent the questions. That is why schedules can collect information from literate and illiterate respondents alike (NCERT, p. 4).
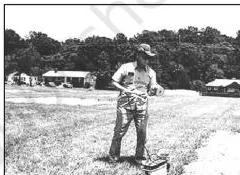
- Other methods — soil and water properties measured directly in the field with a soil kit and a water quality kit; field scientists also measure the health of crops and vegetation using transducers (NCERT, p. 4). Fig. 1.2 shows a field scientist at work on crop health.
Memory hook for questionnaire versus schedule — ask “who holds the pen?” If the respondent writes the answers, it is a questionnaire. If the trained enumerator writes them, it is a schedule.
Secondary sources of data: published and unpublished
Secondary sources are data collected from published or unpublished records, including government publications, documents and reports (NCERT, p. 4). The whole list is easier to revise as two columns.
| Published sources | Unpublished sources |
|---|---|
| Government publications | Government documents |
| Semi/quasi-government publications | Quasi-government records |
| International publications | Private documents |
| Private publications | |
| Newspapers and magazines | |
| Electronic media |
Indian examples make the published column concrete. The Census of India (Office of the Registrar General), the reports of the National Sample Survey, the weather reports of the India Meteorological Department and the Statistical Abstracts of state governments are government publications; Urban Development Authorities, Municipal Corporations and Zila Parishads (District Councils) issue the semi/quasi-government ones (NCERT, pp. 4–5).
Fig. 1.3 shows a few such government publications.

In the unpublished column, the key example is the village-level revenue records maintained by the patwari — an unpublished government document that serves as an important source of village-level information (NCERT, p. 5). Trap to avoid: “government” does not automatically mean “published”.
For an answer on international sources, name the United Nations agencies — UNESCO, UNDP, WHO and FAO — and the United Nations publications such as the Demographic Year Book, the Statistical Year Book and the Human Development Report (NCERT, p. 5). Fig. 1.4 shows some of these UN publications.

Tabulation and classification: the first step after collection
Data straight from the field or the archive are a mess until they are tamed. The chapter names both the problem and the tool.
- Raw data — the big jumble of information that first comes from a survey, carrying the least comprehension (NCERT, p. 6).
- Statistical table — a systematic arrangement of data in columns and rows. Its purpose is to simplify presentation, facilitate comparisons and let a reader locate the desired information quickly (NCERT, p. 6).
Compiled data can be presented in three forms (NCERT, p. 6):
- Absolute terms — the original integers, such as the total population of a country or state or the total production of a crop. The book’s Table 1.1 presents India’s 2011 population this way.
- Percentages or ratios — computed from a common parameter, such as literacy rate, growth rate of population, or the percentage share of agricultural and industrial products.
- Index numbers — statistical measures of change, handled under formulas below.
Definitions at a glance: the terms you must be able to explain
This chapter is dense with paired terms that look alike. The table below is the fastest way to fix each definition — term, meaning and a concrete example.
| Term | Meaning | Example |
|---|---|---|
| Data | Numbers that represent measurements from the real world | Rainfall readings recorded across a district |
| Datum | A single measurement | One day’s temperature reading |
| Information | A meaningful answer to a query, or a stimulus for further queries | “Production rose 15% above last year” |
| Primary source | Data collected for the first time by the user | A field survey you conduct yourself |
| Secondary source | Data drawn from published or unpublished records | Census of India figures used in a report |
| Raw data | The unprocessed jumble of information after collection | 60 student scores before grouping |
| Statistical table | Systematic arrangement of data in columns and rows | Population table with states as rows (Table 1.1) |
| Absolute data | Data presented in their original integer form | Total population of India |
| Index number | Measure of change in a variable or group of variables over time or space | The iron-ore production index in Table 1.3 |
| Simple frequency (f) | Number of observations falling in each class | 10 scores fall in the 50–60 class |
| Cumulative frequency (Cf) | Running total formed by adding each frequency to the previous sum | 27 individuals scored less than 50 |
| Exclusive method | Class excludes its upper limit | The value 30 goes to 30–40, not 20–30 |
| Inclusive method | Class includes both its limits | Classes written 0–9, 10–19, 20–29 |
| Ogive | Curve obtained by plotting cumulative frequencies | The less than ogive in Fig. 1.6 |
Formulas: literacy rate and index number
Only two formulas appear in the chapter, but both must be exact. Every symbol is explained here.
Literacy rate
\[ \text{Literacy rate} = \frac{\text{Total Literates}}{\text{Total Population}} \times 100 \]
This is the percentage form of data presentation. It expresses the number of literates as a share of the total population; the book prints India’s literacy rates from 1951 to 2011 in exactly this form (NCERT, p. 7).
Index number — simple aggregate method
\[ \text{Index number} = \frac{\sum q_i}{\sum q_0} \times 100 \]
- \( \sum q_i \) — total of the current year production.
- \( \sum q_0 \) — total of the base year production.
Base year values are conventionally taken as 100, and the index number is calculated thereupon (NCERT, p. 7). Keeping 100 as the base gives every later index a plain reading: an index of 130 means 30% above the base year.
Index numbers are not limited to time. They also compare economic conditions of different locations, industries, cities or countries (NCERT, p. 7). The working definition worth quoting in an answer: an index number is a statistical measure designed to show changes in a variable or a group of related variables with respect to time, geographic location or other characteristics (NCERT, p. 7).
| Formula | Symbols | What it answers |
|---|---|---|
| \( \frac{\text{Total Literates}}{\text{Total Population}} \times 100 \) | Total Literates and Total Population of the same area | What share of a population is literate — a percentage form of data |
| \( \frac{\sum q_i}{\sum q_0} \times 100 \) | \( \sum q_i \) current-year production; \( \sum q_0 \) base-year production | By how much a quantity has changed compared with the base year |
Grouping raw data: class intervals and the four and cross method
Raw figures mean nothing until they are grouped, and the grouping needs two decisions: how many classes, and how wide each class should be. The range of the raw data settles both (NCERT, p. 8).
The chapter’s example is scores running from 02 to 96; that range fits conveniently into ten classes of ten units each — 0–10, 10–20, and so on up to 90–100 (NCERT, p. 8). Once the classes are fixed, each value is placed in its group using the four and cross method, the tally technique the chapter teaches (NCERT, p. 8).
- Assign one tally mark to each individual in the group where it falls.
- Mark the first four observations in a class as four vertical strokes.
- Mark the fifth observation as a diagonal stroke crossing the four.
In the book’s table the very first raw value is 47, and it falls in the 40–50 group — that group receives the first tally mark (NCERT, p. 8).
Memory device — build a fence: picture four upright fence posts. The fifth stroke is the diagonal rail that locks them into one bundle. Every locked bundle means five, so you count bundles of five instead of single strokes — that is the entire point of the four and cross method.
Frequency distribution: simple, cumulative, exclusive and inclusive
Once the tally is complete, the counts become a frequency distribution — a table showing how the values of a variable are distributed across the classes (NCERT, p. 9). Two kinds of frequency matter.
- Simple frequency (f) — the number of individuals falling in each group. The sum of all simple frequencies equals N, the total number of observations in the series: \( \sum f = N \) (NCERT, p. 9). In the book’s example \( \sum f = N = 60 \).
- Cumulative frequency (Cf) — the running total obtained by adding each successive simple frequency to the previous sum. The final cumulative frequency equals N (NCERT, p. 9).
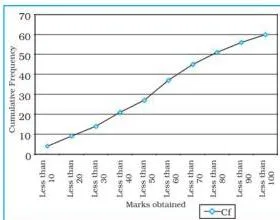
Why is Cf worth computing? Because it answers “how many are below this level?” in one glance. From the chapter’s table you can read directly that 27 individuals scored less than 50, and 45 of the 60 scored below 70 (NCERT, p. 9).
Exclusive versus inclusive classes
Classes can be formed in two ways, and the entire difference is where a boundary value goes.
| Question | Exclusive method | Inclusive method |
|---|---|---|
| How classes are written | 20–30, 30–40, 40–50 | 20–29, 30–39, 40–49 |
| Upper limit of a class | Excluded — it belongs to the next class | Included in the same class |
| Where does the value 30 go? | To 30–40, because a class excludes its upper limit | To 30–39, because both limits are included |
| Width of each class | Ten units (20, 21, …, 29 by “20 and under 30”) | Ten units (20, 21, …, 29) |
The exclusive method carries its name for exactly this reason: a group is excluded of its upper limits (NCERT, p. 9). In the book the exclusive classes read “0 and under 10”, “10 and under 20”, and so on.
Under the inclusive method a value equal to the upper limit stays in its own class, and each group still spreads over ten units — the class 50–59 holds 50, 51, …, 59 (NCERT, p. 10).
Graphical presentation: frequency polygon and ogives
The final step turns frequency tables into curves. Two graphs matter.
Frequency polygon
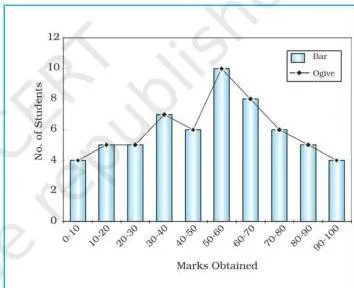
A frequency polygon is a graph of a frequency distribution drawn as a line. Its special strength is comparison: it helps compare two or more frequency distributions on the same figure (NCERT, p. 10). Fig. 1.5 shows a frequency distribution polygon.
Ogive: less than and more than
Adding frequencies produces cumulative frequencies, which are listed in a cumulative frequency table. The curve obtained by plotting cumulative frequencies is called an ogive, pronounced ojive (NCERT, p. 10). It can be built in two ways.
- Less than method — start with the upper limits of the classes and go on adding the frequencies (NCERT, p. 10). Plotting those points gives a rising curve, the less than ogive of Fig. 1.6.
- More than method — start with the lower limits of the classes and, from the cumulative frequency, subtract the frequency of each class (NCERT, p. 10). Plotting those points gives a declining curve, the more than ogive of Fig. 1.7.
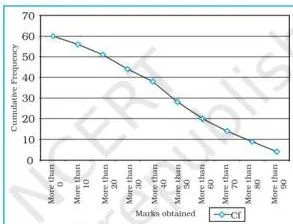
Draw both curves on the same axes and you get a comparative picture of the two methods. Fig. 1.8 combines them, and Table 1.10 in the book lists the paired values behind the curves.
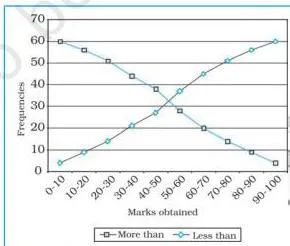
Direction check: the less than curve rises because frequencies are being added, and the more than curve falls because frequencies are being subtracted. If a sketch contradicts that, the method has been misread.
Worked examples: index number and tally table with fresh data
Two fully worked examples with original numbers, so you can practise the skills without borrowing the book’s values. In an answer, always name the method before working — as each example does below.
Worked example A — index number by the simple aggregate method
Step 1: Fix the base year.
Take wheat production of 40 million tonnes in the base year 2020-21 as \( \sum q_0 = 40 \) million tonnes; the base index is set to 100.
Step 2: For each later year, apply the formula \( \text{Index} = \frac{\sum q_i}{\sum q_0} \times 100 \), where \( \sum q_i \) is that year’s production.
Both quantities are in million tonnes, so the units cancel and the index is a pure number.
\[ 2021\text{-}22:\ \frac{48}{40} \times 100 = 1.2 \times 100 = 120 \]
\[ 2022\text{-}23:\ \frac{56}{40} \times 100 = 1.4 \times 100 = 140 \]
\[ 2023\text{-}24:\ \frac{62}{40} \times 100 = 1.55 \times 100 = 155 \]
| Year | Wheat production (million tonnes) | Index number |
|---|---|---|
| 2020-21 (base year) | 40 | 100 |
| 2021-22 | 48 | 120 |
| 2022-23 | 56 | 140 |
| 2023-24 | 62 | 155 |
Final answer: the index rises 100 → 120 → 140 → 155. Each value reads as a percentage of the base year: in 2023-24 wheat production stood 55% above the base-year level.
Worked example B — four and cross tally with exclusive classes
Sixteen scores: 22, 35, 41, 28, 50, 47, 33, 39, 26, 44, 31, 48, 38, 42, 29, 45. Group them into the classes 20–30, 30–40, 40–50 and 50–60 by the exclusive method.
- Step 1: Name the method — the four and cross tally method, with classes formed by the exclusive method.
- Step 2: Fix the range.
The scores run from 22 to 50, so four exclusive classes of ten units work: 20–30, 30–40, 40–50, 50–60.
Step 3: Apply the boundary rule to the top value.
The highest score, 50, is the upper limit of the 40–50 class, so it is excluded there and placed in 50–60, where it is the lower limit.
Step 4: Mark one tally for every score in its class, then build the frequency and cumulative frequency columns.
In the tally column, a bundle of five is drawn as four vertical strokes with the fifth stroke crossing them.
| Class (exclusive) | Tally marks | f | Cf |
|---|---|---|---|
| 20–30 | 4 strokes | 4 | 4 |
| 30–40 | 5 — one crossed bundle | 5 | 9 |
| 40–50 | 6 — crossed bundle + 1 | 6 | 15 |
| 50–60 | 1 stroke | 1 | 16 |
| Total | \( \sum f = 16 \) |
Step 5: Verify the total.
\( \sum f = 4 + 5 + 6 + 1 = 16 = N \), so no score was lost or double-counted, and the final cumulative frequency matches N.
Final answer: the tally table is complete, the cumulative frequencies are 4, 9, 15 and 16, and \( \sum f = N = 16 \). Notice where the boundary value landed: 50 was the tricky score in this set, and the exclusive rule sent it to 50–60.
Common mistakes: where students slip in this chapter
Seven confusions produce most of the wrong answers in this chapter. Each row gives the mistake, the correct rule, and a quick self-check.
| Mistake | Correct rule | How to check your answer |
|---|---|---|
| Treating data and information as the same thing | Data are raw measurements; information is the meaningful answer obtained after processing data | Ask: was this number processed, or is it the measurement itself? |
| Treating a questionnaire and a schedule as identical | The respondent fills a questionnaire; a trained enumerator fills a schedule | Ask: who holds the pen — the respondent or the enumerator? |
| Confusing primary and secondary sources | Primary data are collected for the first time by the user; secondary data come from published or unpublished records | Trace the first collection: your own survey is primary, the record you read is secondary |
| Assuming every government record is published | Many official records stay unpublished; the patwari’s village-level revenue records are unpublished government documents | Place the source in the published or unpublished column before classifying it |
| Putting the boundary value 30 in the 20–30 class | In the exclusive method a class excludes its upper limit, so 30 belongs to 30–40 | Rewrite the class as “20 and under 30” and re-place the value |
| Expecting the less than ogive to slope down | The less than ogive rises; the more than ogive falls | Plot one pair of points: “less than 50” must sit above “less than 40” |
| Writing the base-year index as 0 | The base year is conventionally taken as 100 | Check the base-year row: production ÷ own production × 100 = 100 |
How to structure answers to the textbook exercises
The exercises at the end of the chapter (NCERT, p. 12) test exactly the material above. These are answer-building patterns, not written-out answers — use them to organise what you already know.
- The 30-word questions — open each with a one-line definition or distinction, then add one example or point of contrast.
- Data versus information: start “Data are raw measurements; information is the meaningful answer obtained after processing them.”
- Data processing: start with the chapter’s idea — processing means the tabulation and classification of raw data into selected classes, which reduces its volume and makes it easy to understand (NCERT, p. 7).
- Advantage of a footnote: a footnote is a note below a table that clarifies special cases. The footnotes under Table 1.1, for instance, record that Chandigarh is a Union Territory and that some figures are exclusive of PoK — footnotes keep such exceptions out of the table’s body while keeping the table accurate.
- Primary sources: give the definition — data collected for the first time — then one method, such as a personal observation or an interview.
- Five secondary sources: name five of the six categories — government publications, semi/quasi-government publications, international publications, private publications, newspapers and magazines, electronic media.
- The 125-word question on national and international agencies — split the answer into two halves: first published versus unpublished sources, then Indian agencies (Census of India, National Sample Survey, India Meteorological Department, state Statistical Abstracts) and United Nations agencies (UNESCO, UNDP, WHO, FAO) with their flagship publications (Demographic Year Book, Statistical Year Book, Human Development Report).
- Index number question — write the formula, define \( \sum q_i \) and \( \sum q_0 \), show one short calculation (for example, a base year of 40 units giving 120 when the current figure is 48), then state what a rising index means: the quantity has increased relative to the base year.
- The activity — find the range of the scores, choose class intervals from the range, apply the four and cross method, and close by verifying that \( \sum f = N \).
Revision recap: the chapter in three tables
A night-before summary. Nothing new appears here — it is the whole chapter compressed into three tables.
Table 1 — sources of data
| Category | What it means | Two examples |
|---|---|---|
| Primary sources | Data collected for the first time by the user | A personal observation you make; an interview you conduct |
| Secondary — published | Published records collected by others | Census of India; India Meteorological Department weather reports |
| Secondary — unpublished | Records maintained without formal publication | Patwari’s village-level revenue records; development plans of Municipal Corporations |
Table 2 — the two formulas
| Purpose | Formula | Symbols and base rule |
|---|---|---|
| Literacy rate | \( \frac{\text{Total Literates}}{\text{Total Population}} \times 100 \) | Literates and population of the same area — a percentage form |
| Index number (simple aggregate) | \( \frac{\sum q_i}{\sum q_0} \times 100 \) | \( \sum q_i \) current-year production; \( \sum q_0 \) base-year production; the base year is always taken as 100 |
Table 3 — class formation and ogives
| Choice | Option A | Option B | Deciding rule |
|---|---|---|---|
| Class formation | Exclusive (20–30, 30–40) | Inclusive (20–29, 30–39) | Exclusive excludes each upper limit; inclusive includes both limits |
| Ogive plotting | Less than — add frequencies from upper limits | More than — subtract frequencies from lower limits | The less than ogive rises; the more than ogive falls |
Tally in one line: four vertical strokes with the fifth drawn across them form one bundle of five — count bundles, and use \( \sum f = N \) as the final check.
Frequently asked questions
What is the difference between data and information in Class 12 Geography?
Data are numbers that represent measurements from the real world, and a datum is one such measurement. Information is a meaningful answer to a query, or a meaningful stimulus that can cascade into further queries. The difference is processing: data are the raw measurements, while information is the meaningful answer obtained after the data are processed and analysed (NCERT, p. 1).
In the exclusive method, where does a boundary value like 30 go?
It goes to the 30–40 class. The exclusive method excludes the upper limit of each class, so 30 is excluded from 20–30 and included where it is the lower limit (NCERT, p. 9). Reading the classes as “20 and under 30”, “30 and under 40” makes the rule automatic.
What is the difference between a questionnaire and a schedule?
The questions are the same in substance; the hands that write the answers differ. The respondent fills in a questionnaire himself, which limits the method to literate respondents. A trained enumerator fills in a schedule by asking the respondent the questions, so schedules work for literate and illiterate respondents alike (NCERT, p. 4).
Why is the base year index always taken as 100?
Because the base year is the reference point of the index. The formula divides the current-year production by the base-year production and multiplies by 100; in the base year itself, production divided by itself equals 1, which is 100 on the index scale. Every later index is then read as a percentage of that base year (NCERT, p. 7).
How is an ogive drawn, and what is the difference between the less than and more than methods?
An ogive is the curve obtained by plotting cumulative frequencies (NCERT, p. 10). In the less than method you start with the upper limits of the classes and keep adding frequencies — the plotted curve rises. In the more than method you start with the lower limits and keep subtracting each class frequency from the cumulative total — the plotted curve declines.
Plotting both methods on the same axes gives a combined, comparative picture.
Is a patwari’s village revenue record a primary or secondary source?
It is a secondary source. The village-level revenue records maintained by the patwari are unpublished government documents (NCERT, p. 5). A researcher who later uses those records is drawing on data already collected and recorded — the hallmark of a secondary source.
Reference: NCERT Class 12 Geography textbook, chapter Data — Its Source and Compilation.
Explore Class 12 Geography Notes
- Class 12 Geography Notes
- Class 12 CBSE Notes
- CBSE Notes for Classes 1 to 12
- Next: Data Processing
Class 12 Geography on LearnCBSE:
Related chapters:
- Graphical Representation of Data notes
- Spatial Information Technology notes