
These are the International Trade in India Class 12 notes — a one-page revision of Chapter 8, International Trade, from the NCERT Geography book India: People and Economy. The notes follow the 2026-27 session. The chapter is data-heavy, so every number below carries its textbook page for cross-checking.
The chapter revises fastest under five heads: the volume of India’s trade, its composition (what is traded), its direction (with whom), and the two gateways — sea ports and airports. The complete tables are in the NCERT PDF at ncert.nic.in. For the rest of the book, use the Class 12 Geography notes hub or the Class 12 notes library.
India’s Foreign Trade at a Glance: Volume, Growth and Trade Balance
Four headline ideas carry the chapter; everything later only fills them out.
- No country is self-sufficient, so international trade is mutually beneficial (NCERT, p. 86).
- India’s share of world trade is about one per cent of total volume, yet significant for the world economy (p. 86).
- External trade rose from Rs 1,214 crore (1950-51) to Rs 77,19,796 crore (2020-21) (p. 86).
- Drivers: momentum in manufacturing, liberal government policies and diversification of markets (p. 86).
Table 8.1 has the full series; this snapshot keeps its shape.
| Year | Exports (Rs crore) | Imports (Rs crore) | Trade balance (Rs crore) |
|---|---|---|---|
| 2004-05 | 3,75,340 | 5,01,065 | -1,25,725 |
| 2013-14 | 19,05,011 | 27,15,434 | -8,10,423 |
| 2021-22 | 31,47,021 | 45,72,775 | -14,25,753 |
Every row has a negative balance: imports exceed exports in each year (p. 87). The 2004-05 and 2021-22 rows return in the worked examples below.
Key Concepts: International Trade, Trade Balance and Hinterland
Five terms carry the argument; the rest of the chapter is data attached to them.
- International trade — exchange of goods and services between countries; mutually beneficial because no country is self-sufficient (NCERT, p. 86). The chapter also calls it external or foreign trade when seen from India’s side.
- Trade balance — exports minus imports. Since imports stay higher, India’s balance is negative: a trade deficit, like a family spending more than it earns (p. 87).
- Composition of trade — the mix of commodities in exports and imports (pp. 87-88).
- Direction of trade — the regions and countries India trades with (p. 89).
- Hinterland — the land area served by a port; boundaries are unfixed and overlap (p. 90).
The technical vocabulary — harbour types, satellite ports, bulk cargo — is collected in the next table.
Definitions Table: The Terms That Recur in This Chapter
Learn each row as a term, a meaning and an example — the example is the fact you quote in an answer.
| Term | Meaning | Example from this chapter |
|---|---|---|
| Trade balance | Exports minus imports over a period | Negative every year in Table 8.1 (p. 87) |
| Hinterland | Land area served by a port; boundary unfixed and overlapping | Mumbai serves M.P., Maharashtra, Gujarat, U.P. and parts of Rajasthan (p. 90) |
| Natural harbour | Harbour sheltered by the natural lie of the land | Mumbai, Cochin, Mormugao (pp. 90-92) |
| Artificial harbour | Harbour created by construction | Chennai, built in 1859 (p. 92) |
| Land-locked harbour | Harbour separated from the sea, joined by a channel | Visakhapatnam — channel through solid rock and sand (p. 92) |
| Satellite port | New port built to take pressure off an older one | Jawaharlal Nehru Port for Mumbai; Kamarajar and V.O. Chidambaranar for Chennai; Haldia for Kolkata (pp. 90-92) |
| Bulk cargo | Goods carried loose in large volumes | Haldia handles iron ore, coal, petroleum and fertilisers (p. 92) |
| Suction point | A port that drains resources out of its hinterland | The British ran Indian ports as suction points (p. 90) |
| Major port | Policy and regulation rest with the central government | India’s 12 major ports (p. 90) |
| Minor port | Regulated by the state government | About 200 minor or intermediate ports (p. 90) |
Memory hooks
- Hinterland = ‘hinder’ + ‘land’ — the land behind the port. A port faces the sea; all the land it serves on the other side is its hinterland. Boundaries never fix exactly because neighbouring ports reach into the same region (p. 90).
- East coast ports, north to south: Kolkata, Paradwip, Visakhapatnam, Chennai, Tuticorin (V.O. Chidambaranar) — initials K-P-V-C-T fit ‘Kolkata’s Ports Visit Chennai, Tuticorin’.
- Harbour types: Mumbai, Cochin and Mormugao are the N-ports, natural; Chennai is the lone artificial one (1859).
Changing Composition of Exports and Imports
Composition answers ‘what does India sell and buy?’. Tables 8.2 and 8.4 give percentage shares from 2015-16 to 2021-22; revise the direction of each shift, not every year (NCERT, pp. 87-88).
| Exports by commodity | 2015-16 | 2021-22 | Shift |
|---|---|---|---|
| Agriculture and allied products | 12.6 | 11.9 | Fell |
| Ore and minerals | 1.6 | 2.0 | Roughly constant |
| Manufactured goods | 72.9 | 67.8 | Fell, but still the largest block |
| Crude and petroleum products | 11.9 | 16.4 | Rose |
Manufacturing supplied 67.8 per cent of export value in 2021-22. Traditional items like cashew declined under tough competition, while floriculture, fresh fruits, marine products and sugar grew; engineering goods rose strongly. China and other East Asian countries are the main competitors, and gems and jewellery form a large export share (p. 87).
| Imports by commodity group | 2015-16 | 2021-22 | Shift |
|---|---|---|---|
| Food and allied products | 5.1 | 4.4 | Fell |
| Fuel (coal, POL) | 25.4 | 31.6 | Rose sharply |
| Fertilisers | 2.1 | 2.3 | Roughly stable |
| Capital goods | 13.0 | 10.1 | Steady decline |
| Others | 38.1 | 38.5 | Roughly stable |
Three historical changes explain the imports story (p. 88):
- The Green Revolution ended foodgrain imports.
- The 1973 energy crisis pushed petroleum prices up and inflated the import bill.
- Foodgrains were replaced by fertilisers and petroleum. Petroleum is both fuel and industrial raw material, so its rising share also signals growing industrialisation and a better standard of living.
Imports also include pearls, precious and semi-precious stones, gold, silver and non-ferrous metals (p. 88).
Direction of Trade: Where India Buys and Sells
Direction answers ‘with whom?’. Table 8.6 tracks imports region-wise; the ranking is stable, so the 2021-22 order is what to remember (NCERT, p. 89).
| Region | 2016-17 (Rs crore) | 2021-22 (Rs crore) |
|---|---|---|
| Europe | 4,03,972 | 6,40,577 |
| Africa | 1,93,327 | 3,68,156 |
| North America | 1,95,332 | 3,78,041 |
| Latin America | 1,15,762 | 1,61,995 |
| Asia and ASEAN | 15,44,520 | 29,18,577 |
- Asia and ASEAN dominate: imports from the region hit Rs 29,18,577 crore in 2021-22, far ahead of all others (p. 89).
- India trades with most countries and major trading blocs (p. 89).
- India aims to double its share of international trade within five years; steps include import liberalisation, lower import duties, delicensing and the shift from process to product patents (p. 89).
- Routes: most trade moves by sea and air; a small portion uses land routes to Nepal, Bhutan, Bangladesh and Pakistan (p. 89).
Sea Ports: Gateways of India’s International Trade
The history of Indian ports in four steps:
- India has a long sea-faring tradition; many old port towns carry the suffix pattan, meaning port (p. 89).
- The British treated ports as suction points draining resources from their hinterlands; railways tied local, regional, national and international markets together (p. 90).
- Partition took away Karachi (to Pakistan) and Chittagong (to East Pakistan, now Bangladesh). Kandla in the west and Diamond Harbour near Kolkata were developed to compensate (p. 90).
- Cargo capacity grew from 20 million tonnes (1951) to over 837 million tonnes (2016); private entrepreneurs are now invited to modernise ports (p. 90).
India now has 12 major ports and about 200 minor or intermediate ports. The central government regulates major ports; state governments regulate minor ports. Major ports handle the larger share of traffic (p. 90).
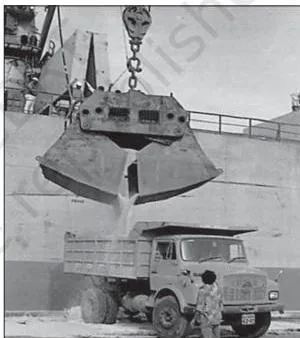
A port is the meeting point of land and sea transport — the place where cargo changes hands between ship and shore, exactly what Fig 8.3 shows as goods come off a ship.
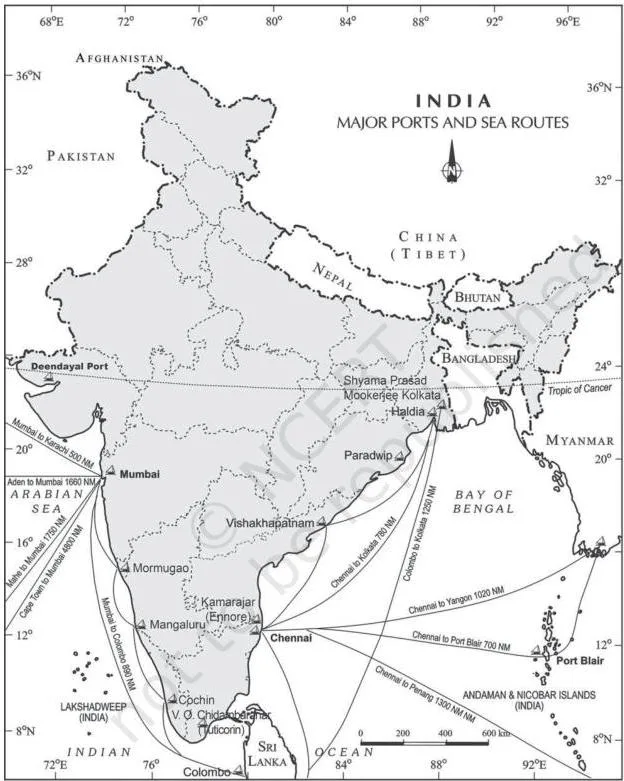
Fig 8.4 places the major ports along the coastline and traces the sea routes that tie them to world markets. Read the table below with the figure: locate each port, then attach its hinterland.
The table gathers the thirteen ports the chapter describes, with location, type, special feature and hinterland (NCERT, pp. 90-92).
| Port | Location / type | Special feature | Main hinterland |
|---|---|---|---|
| Deendayal (Kandla) | Head of the Gulf of Kuchchh | Serves the west and north-west; designed for petroleum, petroleum products and fertiliser; offshore terminal at Vadinar; eases pressure on Mumbai | Western and north-western India |
| Mumbai | Natural harbour; biggest port; 20 km long, 6-10 km wide, 54 berths | Largest oil terminal in India; close to routes from the Middle East, Mediterranean, North Africa, North America and Europe | M.P., Maharashtra, Gujarat, U.P., parts of Rajasthan |
| Jawaharlal Nehru (Nhava Sheva) | Satellite port of Mumbai | Largest container port in India | Relieves Mumbai; hinterland overlaps Mumbai’s |
| Mormugao | Zuari estuary, Goa; natural harbour | Remodelled in 1961 for iron-ore exports to Japan; Konkan railway extended its reach | Karnataka, Goa, southern Maharashtra |
| New Mangalore | Karnataka | Exports iron-ore and iron-concentrates; also fertilisers, edible oils, coffee, tea, wood pulp, yarn, granite stone, molasses | Karnataka |
| Cochin | Head of Vembanad Kayal; natural harbour | Known as the Queen of the Arabian Sea; close to the Suez-Colombo route | Kerala, southern Karnataka, south-western Tamil Nadu |
| Shyama Prasad Mookerjee (Kolkata) | On the Hugli, 128 km inland from the Bay of Bengal | Built by the British; faces silt accumulation; trade diverted to Visakhapatnam, Paradwip and Haldia | U.P., Bihar, Jharkhand, West Bengal, Sikkim, the north-east; also Nepal and Bhutan |
| Haldia | 105 km downstream from Kolkata | Reduces congestion at Kolkata; handles bulk cargo — iron ore, coal, petroleum, fertilisers, jute, cotton | Relieves Kolkata; hinterland overlaps Kolkata’s |
| Paradwip | Mahanadi delta, about 100 km from Cuttack | Deepest harbour, for very large vessels; large-scale iron-ore export | Odisha, Chhattisgarh, Jharkhand |
| Visakhapatnam | Andhra Pradesh; land-locked harbour | Channel cut through solid rock and sand links it to the sea; outer harbour for iron-ore, petroleum and general cargo | Andhra Pradesh, Telangana |
| Chennai | East coast; artificial harbour built in 1859 | One of the oldest east coast ports; shallow water makes it unsuitable for large ships | Tamil Nadu, Puducherry |
| Kamarajar (Ennore) | 25 km north of Chennai | New port built to relieve pressure at Chennai | Relieves Chennai; hinterland overlaps Chennai’s |
| V.O. Chidambaranar (Tuticorin) | Tamil Nadu | Built to relieve Chennai; handles coal, salt, food grains, edible oils, sugar, chemicals and petroleum products | Relieves Chennai; hinterland overlaps Chennai’s |
Why the West Coast Has More Ports than the East Coast
The textbook states this fact (p. 90) without explaining it; the evidence is scattered through the port descriptions. Collect the clues:
- West coast ports sit in natural harbours: Mumbai, Cochin and Mormugao at the Zuari estuary (pp. 90-92).
- The east coast offers shallow water and silting: Chennai’s coastal water is too shallow for large ships — hence its artificial harbour of 1859 (p. 92).
- Kolkata, far inland on the Hugli, struggles with silt accumulation in the river (p. 92).
- Paradwip stands in the Mahanadi delta, and Visakhapatnam needed a channel cut through solid rock and sand to reach the sea (p. 92).
Read together: the west coast had sheltered, ready-made harbours, while the east coast’s shallow, silting, deltaic shoreline offered no natural shelter, forcing artificial construction. That is the reason the west coast carries more ports.
Airports: Moving High-Value and Perishable Goods
- When air is used: it takes the least time and suits high-value or perishable goods over long distances. It is costly and unsuitable for heavy, bulky commodities, so its share of world trade is smaller than that of sea routes (NCERT, p. 92).
- 25 major airports were functioning in 2016-17: Ahmedabad, Bengaluru, Chennai, Delhi, Goa, Guwahati, Hyderabad, Kolkata, Mumbai, Thiruvananthapuram, Srinagar, Jaipur, Calicut, Nagpur, Coimbatore, Cochin, Lucknow, Pune, Chandigarh, Mangaluru, Vishakhapatnam, Indore, Patna, Bhubaneswar and Kannur (p. 92).
- Under UDAN (since 2017), 73 unserved or underserved airports, including 9 heliports and 2 water aerodromes, have been operationalised (p. 92).
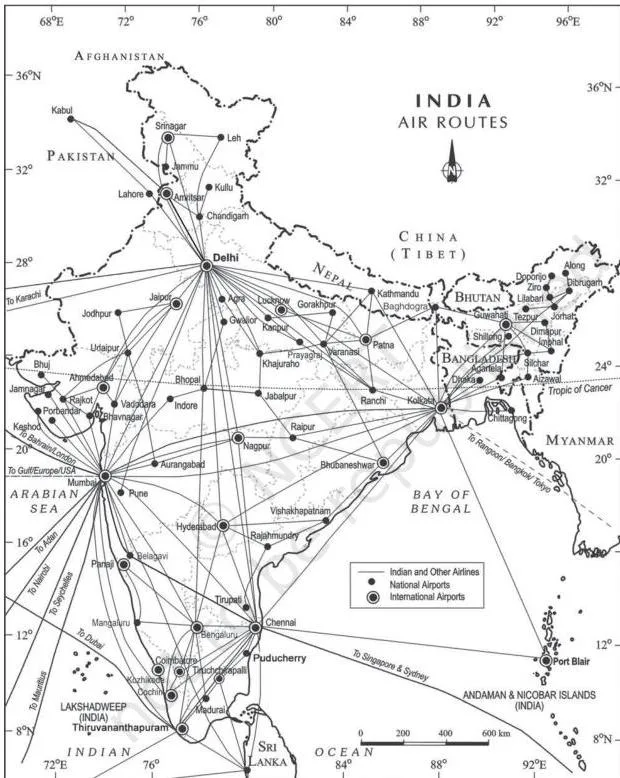
Fig 8.5 shows India’s air-route network; the routes converge on major cities, the natural hubs for passengers and cargo. The chapter refers you to the previous chapter on transport for air transport’s full features — our Transport and Communication notes carry that discussion.
Formulas and Worked Examples for Trade Data
Three calculations interpret the chapter’s tables. Learn each formula, then its caution.
- Percentage change \( = \frac{\text{later value} – \text{earlier value}}{\text{earlier value}} \times 100 \) — for rupee values such as exports or imports.
- Trade balance \( = \text{exports} – \text{imports} \). A negative result is a trade deficit.
- Percentage-point change \( = \text{later share} – \text{earlier share} \) — for comparing percentage shares.
Why the last one matters: a share lives on a 0-100 scale. Fuel’s share of imports moving from 25.4% to 31.6% is a 6.2 percentage-point change — calling it ‘6.2 per cent growth’ would muddle a share with a value.
Worked Example 1: Export growth, 2004-05 to 2021-22
Method: percentage change, using Table 8.1 values (NCERT, p. 87).
Step 1: exports were Rs 3,75,340 crore in 2004-05 and Rs 31,47,021 crore in 2021-22.
Difference:
\[ 31,47,021 – 3,75,340 = \text{Rs } 27,71,681\ \text{crore} \]
Step 2: divide the difference by the earlier value and multiply by 100.
\[ \frac{27,71,681}{3,75,340} \times 100 \approx 738\% \]
Final answer: exports grew by about 738% between 2004-05 and 2021-22.
Worked Example 2: Fuel’s changing share of imports
- Step 1: fuel’s share of imports was 25.4% in 2015-16 and 31.6% in 2021-22 (Table 8.4, p. 88).
- Step 2: subtract the earlier share from the later share.
\[ 31.6\% – 25.4\% = 6.2\ \text{percentage points} \]
Final answer: fuel’s share rose by 6.2 percentage points — a change in the share, not 6.2% growth in the value of fuel imports.
Worked Example 3: Import growth, 2004-05 to 2021-22
- Step 1: imports were Rs 5,01,065 crore in 2004-05 and Rs 45,72,775 crore in 2021-22 (Table 8.1, p. 87).
- Step 2: difference and growth rate:
\[ 45,72,775 – 5,01,065 = \text{Rs } 40,71,710\ \text{crore};\quad \frac{40,71,710}{5,01,065} \times 100 \approx 813\% \]
Final answer: imports grew by about 813% over the same period.
These percentages are worked out here from the textbook’s own table values; the chapter does not print them. Together they tell the chapter’s growth story in two numbers: exports multiplied nearly 8.4 times, imports about 9.1 times.
Common Mistakes Students Make with Trade Data and Ports
| Students often write | Correct idea | How to check your answer |
|---|---|---|
| ‘India’s share in world trade is large.’ | The share is about one per cent of world trade volume — low, yet significant (p. 86). | Recall the chapter’s fraction: roughly 1%. |
| ‘Mumbai is an artificial harbour.’ | Mumbai is a natural harbour and the biggest port; Chennai is the artificial one, built in 1859 (pp. 90, 92). | Ask which port was created by construction: Chennai, because its coast was shallow. |
| ‘Most of India’s trade moves by sea.’ | It moves by sea and air, with a small land-route share to Nepal, Bhutan, Bangladesh and Pakistan (p. 89). | Exercise Q1(iii) pairs sea with air. |
| ‘Major and minor ports are both central-government controlled.’ | Major ports are regulated by the central government; minor ports by state governments (p. 90). | Match scale to level of government: bigger ports, central. |
| ‘A falling percentage share means export value fell.’ | A share can fall while the absolute value rises; export values rose across the period even as some shares dipped (Tables 8.1 and 8.2). | Compare rupee values, not just percentage shares. |
| ‘A trade deficit means trade is bad.’ | A deficit only states that imports exceeded exports; it describes a condition, not a verdict (p. 87). | State exports and imports separately, then say which is larger. |
Exam Notes: Answering the Chapter’s Exercises Well
The chapter’s exercises (NCERT, p. 94) are concept- and data-based — no numericals, but the tables’ figures belong in your answers.
Multiple-choice questions (Q1)
- Each item attaches a term to its defining example. Q1(i): trade between two countries is international trade, the term the chapter defines at the outset (p. 86).
- Q1(ii): the land-locked harbour is Visakhapatnam, the only listed port joined to the sea by a channel (p. 92).
- Q1(iii): most foreign trade is carried through sea and air (p. 89).
Short answers of about 30 words (Q2)
A complete 30-word answer = one clear definition + one India example from the chapter.
- (i) Characteristics of India’s foreign trade: growth in volume (Rs 1,214 crore in 1950-51 to Rs 77,19,796 crore in 2020-21), imports persistently above exports, changing composition and direction.
- (ii) Port versus harbour: a port is the place of cargo transfer; a harbour is the sheltered water body. Pair Mumbai (natural harbour) with Chennai (artificial, 1859).
- (iii) Hinterland: the land area served by a port; boundaries overlap and are not fixed. Use Mumbai’s hinterland as the example.
- (iv) Important imports: petroleum, fertilisers, edible oils, machinery and equipment, special steel, chemicals; also pearls, stones, gold and silver (p. 88).
- (v) East coast ports: Kolkata, Haldia, Paradwip, Visakhapatnam, Chennai, Kamarajar (Ennore) and V.O. Chidambaranar (Tuticorin) (pp. 91-92).
Long answers of about 150 words (Q3)
- (i) Composition of export and import trade: split into exports then imports; quote the 2021-22 structure — manufactured goods 67.8% of exports, agriculture 11.9%, crude and petroleum 16.4%; imports led by fuel (31.6%) and capital goods (10.1%). Add one shift per paragraph: traditional exports declining while floriculture, fresh fruits, marine products and sugar grew; foodgrain imports ending after the Green Revolution.
- (ii) Changing nature of international trade: organise by volume, composition and direction. Volume: Rs 1,214 crore (1950-51) to Rs 77,19,796 crore (2020-21). Composition: manufacturing 67.8% of exports, fuel 31.6% of imports. Direction: Asia and ASEAN lead with Rs 29,18,577 crore of imports in 2021-22 (pp. 86-89).
Put at least one exact figure in every paragraph of a long answer — a number answers more convincingly than an adjective.
Revision Recap: The Chapter in One Page
India’s external trade grew from Rs 1,214 crore in 1950-51 to Rs 77,19,796 crore in 2020-21, with imports always exceeding exports. Composition shifted away from manufactured goods — 67.8 per cent of exports in 2021-22 — while imports came to be led by fuel. Direction is dominated by Asia and ASEAN.
The gateways are 12 major ports and about 200 minor ports, plus 25 major airports and a growing UDAN airport network.
| Number | What it belongs to |
|---|---|
| About 1% | India’s share of world trade (p. 86) |
| Rs 1,214 crore | External trade in 1950-51 (p. 86) |
| Rs 77,19,796 crore | External trade in 2020-21 (p. 86) |
| 12 major / about 200 minor | India’s port structure (p. 90) |
| 20 to 837 million tonnes | Port cargo capacity, 1951 to 2016 (p. 90) |
| 67.8% | Manufactured goods’ share of exports, 2021-22 (p. 87) |
| 31.6% | Fuel’s share of imports, 2021-22 (p. 88) |
| Rs 29,18,577 crore | Imports from Asia and ASEAN, 2021-22 (p. 89) |
| 25 | Major airports in 2016-17 (p. 92) |
| 73 (incl. 9 heliports, 2 water aerodromes) | Airports operationalised under UDAN since 2017 (p. 92) |
Continue with the book’s closing chapter through our Geographical Perspective on Selected Issues and Problems notes, or start from any subject in the CBSE notes library.
Frequently Asked Questions
What is India’s share in world trade?
About one per cent of the total volume of world trade. The share is small, yet India plays a significant role in the world economy (NCERT, p. 86).
What is a hinterland and why can its boundary change?
A hinterland is the land area served by a port. Its boundary is not fixed because neighbouring ports draw on the same regions, so hinterlands overlap and shift with transport links and competition (NCERT, p. 90).
Which are the major ports on the east coast of India?
From north to south: Kolkata (with Haldia downstream), Paradwip, Visakhapatnam, Chennai (with Kamarajar/Ennore 25 km north) and V.O. Chidambaranar (Tuticorin) (NCERT, pp. 91-92).
What changed in India’s imports after the 1970s?
The Green Revolution ended foodgrain imports, and the 1973 energy crisis raised petroleum prices. Foodgrains were replaced in the import basket by fertilisers and petroleum (NCERT, p. 88).
How many major and minor ports does India have?
12 major ports and about 200 minor or intermediate ports. Major ports are regulated by the central government and minor ports by state governments (NCERT, p. 90).
Which regions are India’s main import partners?
Asia and ASEAN lead, with imports of Rs 29,18,577 crore in 2021-22, followed by Europe, North America, Africa and Latin America (NCERT, p. 89).
Reference: NCERT Class 12 Geography textbook (India: People and Economy), chapter International Trade.
Explore Class 12 Geography Notes
- Class 12 Geography Notes
- Class 12 CBSE Notes
- CBSE Notes for Classes 1 to 12
- Previous: Transport and Communication
- Next: Geographical Perspective on Selected Issues and Problems
Class 12 Geography on LearnCBSE:
Related chapters:
- Mineral and Energy Resources notes
- Planning and Sustainable Development in Indian Context notes