
This page is the complete revision notes set for Class 12 Geography Chapter 9, Geographical Perspective on Selected Issues and Problems, from the NCERT book India: People and Economy. It sits inside our Class 12 notes collection and the wider CBSE notes library.
If you want geographical perspective on selected issues class 12 notes you can revise in one sitting, this is it — every problem, case study, data table and exercise type of the chapter, condensed to the definitions, data points and answer frameworks you need. These notes follow the 2026-27 session.
The chapter studies five problems — water pollution, air pollution, noise pollution, urban waste disposal and rural-urban migration — and then two more that grow out of them: slums and land degradation. Its method is geographical: each problem is understood by where it occurs — polluted stretches of rivers, noise that fades with distance from its source, and slums forming on degraded land.
Work through the sections in order, then use the worked examples and revision summary to practise writing complete answers.
Reference: NCERT Class 12 Geography textbook, India: People and Economy, chapter 9, Geographical Perspective on Selected Issues and Problems.
What this chapter covers: five problems, one geographical method
A geographical perspective studies a problem by where it happens. The chapter applies this to five environmental and social problems of India — water, air and noise pollution, urban waste disposal and rural-urban migration — and then to two problems built on them: slums and land degradation.
Each problem is located in space: the Ganga and Yamuna are polluted at specific stretches, noise pollution declines with distance from its source, and slums occupy environmentally degraded land. The overview table below is the chapter’s map. The page references follow the NCERT textbook, which you can download from the official NCERT textbook portal.
| Issue | Core question | Textbook pages | Response or programme to quote |
|---|---|---|---|
| Water pollution | When does surface water stop being usable? | 95-97 | National Mission for Clean Ganga; Namami Gange Programme |
| Air pollution | What contaminants does the air carry, and with what effects? | 97-98 | No programme named; WHO calls it the world’s top environmental health risk |
| Noise pollution | When does sound become unbearable, and where? | 98 | Measured in decibels (dB); intensity declines with distance |
| Urban waste disposal | Where does the city’s solid waste go, and who is harmed? | 98-100 | Waste as a resource for energy and compost; the Daurala model |
| Rural-urban migration | Why do the poor bypass small towns for mega cities? | 100-101 | Remittances — Ramesh sends about Rs 20,000 a year home |
| Slums | Who ends up in slums, and why can’t they escape? | 101-103 | Swachh Bharat Mission (SBM) |
| Land degradation | How does land lose its productive capacity? | 103-104 | Watershed management; Jhabua’s 20 per cent district treated |
Notice how the problems build on one another: urban waste disposal is itself a pollution source when untreated waste reaches rivers, and rural-urban migration feeds the growth of slums. Two memory aids carry the whole chapter — the Namami Gange mnemonic and the three-group wasteland table — both marked below.
For the full set of study material from this book, start from our Class 12 Geography revision notes hub.
Key definitions: the terms that carry the chapter
Short-answer items in this chapter are usually one definition plus one supporting point. Learn the precise wording below — several terms (pollution vs pollutant, degraded land vs wasteland) are set up as deliberate contrasts later in the chapter.
| Term | Meaning in your own words | NCERT page |
|---|---|---|
| Environmental pollution | Release of substances and energy from the waste products of human activities; classified by the medium that carries them — air, water, land or noise. | 95 |
| Pollutant | The substance or energy released into the environment — for example oxides of sulphur, lead, or noise above tolerance; pollution is the harmful state it creates. | 95 |
| Self-purifying capacity of water | The natural ability of a water body to clean itself; water is polluted when the load of substances rises beyond this capacity. | 95 |
| Air pollution | Addition of contaminants — dust, fumes, gas, fog, odour, smoke or vapour — to the air in substantial proportion and duration, harmful to flora, fauna and property. | 97 |
| Noise pollution | The state of noise that is unbearable and uncomfortable to human beings. | 98 |
| Solid waste | Old and used articles — metal pieces, broken glass, plastic containers, polythene bags, ash — also called refuse, garbage or rubbish. | 98 |
| Slum | A residential area of the least choice: dilapidated houses, poor hygiene, poor ventilation, and lack of drinking water, light and toilet facilities. | 103 |
| Land degradation | A temporary or permanent decline in the productive capacity of land, caused by soil erosion, waterlogging, salinisation and alkalinisation. | 103 |
| Wasteland | Land whose productive capacity is lost; all degraded land may not be wasteland, but unchecked degradation can convert it into one. | 103 |
This chapter has no mathematical formulas. Its ‘numerical’ content lives in units and data points — decibels, percentages, remittances — collected in the Numbers and units section below.
Pollution and pollutants: building the base
Pollution results from the release of substances and energy from the waste products of human activities (NCERT, p. 95). It is classified by the medium through which the pollutants are transported and diffused — air, water, land and noise — and these four types are the skeleton of the chapter.
The contrast that matters: the pollutant is the substance or energy released, while pollution is the harmful condition that results when it builds up.
Misconception autopsy: students sometimes write that pollution is the harmful substance. It is the other way round — the pollutant is the cause; pollution is the effect. One line settles the pair: the pollutant is what is released, and pollution is what follows. Keep them straight and the chapter’s short question on this pair answers itself.
The textbook’s Table 9.1 lists the pollutants and sources of each pollution type. The table below adds the effects column drawn from the chapter’s prose, so effect-based questions can be answered without re-reading the chapter (NCERT, p. 96). Notice that Table 9.1 also lists land pollution; the chapter develops the land theme more fully through its later land-degradation section.
| Pollution type | Pollutants involved (grouped) | Main sources | Health and environmental effects |
|---|---|---|---|
| Air | Oxides of sulphur and nitrogen, hydrocarbons, carbon monoxide and dioxide, ammonia, lead, aldehydes, asbestos, beryllium | Combustion of coal, petrol and diesel; industrial processes; solid waste and sewage disposal | Diseases of the respiratory, nervous and circulatory systems; urban smog; acid rain |
| Water | Dissolved and suspended solids, nitrates and nitrites, chloride, fluoride, oil and grease, pesticide residues, heavy metals (lead, arsenic, mercury, manganese), radioactive substances | Sewage disposal, urban run-off, industrial effluents, run-off over cultivated land, nuclear power plants | Water-borne diseases — diarrhoea, intestinal worms, hepatitis |
| Land | Human and animal excreta, viruses and bacteria, garbage and its carriers, pesticide and fertiliser residue, fluorides, radioactive substances | Improper human activities, untreated industrial waste, use of pesticides and fertilisers | Health hazards from filth and from carriers like flies and rodents; obnoxious smell |
| Noise | Sound above the tolerance level | Aircraft, automobiles, trains, industrial processing, advertising media | Discomfort and stress beyond tolerance; disturbance that is location specific |
Whichever way a question is framed — name the source, name the pollutant, or name the effect — this table is the answer map for the first part of the chapter.
Water pollution: sources, rivers and the Namami Gange response
Surface water from rivers, canals and lakes is never pure; it naturally carries small quantities of suspended particles and organic and inorganic substances (NCERT, p. 95). Water becomes polluted when the concentration of these substances rises beyond the water body’s self-purifying capacity — it can no longer clean itself and becomes unfit for use.
Natural processes (erosion, landslides, decay and decomposition of plants and animals) add some pollutants, but human activities are the real concern. Among industrial, agricultural and cultural activities, industry is the most significant contributor. The major water-polluting industries are leather, pulp and paper, textiles and chemicals; their wastes reach running water or lakes and destroy the aquatic bio-system.
Agricultural chemicals — inorganic fertilisers, pesticides and herbicides — wash into rivers, lakes and tanks and also infiltrate the soil to reach groundwater; fertilisers raise the nitrate content of surface waters. Cultural activities such as pilgrimage, religious fairs and tourism add to the load.
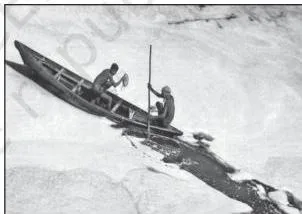
The photograph in Fig. 9.1 makes the chapter’s central idea visible: the rower cuts through a pervasive layer of foam on the heavily polluted Yamuna near New Delhi. The foam is the river’s effluent load made physical — evidence that the water has long crossed its self-purifying capacity.
The Ganga and Yamuna evidence in Table 9.2 is the chapter’s strongest data, so learn to read it (NCERT, p. 96): locate the polluted stretch, name the nature of the pollution, then name the polluter.
| River and states | Polluted stretches | Nature of pollution | Main polluters |
|---|---|---|---|
| Ganga (Uttar Pradesh, Bihar, West Bengal) | Downstream of Kanpur; downstream of Varanasi; Farakka Barrage | Industrial pollution from towns like Kanpur; domestic wastes from urban centres; dumping of carcasses | Cities — Kanpur, Prayagraj, Varanasi, Patna and Kolkata — release domestic waste into the river |
| Yamuna (Delhi, Uttar Pradesh) | Delhi to the confluence with the Chambal; Mathura and Agra | Extraction of water by Haryana and Uttar Pradesh for irrigation; agricultural run-off with high levels of micro-pollutants; Delhi’s domestic and industrial waste | Delhi dumping its domestic waste |
Read every row the same way — polluted stretch, nature, polluter — and you have the evidence half of a long answer. The consequences follow: contaminated water causes water-borne diseases such as diarrhoea, intestinal worms and hepatitis, and the WHO links about one-fourth of India’s communicable diseases to water (NCERT, p. 97).
Given that almost all surface water sources in India are contaminated, the response a student should quote is the National Mission for Clean Ganga, implemented through the Namami Gange Programme, with seven objectives (NCERT, p. 97):
- developing sewerage treatment systems in towns;
- monitoring of industrial effluents;
- development of the river front;
- afforestation along the banks to increase biodiversity;
- cleaning of the river surface;
- development of ‘Ganga Grams’ in Uttarakhand, Uttar Pradesh, Bihar, Jharkhand and West Bengal;
- creating public awareness so pollutants are not added to the river, even through rituals.
To fix all seven in the textbook’s order, use the first-letter hook ‘Some Managers Follow All Cleaning Guidelines Always’:
| Hook word | Namami Gange objective |
|---|---|
| Some | Sewerage treatment systems in towns |
| Managers | Monitoring of industrial effluents |
| Follow | development of the river Front |
| All | Afforestation along the banks |
| Cleaning | Cleaning of the river surface |
| Guidelines | Ganga Grams |
| Always | public Awareness |
The hook runs exactly in the order the textbook lists the objectives, so reciting all seven in sequence becomes a one-line rehearsal.
Air pollution: smog, acid rain and health risks
Air pollution is the addition of contaminants — dust, fumes, gas, fog, odour, smoke or vapour — to the air in substantial proportion and duration, in a way that may harm flora, fauna and property (NCERT, p. 97).
The main sources are combustion of fossil fuels, mining and industries; these processes release oxides of sulphur and nitrogen, hydrocarbons, carbon dioxide, carbon monoxide, lead and asbestos.
Three effects are worth quoting. First, health: air pollution causes diseases of the respiratory, nervous and circulatory systems. Second, urban smog — the smoky fog that hangs over cities, caused by atmospheric pollution and harmful to human health.
Third, acid rain: the oxides of sulphur and nitrogen released into the air lead to acid rain, and rainwater analysis shows that the pH of the first rain after summer is always lower than that of subsequent rains (NCERT, p. 98).
The chapter’s two news boxes give the WHO’s global framing. One reports that air pollution is the world’s top environmental health risk, causing about one in eight deaths globally.
A second, on Southeast Asia, reports that haze from land-clearing fires repeatedly triggered emergencies and that air pollution in major Southeast Asian and Chinese cities contributes to about 300,000 deaths a year (NCERT, p. 97). Summarise each box in a single line, as done here, rather than reproducing the articles.
Noise pollution: a location specific problem
Noise pollution is the state of noise that is unbearable and uncomfortable to human beings; it became a serious concern only in recent years because of technological innovation (NCERT, p. 98). The main sources are factories, mechanised construction and demolition works, automobiles and aircraft, with periodic additions from sirens and loudspeakers at festivals and community events.
The sound level of steady noise is measured in decibels (dB).
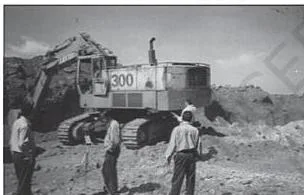
Fig. 9.2 shows noise being measured at the Panchpatmalai bauxite mine — evidence that mining and industry are monitored noise sources, not just traffic. Among all sources, traffic is the biggest nuisance because its intensity depends on the type of aircraft, vehicle or train and on the condition of the road and the vehicle.
In sea traffic, noise stays confined to harbours, where loading and unloading take place.
The geographical point unique to noise is that it is location specific and its intensity declines with distance from the source — that is why industrial areas, transport arteries and airports are the problem zones, and why it is hazardous in many metropolitan cities.
The Scripps Institute box adds a global dimension: ocean noise has increased about tenfold since the 1960s, with levels about 10-12 dB higher in 2003-04 than in 1964-66, largely linked to global shipping.
Urban waste disposal: what cities throw away
Solid waste is a variety of old and used articles — stained pieces of metal, broken glassware, plastic containers, polythene bags, ash, floppies and CDs — dumped at different places; these are also called refuse, garbage or rubbish (NCERT, p. 98). Waste is disposed of from two kinds of sources:
- Household or domestic establishments — waste is dumped on public lands or at private contractors’ sites;
- Industrial or commercial establishments — solid waste is collected and disposed of through public (municipal) facilities at low-lying grounds, the landfill areas.
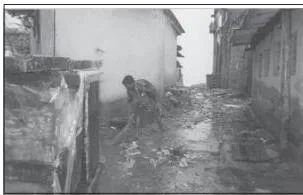
The photograph in Fig. 9.3, taken in Mahim, Mumbai, shows the everyday scale of the problem — heaps of urban waste that the city must collect, transport and dispose of.
The hazards are physical and biological: waste creates an obnoxious smell and harbours flies and rodents, which carry diseases such as typhoid, diphtheria, diarrhoea, malaria and cholera; the waste is also spread by wind and splattered by rain.
Two statistics upgrade any answer: metropolitan cities such as Mumbai, Kolkata, Chennai and Bengaluru collect and dispose of about 90 per cent of their solid waste, while most other cities and towns leave 30 to 50 per cent of their waste uncollected on streets, in open spaces and in wastelands (NCERT, p. 99).
Untreated waste ferments slowly and releases toxic biogas, including methane; the textbook’s solution line is that waste should be treated as a resource for generating energy and compost.
The Daurala case study (near Meerut, Uttar Pradesh) is the chapter’s working example of that solution, built on the ‘polluter pays’ principle and cooperation between an NGO, industries, the government and the community (NCERT, p. 99):
- groundwater had been contaminated with heavy metals because Daurala industries’ untreated wastewater was leaching into the aquifer;
- the NGO ran a door-to-door health survey and, with villagers and people’s representatives, arrived at sustainable solutions to the health problem;
- actions included enhancing the overhead water tank’s capacity and laying a 900 m pipeline for potable water, desilting the village pond so it could recharge the aquifers, building rainwater harvesting structures, and planting 1,000 trees.
Close the section with a thought: what does your household throw away, and where does that waste finally end up? That consumption-to-disposal chain is the everyday beginning of this problem.
Rural-urban migration: push factors, pull factors and a welder’s story
People move from rural to urban areas because of three forces: push factors (low job opportunities in rural areas), pull factors (high demand for labour in urban areas) and the unbalanced pattern of development between rural and urban areas (NCERT, p. 100).
Because smaller and medium cities also offer low opportunities, the poor generally bypass them and head straight to the mega cities.
The wider data: about 55 per cent of the world’s population now lives in cities, a proportion estimated to reach 68 per cent by 2050. In India, it is estimated that since 1961 around 60 per cent of urban growth has been attributed to migration, of which about 29 per cent is rural-to-urban movement (NCERT, p. 100).
The chapter tells Ramesh’s story to make these forces concrete. Compress it into a timeline and it reads like this:
| Phase | What happened | What it shows |
|---|---|---|
| Before 1988 | Three brothers and their families survived on three acres; the family was in debt; Ramesh left school after Class 9 | Rural poverty — the push factor |
| 1988 | Moved with a friend to Ludhiana; worked in a woollen factory for six months at Rs 20 per day | First urban job at a very low wage; difficulty adjusting to a new culture |
| After 1988 | Shifted to Surat, learned welding, and has since moved with the same contractor to Mumbai, Gandhinagar, Bharuch and Jamnagar | Skill acquisition lets a migrant follow contract work |
| Present | Remits about Rs 20,000 a year to his village for consumption, healthcare, schooling, agriculture, land and housing; the family’s standard of living improved | Remittance is the rural-urban link |
| Cost | He cannot shift his family because the job is temporary and transferable; he bears the pain of separation | The social cost of migration |
The boxed comment after the case study generalises it to developing countries: poor, semi-illiterate and unskilled rural migrants end up in menial, low-wage jobs in the informal sector; wages are too low to support the whole family at the destination, so spouses are left behind to look after children and the elderly (NCERT, p. 101).
The memory hook for a short answer is the three letters MIS — a Male-dominated stream, Informal-sector work, Spouses staying back in the village.
Keep the bridge in mind: this movement feeds the next problem — slums.
Problems of slums: the other extreme of the city
India remains predominantly rural — about 69 per cent of the population lived in villages in 2011, and Mahatma Gandhi called villages the ideal republics — yet most villages exist as hinterlands, an appendix to the core urban centre (NCERT, p. 102).
Inside the city the contrast is stark: at one extreme are farm houses and high-income localities with wide roads, streetlights, water and sanitation, lawns, parks and security; at the other are slums, jhuggi-jhopari clusters and colonies of shanty structures.
Why do slums form? Their inhabitants were forced to migrate from rural areas in search of livelihood but could not afford proper housing because of high rents and high land costs, so they occupy environmentally incompatible and degraded areas (NCERT, p. 103).
The definition to quote: slums are residential areas of the least choice, with dilapidated houses, poor hygienic conditions, poor ventilation and lack of basic amenities such as drinking water, light and toilet facilities. Open defecation, unregulated drainage and overcrowded narrow street patterns are serious health and socio-environmental hazards.
The textbook quotes Jeremy Seabrook (1996) on Dharavi, Asia’s largest slum, in central Mumbai (NCERT, p. 102). In his description, buses merely skirt the periphery, one ‘ninety-foot road’ has shrunk to less than half its width, and a single room is rented by a whole family.
Yet Dharavi is also a workshop: its cramped lanes produce ceramics and pottery, embroidery and zari work, leather goods, high-fashion garments, delicate jewellery settings and furniture that reach the richest houses in India and abroad. The paradox the passage builds is poverty and filth alongside high-value production.
The government’s urban renewal response for slums is the Swachh Bharat Mission (SBM) (NCERT, p. 103). The consequences of slum life run in a chain: most slum dwellers work in low-paid, high-risk, unorganised sectors; they are undernourished and prone to disease; their poverty makes them vulnerable to drug abuse, alcoholism, crime, vandalism, escapism, apathy and, ultimately, social exclusion.
The same passage answers the textbook’s in-text question: slum children are deprived of school education because their parents’ low and insecure incomes cannot afford it.
Land degradation: how land loses its capacity
Land degradation is a temporary or permanent decline in the productive capacity of land, caused by soil erosion, waterlogging, salinisation and alkalinisation (NCERT, p. 103). The chapter’s key distinction: all degraded land may not be wasteland, but an unchecked process of degradation may convert it into wasteland.
Two processes induce degradation — natural agents and human action. The National Remote Sensing Centre (NRSC) classifies wastelands accordingly, and the three groups are easy to blur in an answer, so learn them carefully (NCERT, p. 103):
| Wasteland group | Chief cause | Examples |
|---|---|---|
| Natural only | Natural agents | Gullied/ravinous land; desertic or coastal sands; barren rocky areas; steep sloping land; glacial areas |
| Natural plus human | Both sets of processes | Waterlogged and marshy land; salinity- and alkalinity-affected land; land with or without scrub |
| Human only | Human action | Degraded shifting cultivation areas; degraded land under plantation crops; degraded forests and pastures; mining and industrial wastelands |
The book’s conclusion: wastelands caused by man-made processes are more important than those caused by natural processes (NCERT, p. 104).
Jhabua is the response case study. The district lies in the westernmost agro-climatic zone of Madhya Pradesh, is one of the five most backward districts of the country, and has a high tribal population, mostly Bhils. Its poverty has been accentuated by rapid degradation of both forest and land.
In the past five years alone, watershed management programmes funded by the Ministry of Rural Development and implemented by the Rajiv Gandhi Mission for Watershed Management have treated 20 per cent of the district (NCERT, p. 104).
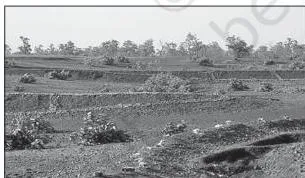
Fig. 9.4 documents the community side: trees planted on common property resources — the visible result of the programme’s field work.
The Petlawad block, in the north of the district, is a government-NGO-community success story. The Bhil villagers of Sat Rundi hamlet (Karravat village) planted and maintained one tree per household on common property, planted fodder grass on pasture land, social-fenced the land for at least two years, and planned stall feeding instead of open grazing.
Even an encroachment conflict was resolved by making the encroacher a member of the user group that shares the benefits of the greened commons (NCERT, p. 104).
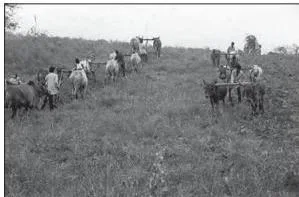
Fig. 9.5 shows the same participation at ground level — villagers together levelling land on common property. The two photographs together are the chapter’s proof that land restoration works when the community owns the process.
The textbook connects the idea of common property resources (CPR) to its chapter on Land Resources and Agriculture; the user-group solution in Petlawad is a practical example of CPR management.
Numbers and units worth quoting in answers
This chapter has no mathematical formulas — but it carries one unit and several data points that turn a general answer into a geography answer. Quote two or three of these as evidence and your answer moves from assertion to evidence:
| Item | Value, unit or observation | NCERT page |
|---|---|---|
| Noise measurement | Steady noise is measured in decibels (dB) | 98 |
| Acid rain observation | The first rain after summer has a lower pH than subsequent rains | 98 |
| WHO estimate | Air pollution is the world’s top environmental health risk, causing about one in eight deaths globally | 97 |
| World urbanisation | 55 per cent of people live in cities now; estimated 68 per cent by 2050 | 100 |
| Waste collection | About 90 per cent collected in metropolitan cities; 30-50 per cent uncollected in most other towns | 99 |
| Ramesh’s remittance | About Rs 20,000 a year sent to his village | 100 |
| Jhabua treatment | 20 per cent of the district treated in five years | 104 |
| Daurala actions | 900 m pipeline for potable water; 1,000 trees planted | 99 |
One more piece of WHO evidence on the water side: about one-fourth of India’s communicable diseases are water-borne (NCERT, p. 97).
Worked examples: turning chapter material into full answers
Every long answer in this chapter can be built with the same four-move structure: define, give causes or sources, add evidence, close with the response. The three examples below apply it to the chapter’s own question types.
Example A — 150-word answer: the nature of water pollution in India
Method: four moves, with evidence drawn by reading Table 9.2 row by row.
- Define. Start with the self-purifying capacity idea: surface water is never pure, and pollution means the load of substances has crossed what the water body can clean, making it unfit for use.
- Give the human sources, with the biggest first. Industry is the most significant contributor — leather, pulp and paper, textiles and chemicals dispose of wastes in running water. Add agricultural chemicals (fertilisers raise the nitrate content of surface waters) and cultural activities such as pilgrimage and fairs.
- Add evidence from Table 9.2. Read each row as polluted stretch, nature, polluter: the Ganga is polluted downstream of Kanpur and Varanasi and at the Farakka Barrage; the Yamuna is polluted from Delhi to the Chambal confluence and at Mathura-Agra, with Delhi’s domestic and industrial waste as the main polluter. Add the disease data: diarrhoea, intestinal worms and hepatitis, with about one-fourth of India’s communicable diseases water-borne.
- Close with the response. National Mission for Clean Ganga, implemented through Namami Gange with its seven objectives.
Assembled, the answer runs to about 150 words. A model: ‘Surface water is never pure; it becomes polluted when the concentration of suspended particles and dissolved substances rises beyond its self-purifying capacity. Human activities are the main cause, and industry is the most significant — leather, pulp and paper, textiles and chemicals dispose of their wastes in running water.
Agricultural chemicals wash into rivers and raise the nitrate content, and cultural activities like pilgrimage add more. Table 9.2 locates the evidence: the Ganga is polluted downstream of Kanpur and Varanasi and at the Farakka Barrage, and the Yamuna from Delhi to the Chambal confluence, mainly from Delhi’s domestic and industrial waste.
Contaminated water causes diarrhoea, intestinal worms and hepatitis — the WHO links about one-fourth of India’s communicable diseases to water. The response is the National Mission for Clean Ganga, implemented through Namami Gange.’
Example B — 30-word answer: pollution and pollutants
Method: two short definitions, then one contrast line.
- Define the pollutant: the substance or energy released into the environment.
- Define pollution: the harmful condition that results when the pollutant builds up.
- Contrast in one line: the pollutant is the cause; pollution is the effect.
Model: ‘A pollutant is the substance or energy released, for example oxides of sulphur. Pollution is the resulting harmful state, such as acid rain. The pollutant is the cause; pollution is the effect.’
Example C — 150-word answer: measures for reduction of land degradation
Method: the same four moves, but the response is promoted into the body because the question asks for measures.
- Define the problem briefly. Land degradation is a temporary or permanent decline in productive capacity, caused by soil erosion, waterlogging, salinisation and alkalinisation; unchecked, it may turn land into wasteland.
- Name the response framework. Watershed management, because it acknowledges the linkage between land, water and vegetation and works through community participation.
- Give specific measures. Afforestation on common lands; social fencing of pastures and stall feeding instead of open grazing; rainwater harvesting and desilting of ponds; control of fertiliser and pesticide residues so soils are not poisoned.
- Anchor in evidence. Jhabua: one tree per household on common property, fodder grass on pasture land, and 20 per cent of the district treated in five years.
The same four moves recur across the long-answer items — swap the topic, but keep define, causes or sources, evidence, response.
Common mistakes to avoid
These are the chapter-specific errors that turn a right-sounding answer into a wrong one. The third column gives a quick self-check for each.
| Mistake | Correct rule | How to check your answer |
|---|---|---|
| ‘Pollution is the harmful substance’ | The pollutant is the substance or energy released; pollution is the harmful state that results | Ask: what was released? That is the pollutant. What condition follows? That is pollution. |
| ‘Acid rain is caused by water pollution’ | Acid rain is an air-pollution effect, caused by oxides of sulphur and nitrogen | Name the gases and the medium they travel through — air, not water. |
| ‘All degraded land is wasteland’ | All degraded land may not be wasteland; unchecked degradation converts it into wasteland | Test with ‘yet’: land can be degraded yet not wasteland. |
| Answering slum questions with only characteristics | Slum causes are forced migration plus inability to afford housing because of high rents and land costs | After listing features, answer ‘why do slums exist?’ with the causes. |
| Attributing every wasteland to human action | Wastelands fall into three groups; gullied/ravinous land, desertic sands, barren rocky areas, steep slopes and glacial areas are primarily natural | Sort the wasteland type into natural / natural plus human / human only before answering. |
| Forgetting that noise declines with distance | Noise pollution is location specific; intensity declines as distance from the source grows | For any noise answer, state both the source and the distance rule. |
| Placing urban run-off under air pollution | Urban run-off is a water-pollution source | Match each source to its medium in Table 9.1 before writing. |
Exam notes: matching the answer to the question type
The end-of-chapter exercises on p. 105 come in three forms. Each checks a different skill and needs a different length of answer.
Choose-the-right-answer items (1(i)-(iv))
These are direct-concept checks. The reasoning in one line each: the Yamuna is the highly polluted river — Table 9.2 shows its Delhi-to-Chambal stretch polluted. Diarrhoea is the water-borne disease among the options. Acid rain is an air-pollution effect, caused by oxides of sulphur and nitrogen. Push and pull factors are the forces behind migration.
About-30-word answers (2(i)-(iv))
The formula: one precise definition plus one supporting point — an example or a data point.
The four items map to: the pollution/pollutant contrast (Example B above); the major source of air pollution (combustion of fossil fuels, mining and industries); major problems of urban waste disposal in India (uncollected waste, health hazards from flies and rodents, toxic biogas from untreated waste); and effects of air pollution on human health (respiratory, nervous and circulatory diseases).
About-150-word answers (3(i)-(iii))
Use the four-move structure (define, causes or sources, evidence, response) demonstrated in the worked examples. The three items are the nature of water pollution in India (Example A), the problem of slums in India (define slums, give causes, quote Dharavi and the consequences chain, close with the Swachh Bharat Mission), and measures for reduction of land degradation (Example C).
For the chapter’s in-text question on slum children — why are they deprived of school education? — the one-line answer is that parents’ low and insecure incomes cannot afford schooling. The chapter’s case studies (Ramesh, Daurala, Jhabua, Dharavi) are your evidence bank, and its programmes (Namami Gange, Swachh Bharat Mission, watershed management) form the response half of any long answer.
Revision summary: the whole chapter on one page
This master table is the night-before revision: every issue in one row, with the meaning, main causes, the data or case to quote, and the response or programme.
| Issue | Meaning in one line | Main causes or sources | Data or case to quote | Response or programme |
|---|---|---|---|---|
| Water pollution | Contaminants rise beyond the water’s self-purifying capacity | Industry (leather, pulp and paper, textiles, chemicals); agrochemicals; cultural activities | Ganga at Kanpur, Varanasi, Farakka; Yamuna Delhi to Chambal; one-fourth of India’s communicable diseases water-borne | National Mission for Clean Ganga; Namami Gange |
| Air pollution | Contaminants in substantial proportion and duration | Combustion of fossil fuels; mining; industries | WHO: about one in eight deaths globally; first rain after summer has lower pH | Urban smog and acid rain are its named effects; no single programme in the chapter |
| Noise pollution | Noise that is unbearable and uncomfortable | Factories; construction; traffic; aircraft; festivals | Decibels (dB); intensity declines with distance | Location-specific control — separate sources from residential areas |
| Urban waste disposal | Disposal of refuse, garbage and rubbish | Household and domestic establishments; industrial and commercial establishments | 90 per cent collected in metros; 30-50 per cent left uncollected elsewhere; methane from untreated waste | Waste as a resource for energy and compost; Daurala model |
| Rural-urban migration | Movement of people from villages to cities | Push (low rural jobs); pull (urban labour demand); unbalanced development | 55 per cent world urban, 68 per cent by 2050; Ramesh’s Rs 20,000 yearly remittance | Remittances raise village living standards |
| Slums | Residential areas of the least choice | Forced migration; inability to afford housing | Dharavi, Asia’s largest slum, produces goods for rich homes | Swachh Bharat Mission (SBM) |
| Land degradation | Temporary or permanent decline in productive capacity | Soil erosion; waterlogging; salinisation; alkalinisation | Jhabua: 20 per cent of district treated in five years; three wasteland groups | Watershed management with community participation |
Quick-fire figures — one idea from each photograph:
- Fig. 9.1 Yamuna foam — rivers carry a visible effluent load;
- Fig. 9.2 noise monitoring at Panchpatmalai bauxite mine — industry is a measured noise source, not just traffic;
- Fig. 9.3 Mahim, Mumbai waste — the everyday scale of urban waste;
- Fig. 9.4 trees on common property in Jhabua — community planting restores land;
- Fig. 9.5 land levelling in Jhabua — participation fixes degradation.
Two memory devices carry the whole chapter: the Namami Gange hook (‘Some Managers Follow All Cleaning Guidelines Always’) and the three-group wasteland table (natural only, natural plus human, human only). When you are done, check yourself against the common-mistakes table, then practise one long answer using the four-move structure.
If you are revising other units of India: People and Economy, continue with the International Trade chapter notes.
FAQs
What is the difference between pollution and pollutants?
The pollutant is the substance or energy released into the environment; pollution is the harmful condition that results. Oxides of sulphur are pollutants, and the acid rain they cause is pollution. The end-of-chapter exercise asks exactly this contrast — the pollutant is the cause, pollution is the effect.
Is land degradation the same as wasteland?
No. All degraded land may not be wasteland, but an unchecked process of degradation may convert it into wasteland (NCERT, p. 103). Degradation is the process; wasteland is the end stage if nothing is done.
Why is the Yamuna called a highly polluted river in this chapter?
Because Table 9.2 locates the pollution: the Yamuna is polluted from Delhi to its confluence with the Chambal, and at Mathura and Agra. Delhi dumps its domestic and industrial waste, Haryana and Uttar Pradesh extract water for irrigation, and agricultural run-off raises the level of micro-pollutants (NCERT, p. 96).
Why is rural-urban migration in India dominated by men?
Because wages at the destination are too low to support the whole family, so spouses stay behind in the village to look after children and the elderly. The migrants themselves find menial, low-wage informal-sector jobs, and the rural-urban stream is therefore male-dominated (NCERT, p. 101).
Why is noise pollution described as location specific?
Because its intensity declines with distance from the source — industrial areas, transport arteries and airports are the problem zones, while areas farther away are less affected (NCERT, p. 98). That is what makes it different from water or air pollution, which travel.
What are the objectives of the Namami Gange Programme?
The seven objectives are: developing sewerage treatment systems in towns; monitoring of industrial effluents; development of the river front; afforestation along the banks to increase biodiversity; cleaning of the river surface; development of Ganga Grams in Uttarakhand, Uttar Pradesh, Bihar, Jharkhand and West Bengal; and creating public awareness so pollutants are not added to the river, even through rituals (NCERT, p. 97).
Rehearse them with the hook ‘Some Managers Follow All Cleaning Guidelines Always’.
Reference: NCERT Class 12 Geography textbook, India: People and Economy, chapter 9, Geographical Perspective on Selected Issues and Problems.
Explore Class 12 Geography Notes
- Class 12 Geography Notes
- Class 12 CBSE Notes
- CBSE Notes for Classes 1 to 12
- Previous: International Trade
Class 12 Geography on LearnCBSE:
Related chapters:
- Mineral and Energy Resources notes
- Planning and Sustainable Development in Indian Context notes
- Transport and Communication notes
Official source: download the NCERT textbook free from ncert.nic.in.