
This page is a revision-ready treatment of Class 12 Biology Chapter 4, Principles of Inheritance and Variation, following the rationalised NCERT textbook for the 2026-27 session.
It packs the whole chapter — Mendel’s pea experiments, the three laws of inheritance, Punnett squares, deviations such as incomplete dominance and linkage, sex determination, mutation and genetic disorders — into compact tables, diagrams and notes you can finish in one sitting.
Use it in three passes. First, read the key concepts section by section so the logic of each cross is clear. Second, attempt the three worked examples on your own before checking the steps. Third, revise the ratios table and the one-page recap the night before your test.
The genetic disorders table at the end is the chapter’s most direct application — make it second nature.
Chapter 4 at a Glance: What to Revise and Where
This chapter belongs to Unit VII — Genetics and Evolution — and feeds directly into the next two chapters: Molecular Basis of Inheritance (how genes work chemically) and Evolution (how variation acts on populations over time). If you are coming from the reproduction unit, our Reproductive Health notes complete that unit for you.
The table below maps the NCERT section numbers to their topics and textbook pages, so you can jump straight to a weak area.
| NCERT section | Topic | Textbook pages |
|---|---|---|
| 4.1 | Mendel’s Laws of Inheritance | 54–55 |
| 4.2 | Inheritance of One Gene | 55–62 |
| 4.3 | Inheritance of Two Genes | 62–68 |
| 4.4 | Polygenic Inheritance | 69 |
| 4.5 | Pleiotropy | 69 |
| 4.6 | Sex Determination | 69–71 |
| 4.7 | Mutation | 72 |
| 4.8 | Genetic Disorders | 72–76 |
| Summary | Whole-chapter recap | 77–78 |
The official textbook PDF of this chapter, including every figure and the exercise set, is freely available on the NCERT website — keep it open whenever a figure or an exercise needs a closer look.
Mendel and the Pea Plant: True-Breeding Lines and Seven Contrasting Traits
Gregor Mendel crossed garden peas for seven years (1856–1863) and was the first biologist to apply statistical analysis and mathematical logic to problems of heredity. His experiments used a large sampling size, so the ratios he found were credible, and he confirmed his inferences on successive generations of plants (NCERT, p. 54).
Why the garden pea was the right choice:
- True-breeding lines — after continuous self-pollination, these lines show stable trait inheritance for several generations, so Mendel knew his parents were pure (NCERT, p. 54).
- Opposing traits — each character existed as two clear alternatives, e.g. tall or dwarf, yellow or green seeds.
- Controlled crosses — artificial pollination let Mendel decide exactly which plants became parents.
- Large samples — enough offspring in every generation for the ratios to be trustworthy.
He selected 14 true-breeding varieties — seven pairs that differed in just one character. The seven characters are listed in Table 4.1 of the textbook (NCERT, p. 55).
| S.No. | Character | Contrasting traits |
|---|---|---|
| 1 | Stem height | Tall / dwarf |
| 2 | Flower colour | Violet / white |
| 3 | Flower position | Axial / terminal |
| 4 | Pod shape | Inflated / constricted |
| 5 | Pod colour | Green / yellow |
| 6 | Seed shape | Round / wrinkled |
| 7 | Seed colour | Yellow / green |
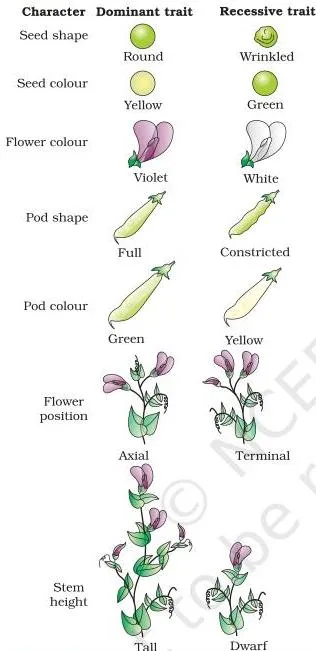
Figure 4.1 shows all seven characters at once, each with its two alternative forms. These are the exact trait pairs Mendel followed through his crosses and counted in every generation.
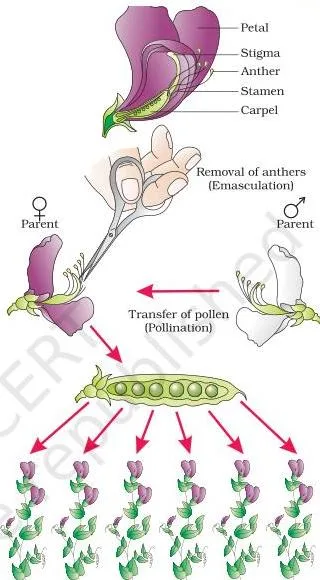
Figure 4.2 traces the steps of a pea cross, from opening the flower to transferring pollen and raising the next generation. This controlled technique is why Mendel could be certain which parents produced each batch of seeds.
The Monohybrid Cross: Punnett Squares and the 3:1 Ratio
The monohybrid cross follows a single gene. Mendel’s tall × dwarf cross is the model case (NCERT, pp. 55–56).
- Parents: TT (tall) × tt (dwarf) — both homozygous and true-breeding.
- Gametes: the tall plant makes T gametes; the dwarf plant makes t gametes.
- F1: all zygotes are Tt — and all are tall, like the TT parent.
- F1 selfing: Tt × Tt produces gametes T and t in equal proportion.
- F2: genotypes 1 TT : 2 Tt : 1 tt; phenotypes 3 tall : 1 dwarf (NCERT, p. 58).
Terms to fix now (they appear in every cross):
- Genotype — the genetic constitution, e.g. TT, Tt, tt.
- Phenotype — the visible expression, e.g. tall, dwarf.
- Homozygous — two identical alleles (TT or tt).
- Heterozygous — two different alleles (Tt).
- Dominant — the allele expressed in the heterozygote (T).
- Recessive — the allele masked in the heterozygote (t).
Why T is dominant: the F1 heterozygote Tt looks exactly like the TT parent, so one allele clearly masks the other. Since the Tt plant is heterozygous for one character (height), it is a monohybrid, and the TT × tt cross is a monohybrid cross (NCERT, p. 57).
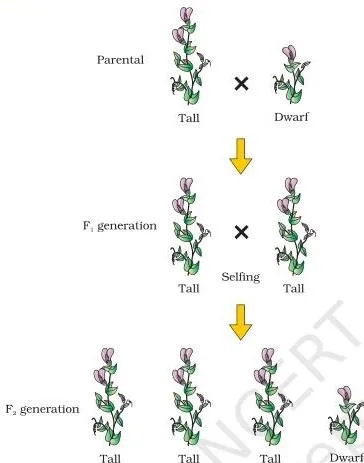
Figure 4.3 is the whole cross in one diagram. Notice the dwarf trait vanishes in F1 and reappears unchanged in one quarter of F2 — the traits never blended, so the dwarf character had stayed intact inside the F1 plants all along.
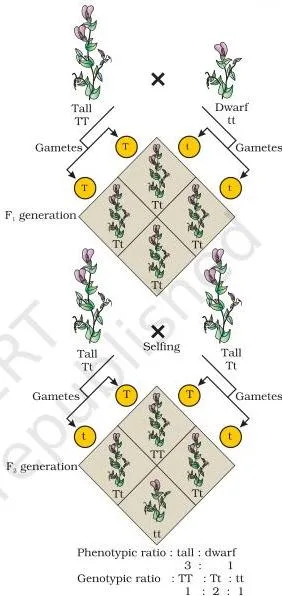
The Punnett square (Figure 4.4) is a graphical device for calculating the probability of every possible genotype; it was developed by the British geneticist Reginald C. Punnett (NCERT, p. 57). Gametes of one parent go across the top, gametes of the other down the left side, and each box is one possible fertilisation.
In the F2 square, random fertilisation gives 1/4 TT, 1/2 Tt and 1/4 tt.
Because both TT and Tt look tall, the visible ratio is 3 tall : 1 dwarf while the genotypic ratio stays 1:2:1. The F2 counts can also be seen as the binomial expansion (NCERT, p. 58):
\[ \left( \frac{1}{2}\text{T} + \frac{1}{2}\text{t} \right)^2 = \frac{1}{4}\text{TT} + \frac{1}{2}\text{Tt} + \frac{1}{4}\text{tt} \]
The Test Cross: Revealing a Hidden Genotype
A tall plant in F2 could be TT or Tt, and its appearance cannot tell you which — phenotype alone is not enough (NCERT, p. 58). Mendel solved this with the test cross: cross the organism showing the dominant phenotype with the homozygous recessive parent.
- If all offspring show the dominant trait, the tested parent is almost certainly TT.
- If roughly half the offspring show the recessive trait, the tested parent is Tt.
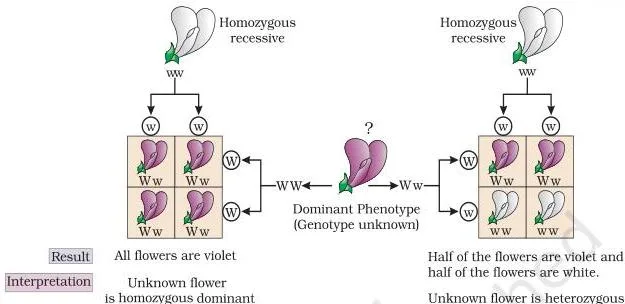
Figure 4.5 shows the logic with flower colour, where violet (V) is dominant over white (v). The violet plant of unknown genotype is crossed with a white (vv) plant, and the offspring pattern exposes the hidden genotype. Try it yourself: draw the Punnett square for Vv × vv — you should get 1 violet : 1 white, while VV × vv gives all violet (NCERT, pp. 58–59).
Mendel’s Laws: Dominance and Segregation
From his monohybrid crosses Mendel proposed two laws (NCERT, p. 59).
Law of Dominance rests on three claims:
- Characters are controlled by discrete units called factors (today, genes).
- Factors occur in pairs.
- In a dissimilar pair, one factor dominates the other.
This law explains why the F1 shows only one parental trait and why the F2 shows the 3:1 proportion.
Law of Segregation states that the two alleles of a pair separate during gamete formation, so each gamete receives only one allele. A homozygous parent makes one kind of gamete; a heterozygous parent makes two kinds in equal proportion. Because the alleles do not blend, both parental characters are recovered intact in F2 even when one was invisible in F1.
Why dominance exists (the enzyme explanation): imagine a gene that codes for an enzyme needed to convert a substrate S. In a heterozygote, the normal allele supplies the functional enzyme. The modified allele may produce a less efficient enzyme, a non-functional enzyme, or no enzyme at all.
The phenotype then depends entirely on the working allele — that allele is dominant, and the modified one is recessive (NCERT, pp. 60–61).
Misconception autopsy — dominance is not a fixed property of a gene. The pea starch gene has two alleles, B and b. BB homozygotes synthesise starch efficiently and make large grains (round seeds); bb homozygotes make small grains (wrinkled seeds); Bb makes seed of intermediate grain size — yet Bb seeds are still round.
So for seed shape, B is dominant, but for starch grain size, the very same alleles behave as incompletely dominant. Dominance therefore depends on the particular phenotype you choose to examine (NCERT, p. 62).
Incomplete Dominance, Co-dominance and Multiple Alleles
Not every gene follows complete dominance. In the snapdragon or dog flower (Antirrhinum), a cross between true-breeding red (RR) and white (rr) plants gives an F1 of genotype Rr with pink flowers — a phenotype in between the parents (NCERT, p. 60).
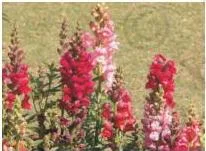
Figure 4.6 shows what happens after selfing the pink F1: the F2 is 1 red : 2 pink : 1 white. The genotypic ratio is still the Mendelian 1:2:1 — only the phenotype ratio has changed, because R is not completely dominant over r, so the heterozygote can be told apart from both homozygotes.
The table below is the fastest way to separate the three modes of inheritance.
| Mode | F1 phenotype | Classic example | F2 phenotype ratio |
|---|---|---|---|
| Complete dominance | Like one parent | Pea height (TT and Tt both tall) | 3:1 |
| Incomplete dominance | Intermediate between parents | Snapdragon flower colour (pink) | 1:2:1 |
| Co-dominance | Both parental traits appear together | AB blood group (both A and B sugars) | — |
Co-dominance is seen in the ABO blood groups, controlled by the gene I (NCERT, p. 61). The gene has three alleles: IA, IB and i. IA and IB make slightly different sugars on red blood cell surfaces, while i makes no sugar.
IA and IB are each dominant over i, but when IA and IB are together, both sugars are expressed — that is co-dominance.
| Genotype | Blood group of offspring |
|---|---|
| IAIA or IAi | A |
| IBIB or IBi | B |
| IAIB | AB |
| ii | O |
Memory device: allele i produces no sugar — the i is silent — so ii gives blood group O. With three alleles there are six possible genotype combinations but only four blood groups (NCERT, p. 61).
The ABO system is also the chapter’s example of multiple alleles: more than two alleles of a gene exist in a population, but a diploid individual carries only two. That is why multiple alleles become visible only in population studies (NCERT, p. 62).
The Dihybrid Cross and the Law of Independent Assortment
A dihybrid cross follows two characters at once. Mendel crossed plants with round yellow seeds (RRYY) and wrinkled green seeds (rryy). All F1 seeds were round and yellow, so yellow dominates green and round dominates wrinkled (NCERT, p. 62).
When the F1 (RrYy) was selfed, each trait behaved as a separate monohybrid cross: 3 yellow : 1 green and 3 round : 1 wrinkled. Because the two traits combine, the F2 phenotypes appear in the ratio 9:3:3:1 (NCERT, p. 64):
\[ (3\ \text{Round} : 1\ \text{Wrinkled})(3\ \text{Yellow} : 1\ \text{Green}) = 9:3:3:1 \]
| F2 phenotype | Count out of 16 |
|---|---|
| Round, yellow | 9 |
| Wrinkled, yellow | 3 |
| Round, green | 3 |
| Wrinkled, green | 1 |
The F1 plant RrYy makes four gamete types — RY, Ry, rY and ry — each at a frequency of 1/4. This happens because the segregation of R from r (50:50) is independent of the segregation of Y from y (50:50), so the four combinations form in equal proportions (NCERT, p. 64).
(The textbook’s Figure 4.7 shows the full 16-square cross — revise it from the book if you need the complete grid.)
From this Mendel proposed the Law of Independent Assortment: when two pairs of traits are combined in a hybrid, the segregation of one pair of characters is independent of the other pair (NCERT, p. 64).
Two cautions:
- The F2 genotypic ratio is not 9:3:3:1 — it is 1:2:1:2:4:2:1:2:1. The 9:3:3:1 belongs to phenotypes only.
- Independent assortment holds only for genes on different chromosomes (or far apart on the same chromosome). Linked genes violate it — that is the next section.
Chromosomal Theory, Linkage and Recombination
Mendel’s 1865 work stayed unrecognised until 1900, when de Vries, Correns and von Tschermak independently rediscovered his results. By then, microscopy had revealed chromosomes, and by 1902 Walter Sutton and Theodore Boveri saw that chromosome behaviour mirrors gene behaviour (NCERT, p. 65).
| Genes | Chromosomes |
|---|---|
| Occur in pairs | Occur in pairs |
| Segregate at gamete formation; one of each pair reaches a gamete | Segregate at gamete formation; one of each pair reaches a gamete |
| One pair segregates independently of another pair | Independent pairs segregate independently of each other |
This parallel (Table 4.3, NCERT pp. 65–66) became the chromosomal theory of inheritance: the pairing and separation of chromosomes explains the segregation of the factors they carry (NCERT, p. 67).
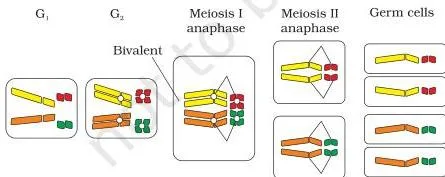
Figure 4.8 shows meiosis in a cell with four chromosomes: watch the homologous partners separate as germ cells form. That separation is the physical mechanism behind the Law of Segregation — genes follow the same rule because they ride on these chromosomes.
Morgan’s verification: Thomas Hunt Morgan worked with the fruit fly Drosophila melanogaster, which was ideal because it completes its life cycle in about two weeks, a single mating gives many offspring, the sexes are clearly different, and many hereditary variations can be seen under a low-power microscope (NCERT, p. 67).
When Morgan crossed flies differing in two characters whose genes were on the same chromosome, the F2 ratio deviated significantly from 9:3:3:1. He concluded that the two genes did not segregate independently.
- Linkage — the physical association of genes on the same chromosome.
- Recombination — the generation of non-parental gene combinations (NCERT, p. 67).
Morgan also found that linkage strength varies. The genes for white eye and yellow body were tightly linked, showing only 1.3% recombination, while white eye and miniature wing were loosely linked, with 37.2% recombination. His student Alfred Sturtevant then used recombination frequency as a measure of distance between genes and mapped their positions on chromosomes (NCERT, pp. 67–68).
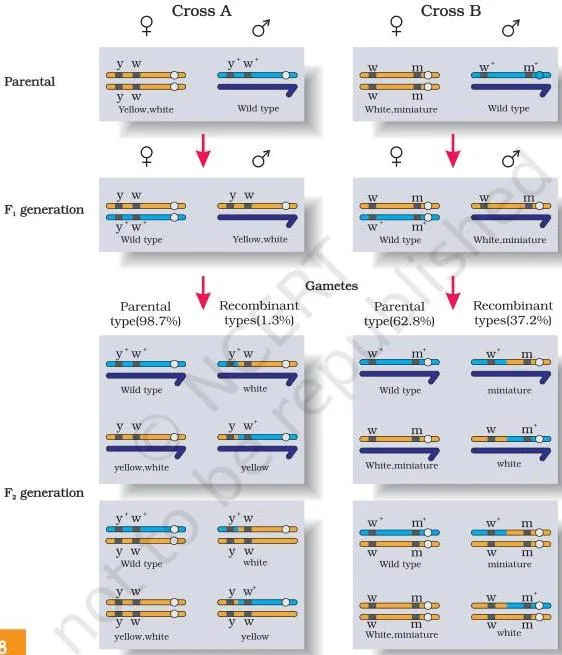
Figure 4.11 compares Morgan’s two crosses. Cross A involves genes y and w — tightly linked, so parental combinations far outnumber recombinants. Cross B involves w and m — loosely linked, so more recombinant offspring appear.
Edge case to remember: independent assortment fails for closely placed genes on the same chromosome. Think of two genes as beads on a single string: the farther apart they sit, the more often a recombination event separates them — which is exactly why the white–yellow pair recombines rarely and the white–miniature-wing pair recombines often.
Polygenic Inheritance and Pleiotropy
Mendel’s pea traits came in discrete alternatives, but many human traits — height, skin colour — spread across a gradient. Such traits are polygenic: they are controlled by three or more genes and are influenced by the environment. The effect of each dominant allele is additive (NCERT, p. 69).
Using the chapter’s skin colour model with three genes A, B and C:
- AABBCC (all dominant alleles) — the darkest skin colour.
- aabbcc (all recessive alleles) — the lightest skin colour.
- Three dominant and three recessive alleles — an intermediate colour.
The number of dominant alleles in the genotype determines how dark or light the skin is.
Pleiotropy is the opposite situation: a single gene influencing multiple phenotypes, usually because the gene product works in a metabolic pathway that feeds several traits (NCERT, p. 69). The chapter’s example is phenylketonuria — one mutation in the gene for the enzyme phenylalanine hydroxylase produces both mental retardation and reduced hair and skin pigmentation.
Sex Determination: From Humans to Honey Bees
The first clue to the chromosomal mechanism came from insects. In 1891 Henking traced a structure he called the X body through spermatogenesis — 50% of sperm received it and 50% did not. Later work identified it as a chromosome, and it was named the X chromosome (NCERT, pp. 69–70).
| System | Example | Female | Male | Heterogametic parent |
|---|---|---|---|---|
| XO | Grasshopper | XX | XO (one X only) | Male |
| XY | Humans, Drosophila | XX | XY | Male |
| ZW | Birds | ZW | ZZ | Female |
| Haplodiploid | Honey bee | Diploid (32) | Haploid (16) | Female |
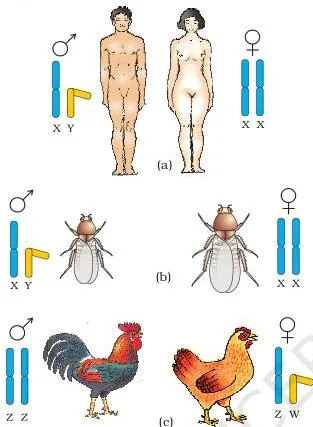
Figure 4.12 lines up the two main systems: humans and Drosophila use XX (female) and XY (male); many birds use ZW (female) and ZZ (male). In the XY and XO systems, males make two kinds of gametes, so the male is heterogametic; in birds the female is heterogametic because her eggs carry either Z or W (NCERT, p. 70).
In humans: of the 23 pairs of chromosomes, 22 pairs are autosomes, identical in both sexes. A female has a pair of X chromosomes; a male has an X and a Y. During spermatogenesis, males produce two gamete types — 50% carry X and 50% carry Y — while females make only X-bearing eggs.
Fertilisation is equally likely with either sperm type, so each pregnancy has a 50% chance of a boy and a 50% chance of a girl (NCERT, p. 71).
Mnemonic: father is decisive — the genetic makeup of the sperm determines the child’s sex. The textbook is emphatic that women should never be blamed for the sex of a child, since the ovum contributes only an X (NCERT, p. 71).
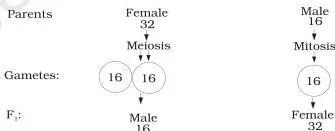
Honey bees use a haplodiploid system, shown in Figure 4.13. A fertilised egg develops into a female (queen or worker) with 32 chromosomes; an unfertilised egg develops into a male drone with 16 chromosomes, by parthenogenesis. Because drones come from unfertilised eggs, they produce sperm by mitosis, have no father, and can have grandsons but not sons (NCERT, p. 71).
Mutation and Pedigree Analysis
A mutation is an alteration of DNA sequences that changes the genotype and consequently the phenotype. Alongside recombination, it is a second source of variation in DNA (NCERT, p. 72).
- Chromosomal aberrations — loss (deletions) or gain (insertions/duplications) of a DNA segment; such aberrations are commonly observed in cancer cells (NCERT, p. 72).
- Point mutation — a change in a single base pair of DNA; the classic example is sickle-cell anaemia (NCERT, p. 72).
- Frame-shift mutations — caused by deletions and insertions of base pairs (NCERT, p. 72).
- Mutagens — chemical and physical factors that induce mutations; UV radiation is one such mutagen (NCERT, p. 72).
Pedigree analysis exists because controlled crosses, which are routine in peas, are impossible in humans. Instead, geneticists trace a trait through several generations of a family and represent its inheritance in a family tree — that is a pedigree (NCERT, p. 72).
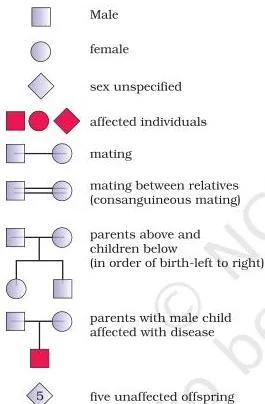
Figure 4.13 gives the standard symbols — learn them, because every pedigree question is read through this notation. A pedigree lets you decide whether a disorder is dominant or recessive, and whether it is linked to the sex chromosomes; Figure 4.14 in the next section shows what dominant and recessive pedigrees actually look like (NCERT, p. 73).
Mendelian Disorders: Single Gene, Clear Patterns
Mendelian disorders are caused by mutation in a single gene and are transmitted exactly along the same lines as Mendel’s pea traits. They may be dominant or recessive, and autosomal or sex-linked. The common ones named in the chapter are haemophilia, cystic fibrosis, sickle-cell anaemia, colour blindness, phenylketonuria and thalassemia (NCERT, p. 73).
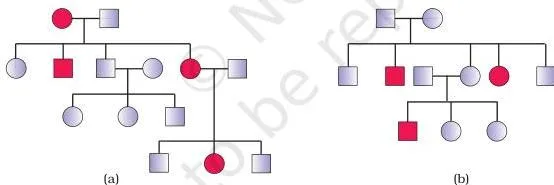
Figure 4.14 contrasts a real autosomal dominant pedigree (myotonic dystrophy) with an autosomal recessive one (sickle-cell anaemia). Compare how the dominant trait keeps appearing in generation after generation while the recessive trait can skip carriers — pedigree analysis exposes exactly this difference (NCERT, p. 73).
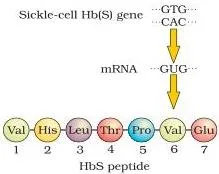
Figure 4.15 shows normal biconcave red blood cells next to sickle-shaped ones, plus the one-amino-acid change in the beta globin chain. Memorise the molecular change in both languages: at the protein level, glutamic acid is replaced by valine at the sixth position; at the DNA level, the sixth codon of the beta globin gene changes from GAG to GUG.
The mutant haemoglobin polymerises under low oxygen, dragging the cell into its sickle shape (NCERT, pp. 74–75).
| Disorder | Inheritance | Defect | Key feature |
|---|---|---|---|
| Colour blindness | X-linked recessive | Defect in either red or green cone of the eye | Cannot discriminate red from green; about 8% of males but only about 0.4% of females (NCERT, pp. 73–74) |
| Haemophilia | X-linked recessive | A single clotting protein of the blood-clotting cascade is defective | Non-stop bleeding from a simple cut; carrier mothers can pass it to sons (NCERT, p. 74) |
| Sickle-cell anaemia | Autosomal recessive | GAG → GUG in the sixth codon; glutamic acid → valine in beta globin | RBCs become sickle-shaped under low oxygen; HbA/HbB alleles, only HbBHbB is diseased (NCERT, pp. 74–75) |
| Phenylketonuria | Autosomal recessive | Missing enzyme that converts phenylalanine to tyrosine | Accumulation of phenylpyruvic acid in the brain causes mental retardation (NCERT, p. 75) |
| Thalassemia | Autosomal recessive | Reduced synthesis of alpha or beta globin chains | Abnormal haemoglobin → anaemia; a quantitative problem (too few globin molecules) (NCERT, p. 75) |
Two genetic details worth keeping separate:
- Alpha thalassemia is controlled by two closely linked genes, HBA1 and HBA2 on chromosome 16; beta thalassemia by a single gene, HBB on chromosome 11 (NCERT, p. 75).
- Thalassemia is quantitative — too few globin molecules; sickle-cell is qualitative — an incorrectly functioning globin (NCERT, p. 75).
Chromosomal Disorders: Aneuploidy and Polyploidy
Chromosomal disorders arise from the absence, excess or abnormal arrangement of one or more chromosomes (NCERT, p. 75).
- Aneuploidy — gain or loss of one or more chromosomes, caused by failure of chromatid segregation during cell division. Trisomy (an extra copy) and monosomy (a missing copy) are both aneuploid conditions.
- Polyploidy — an increase in a whole set of chromosomes, caused by failure of cytokinesis after telophase; this condition is often seen in plants (NCERT, p. 75).
A normal human cell carries 46 chromosomes — 22 pairs of autosomes plus one pair of sex chromosomes (NCERT, p. 75).
| Syndrome | Chromosomal condition | Key features |
|---|---|---|
| Down’s syndrome | Trisomy of chromosome 21 (47 chromosomes) | Short stature, small round head, furrowed tongue, partially open mouth, broad palm with a characteristic crease, retarded physical and mental development; first described by Langdon Down in 1866 (NCERT, p. 76) |
| Klinefelter’s syndrome | 47, XXY — an extra X chromosome | Overall masculine development with gynaecomastia (breast development); sterile (NCERT, p. 76) |
| Turner’s syndrome | 45, X0 — one X chromosome missing | Female with rudimentary ovaries; sterile; underdeveloped secondary sexual characters (NCERT, p. 76) |
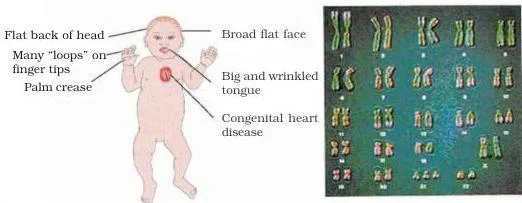
Figure 4.16 pairs an individual with Down’s syndrome with the matching karyotype — count 47 chromosomes, the extra copy of chromosome 21 being the cause. The textbook’s Figure 4.17 diagrams the sex-chromosome disorders: Klinefelter’s (tall stature with feminised character) and Turner’s (short stature and underdeveloped feminine character) — revise it from the book.
Key Terms in Inheritance: Quick Definitions
Every term below is used somewhere in this chapter’s crosses and disorder tables. Keep this glossary as your anchor while revising.
| Term | Meaning | Example from this chapter |
|---|---|---|
| Inheritance | The passing of characters from parents to progeny; the basis of heredity | Height passing from pea parents to F1 |
| Variation | The degree to which progeny differ from their parents | Dwarf plants appearing in the F2 |
| Allele | An alternative form of a gene | T and t for height |
| Genotype | The genetic constitution of an individual | TT, Tt, tt |
| Phenotype | The observable expression of the genotype | Tall, dwarf |
| Homozygous | Having two identical alleles of a gene | TT, tt |
| Heterozygous | Having two different alleles of a gene | Tt |
| Dominant | The allele that is expressed in the heterozygote | T for tall |
| Recessive | The allele that is masked in the heterozygote | t for dwarf |
| Monohybrid cross | A cross following the inheritance of one gene | TT × tt |
| Test cross | Crossing a dominant-phenotype organism with the homozygous recessive parent to reveal its genotype | Checking whether a tall pea is TT or Tt |
| Linkage | The physical association of genes on the same chromosome | White-eye and yellow-body genes in Drosophila |
| Recombination | The generation of non-parental gene combinations | 37.2% recombination between w and m |
| Polygenic inheritance | A trait controlled by three or more additive genes, with environmental influence | Human height and skin colour |
| Pleiotropy | One gene affecting more than one phenotype | Phenylketonuria |
| Mutation | An alteration in DNA sequences that changes genotype and phenotype | Point mutation causing sickle-cell anaemia |
| Point mutation | A change of a single base pair in DNA | GAG → GUG in the beta globin gene |
| Pedigree analysis | Tracing the inheritance of a trait through several generations of a family | Detecting dominant vs recessive disorders |
| Aneuploidy | Gain or loss of one or more chromosomes | Down’s (trisomy 21), Turner’s (XO) |
| Polyploidy | Increase in whole sets of chromosomes | Common in plants |
Ratios and Rules to Memorise
This is the chapter’s formula box. Every cross question in this chapter ultimately tests one of these.
| Item | Value | NCERT pages |
|---|---|---|
| Monohybrid F2 phenotype ratio | 3:1 | pp. 57–58 |
| Monohybrid F2 genotype ratio | 1:2:1 | p. 58 |
| Test cross outcome (Tt × tt) | 1 dominant : 1 recessive | pp. 58–59 |
| Dihybrid F2 phenotype ratio | 9:3:3:1 | p. 64 |
| Dihybrid F2 genotype ratio | 1:2:1:2:4:2:1:2:1 | p. 64 |
| Gamete types for n heterozygous loci | \( 2^n \) | derived from p. 64 |
| Binomial expansion of the monohybrid F2 | \( (\frac{1}{2}\text{T} + \frac{1}{2}\text{t})^2 = \frac{1}{4}\text{TT} + \frac{1}{2}\text{Tt} + \frac{1}{4}\text{tt} \) | p. 58 |
| Recombination frequency vs distance | Tightly linked: 1.3%; loosely linked: 37.2% | p. 67 |
| Human sex ratio per pregnancy | 50% male : 50% female | p. 71 |
| Aneuploidy vs polyploidy | Loss/gain of one or more chromosomes vs increase in whole chromosome sets | p. 75 |
Worked Examples: Solving Inheritance Crosses
All cross problems in this chapter run on the same four-step method:
- Identify dominance — read which phenotype is dominant and which is recessive.
- Assign symbols — pick one letter per gene; capital for the dominant allele, lowercase for the recessive.
- Write gametes — each gamete gets one allele per gene; for two heterozygous genes, combine them in all four ways.
- Fill the Punnett square — combine each row gamete with each column gamete, then count phenotypes (and genotypes if asked).
Example 1: A test cross that reveals a hidden genotype (guinea pigs)
Method: test-cross reasoning — a recessive phenotype is always homozygous, and the offspring pattern exposes the other parent.
Step 1: In guinea pigs, black coat B is dominant over white b.
A black guinea pig crossed with a white one produced roughly equal numbers of black and white pups.
The white parent receives a b from each parent, so it must be bb.
Step 2: Test the other possibility.
If the black parent were BB, every pup would inherit B from it and all pups would be black.
Step 3: Since roughly half the pups are white, the black parent must have contributed b to those pups.
Its genotype is therefore Bb.
Step 4 (check): Bb × bb gives Bb (black) and bb (white) in a 1:1 ratio — which matches the equal numbers observed.
Final answer: the black parent is heterozygous, Bb.
Example 2: Counting one dominant and one recessive trait in a dihybrid selfing
Method: four-gamete Punnett square for a double heterozygote.
Step 1: A plant heterozygous for two traits, AaBb, is selfed.
We want the fraction of offspring that show the dominant phenotype for gene A and the recessive phenotype for gene B (imagining, say, purple flowers with wrinkled seeds — the exact characters do not change the arithmetic).
Step 2: Dominance: A over a, B over b.
The gametes of AaBb are AB, Ab, aB and ab, each at a frequency of 1/4.
Step 3: Build the 4 × 4 square (16 boxes).
The recessive phenotype for B means bb, which appears in four boxes: AAbb, Aabb, Aabb and aabb.
Step 4: Of those four, three carry at least one A (AAbb and the two Aabb), so they show the dominant phenotype for gene A.
Counting squares gives 3 of 16.
Check by multiplication: probability of dominant phenotype for A alone = 3/4; probability of recessive phenotype for B alone = 1/4.
Combined: \( \frac{3}{4} \times \frac{1}{4} = \frac{3}{16} \).
Final answer: \( \frac{3}{16} \) of the offspring show the dominant phenotype for the first gene and the recessive phenotype for the second.
Example 3: Counting gamete types
Method: gamete-counting rule — each heterozygous locus doubles the number of gamete types.
- Step 1: An organism heterozygous at three loci, AaBbCc, produces \( 2^3 = 8 \) gamete types: ABC, ABc, AbC, Abc, aBC, aBc, abC and abc, each at frequency 1/8.
- Step 2: Generalise: heterozygous at n loci gives \( 2^n \) gamete types.
This follows from the dihybrid case, where RrYy (two heterozygous loci) made \( 2^2 = 4 \) gamete types (NCERT, p. 64).
Step 3: The chapter’s exercise on a diploid organism heterozygous for four loci uses the same rule with n = 4.
Final answer: gamete types = \( 2^n \), where n is the number of heterozygous loci.
Common Mistakes in Inheritance Problems
Catch these errors before they cost you marks. Each row is the mistake, the correction, and a way to check yourself.
| Mistake | Correct rule | How to check your answer |
|---|---|---|
| Writing 3:1 as the genotypic ratio of a monohybrid F2 | 3:1 is the phenotypic ratio; the genotypic ratio is 1:2:1 | Ask if you are counting appearances or allele combinations; TT and Tt look identical (NCERT, p. 58) |
| Assuming any dominant phenotype is homozygous | A dominant phenotype can be TT or Tt | Do a test cross with the homozygous recessive; the offspring pattern decides (NCERT, p. 58) |
| Assuming two genes always assort independently | Linked genes on the same chromosome give an excess of parental combinations and deviate from 9:3:3:1 | Check whether the genes share a chromosome; Morgan’s Drosophila crosses show the deviation (NCERT, p. 67) |
| Confusing incomplete dominance with co-dominance | Incomplete dominance gives an intermediate F1 (pink snapdragon); co-dominance shows both parental traits together (AB blood) | Compare the F1 with both parents: in-between means incomplete, both shown means co-dominance (NCERT, pp. 60–61) |
| Treating colour blindness and haemophilia as autosomal | Both are X-linked recessive | They are far more common in males, who have a single X chromosome (NCERT, pp. 73–74) |
| Mixing up sickle-cell anaemia and thalassemia | Sickle-cell is qualitative (incorrectly functioning globin); thalassemia is quantitative (too few globin molecules) | One is a wrong protein, the other is a shortage of protein (NCERT, p. 75) |
| Saying ABO blood groups have only two alleles | The I gene has three alleles — IA, IB and i — in the population | An individual carries only two, but population studies reveal all three (NCERT, pp. 61–62) |
Exam Notes: How to Write Chapter 4 Answers
The chapter’s exercise set appears on page 78, and the questions fall into a few repeating formats. Prepare a response structure for each format and you can answer any of them.
- Differentiate questions — write a two-column table with one contrast per row. The chapter asks for dominance vs recessive, homozygous vs heterozygous, and monohybrid vs dihybrid.
- Explain-the-law questions — state the law, define the symbols you use, write the parental cross, then give both the F1 and F2 ratios, genotype and phenotype (NCERT, p. 59).
- Define and design a test cross — define it as a cross of a dominant phenotype with the homozygous recessive parent, then show the two possible outcomes in a Punnett square (NCERT, pp. 58–59).
- Punnett-square questions — draw the square with the gametes labelled on the two sides, and label every offspring’s genotype and phenotype. That labelling is where completeness is won.
- Pedigree questions — define pedigree analysis as tracing a trait through several generations of a family, and state why it is needed: controlled crosses are impossible in humans (NCERT, p. 72).
- Sex-determination questions — write the chromosomal formula (22 pairs of autosomes plus XX or XY), state that the sperm’s sex chromosome decides the child’s sex, and give the 50:50 probability (NCERT, p. 71).
- Morgan’s contribution — tie his Drosophila crosses to linkage, recombination, and the mapping of genes using recombination frequency (NCERT, p. 67).
- Autosomal disorder questions — name two from the chapter and give the inheritance pattern plus symptoms for each (NCERT, p. 73).
For the question on the advantages of the pea plant, use only the chapter’s own points: true-breeding lines, clear contrasting traits, controlled artificial pollination, and the credibility given by a large sampling size (NCERT, p. 54).
One-Page Revision Recap
Mendel’s laws
| Law | Statement | What it explains |
|---|---|---|
| Dominance | Characters are controlled by discrete factors that occur in pairs; in a dissimilar pair, one dominates the other | Why the F1 shows only one parental trait and the F2 is 3:1 |
| Segregation | Alleles of a pair separate during gamete formation; each gamete receives one allele | Why the recessive trait reappears unchanged in one quarter of the F2 |
| Independent assortment | Segregation of one pair of traits is independent of another pair | Why a dihybrid F2 is 9:3:3:1 |
Crosses and ratios
| Cross | Parents | F1 | F2 ratio |
|---|---|---|---|
| Monohybrid | TT × tt | All Tt (tall) | Phenotype 3:1; genotype 1:2:1 |
| Test cross | T? × tt | — | 1 dominant : 1 recessive if parent is Tt; all dominant if TT |
| Dihybrid | RRYY × rryy | All RrYy (round, yellow) | 9:3:3:1 |
Genetic disorders
| Disorder | Inheritance | Defect and feature |
|---|---|---|
| Colour blindness | X-linked recessive | Red/green cone defect; far commoner in males |
| Haemophilia | X-linked recessive | Defective clotting protein; non-stop bleeding |
| Sickle-cell anaemia | Autosomal recessive | Glu → Val in beta globin (GAG → GUG); RBCs sickle at low oxygen |
| Thalassemia | Autosomal recessive | Reduced alpha or beta globin synthesis; a quantitative defect |
| Down’s syndrome | Trisomy 21 | Short stature, furrowed tongue, broad palm with characteristic crease |
| Klinefelter’s syndrome | 47, XXY | Gynaecomastia; sterile |
| Turner’s syndrome | 45, X0 | Rudimentary ovaries; sterile |
Sex determination in one line: females are XX and males XY; the father’s sperm decides the child’s sex, with a 50:50 probability in every pregnancy. Mutation in one line: a point mutation changes a single base pair — sickle-cell anaemia is the example to quote.
This chapter’s variation story continues in Evolution notes — see how the variation you studied here becomes raw material for natural selection. For the other side of the unit, the Class 12 Biology notes hub holds every chapter. For other subjects, browse the Class 12 notes or start from the CBSE notes home page.
FAQs on Principles of Inheritance and Variation
Why do linked genes not give a 9:3:3:1 ratio in a dihybrid cross?
Independent assortment requires the two genes to be on different chromosomes, or far apart on the same chromosome. Linked genes are physically close on one chromosome, so they are inherited together more often than not.
Parental gene combinations therefore appear far more often than non-parental (recombinant) ones, and the F2 ratio deviates significantly from 9:3:3:1 — exactly what Morgan observed in Drosophila (NCERT, p. 67).
Why are colour blindness and haemophilia more common in males than females?
Both are X-linked recessive disorders. A male has only one X chromosome, so a single recessive allele produces the disorder. A female needs the recessive allele on both her X chromosomes; her matching normal allele usually masks it, making her a symptom-free carrier. That is why about 8% of males but only about 0.4% of females are colour blind (NCERT, pp. 73–74).
What is the difference between aneuploidy and polyploidy?
Aneuploidy is the gain or loss of one or a few chromosomes — caused by failure of chromatid segregation — and produces trisomy or monosomy, as in Down’s syndrome (trisomy 21) or Turner’s syndrome (XO). Polyploidy is an increase in whole sets of chromosomes, caused by failure of cytokinesis after telophase, and is often seen in plants (NCERT, p. 75).
How is ABO blood grouping both an example of codominance and multiple alleles?
It is codominance because when IA and IB are present together, both sugars are expressed on the red blood cells, producing group AB. It is multiple allelism because the I gene has three alleles — IA, IB and i — in the population, even though a diploid individual carries only two (NCERT, pp. 61–62).
Is a dominant trait always the more common trait in a population?
No. Dominance is about expression in the heterozygote, not about frequency in a population. The pea starch gene B/b shows that dominance is not even a fixed property of a gene: B looks dominant for seed shape but behaves as incompletely dominant for starch grain size.
The same allele pair can be dominant for one phenotype and incompletely dominant for another (NCERT, p. 62).
What is the difference between incomplete dominance and co-dominance?
In incomplete dominance the F1 phenotype is intermediate between the two parents — the pink snapdragon is between red and white. In co-dominance the F1 shows both parental traits at the same time — an IAIB individual has both A and B sugars. Incomplete dominance blends the phenotype; co-dominance expresses both versions simultaneously (NCERT, pp. 60–61).
Reference: NCERT Class 12 Biology textbook, chapter Principles of Inheritance and Variation.
Explore Class 12 Biology Notes
- Class 12 Biology Notes
- Class 12 CBSE Notes
- CBSE Notes for Classes 1 to 12
- Previous: Reproductive Health
- Next: Evolution
Class 12 Biology on LearnCBSE:
Related chapters:
- Sexual Reproduction in Flowering Plants notes
- Human Reproduction notes
- Human Health and Disease notes