
These notes compress Chapter 11: Organisms and Populations (NCERT pages 188–204) into a revision-ready form for Class 12 Biology. You get the key definitions, the growth equations with every symbol decoded, the six population interactions of Table 11.1, fully worked numericals, and the traps students repeat in exams — all without reopening the book.
The notes follow the 2026-27 session and the Rationalised NCERT textbook. The chapter belongs to Unit X: Ecology, grouped with Chapter 12: Ecosystem and Chapter 13: Biodiversity and Conservation.
Use the page in three passes: read Chapter 11 at a Glance for the big picture, work slowly through the equations and worked examples, then finish with the Rapid Revision tables on test morning.
Chapter 11 at a Glance: Where Population Ecology Fits
Ecology is the study of interactions among organisms and between organisms and their physical (abiotic) environment (NCERT, p. 191). It works at four levels of biological organisation — organisms, populations, communities and biomes. This chapter stays at the population level.
- Two question types (p. 190): how-type questions ask for the mechanism (“How does the bulbul sing?” → its voice box), while why-type questions ask for the significance (“Why does it sing?” → to communicate with its mate). Both lenses run through every topic below.
- Why populations matter: an individual is what copes with the environment, but natural selection operates on populations (p. 191). That is why population ecology links ecology to population genetics and evolution.
Did you know? Ramdeo Misra, the Father of Ecology in India, established ecology teaching and research at Banaras Hindu University and framed India’s first postgraduate ecology course (p. 189).
For the surrounding units, see the Class 12 Biology notes hub, the complete Class 12 notes collection and the CBSE Notes index.
Population Attributes: What Only a Group Can Have
A population is a group of individuals of the same species living in a defined geographical area, sharing or competing for similar resources and potentially interbreeding. Even a group formed by asexual reproduction counts as a population in ecological studies (p. 191).
An individual has births and deaths; only a population has birth rates and death rates. These are per capita — per individual in the population — so that populations of different sizes can be compared. If 30 lotus plants add 9 new plants, the birth rate is 0.3 offspring per lotus per year. The group-only attributes are:
- Birth rate / death rate: change in numbers expressed per individual per unit time.
- Natality: the number of births added to the initial density in a given period.
- Mortality: the number of deaths subtracted from the population in a given period.
- Sex ratio: the proportion of males and females (e.g. 60% females : 40% males, p. 191).
- Age pyramid: a bar diagram of the percentage of individuals in pre-reproductive, reproductive and post-reproductive age groups (Figure 11.1).
Reading the age pyramid (described here in words — no image needed): a broad base of pre-reproductives means a growing population, nearly equal bars mean a stable one, and a narrow base means a declining one. The shape is the quickest visual clue to a population’s growth status (p. 191).
Population Density: When Total Numbers Mislead
Population density (N) is the size of the population in a habitat (p. 192). It can be fewer than 10 Siberian cranes at Bharatpur or millions of Chlamydomonas in a pond. But raw numbers are not always the best measure:
- Percent cover or biomass is better when individual roles differ hugely — 200 Parthenium plants versus one giant banyan tree. The banyan’s ecological role is enormous, so its low number understates it.
- Biomass is the sensible measure for a dense laboratory culture of bacteria, where counting individuals is impossible.
- Relative density suffices for some investigations — for instance, fish caught per trap as a measure of the lake’s fish population.
- Indirect estimation: tigers are mostly estimated indirectly; the census is often based on pug marks and fecal pellets (p. 192).
Population Growth: Two Equations and Two Curves
The four processes that change density
Population density changes through four basic processes (pp. 192–193): natality (B) and immigration (I) increase density; mortality (D) and emigration (E) decrease it.
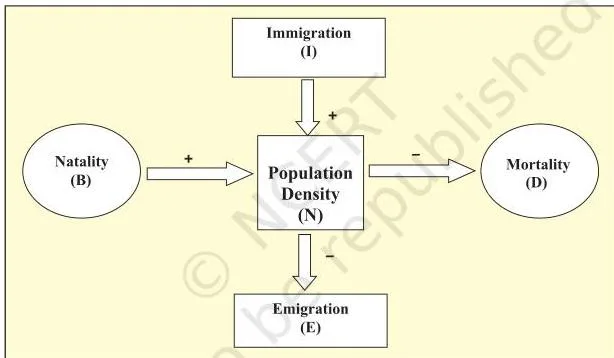
Figure 11.2 accompanies the equation below — together they show how the four processes combine to decide whether a population grows or shrinks. The density at the next time step is:
\[ N_{t+1} = N_t + [(B + I) – (D + E)] \]
Density increases when \( B + I \) exceeds \( D + E \). Births and deaths usually dominate, but immigration matters most when a new habitat is being colonised (p. 193).
Exponential growth
When resources are unlimited, every individual realises its full reproductive potential and growth is exponential (p. 194). With per-capita birth rate \( b \) and per-capita death rate \( d \):
\[ \frac{dN}{dt} = (b – d) \times N \]
Let \( r = b – d \), then:
\[ \frac{dN}{dt} = rN \]
r is the intrinsic rate of natural increase — the population’s innate potential to grow. Its magnitude varies widely (p. 194):
| Species / context | r value |
|---|---|
| Norway rat | 0.015 |
| Flour beetle | 0.12 |
| Human population, India 1981 | 0.0205 |
The integral form of the exponential equation is:
\[ N_t = N_0 e^{rt} \]
where \( N_t \) = density after time t, \( N_0 \) = density at time zero, \( r \) = intrinsic rate of increase, and \( e \) = 2.71828, the base of natural logarithms — a constant, not a variable. Plotting N against t gives a J-shaped curve. The chessboard anecdote — one grain doubling on each of 64 squares, or one Paramecium doubling daily — shows how explosively exponential growth builds (p. 195).
The textbook’s activity: find India’s current r value from census birth and death rates (p. 194).
Logistic growth
No habitat offers unlimited resources forever, so exponential growth cannot continue (p. 195). The habitat has a maximum supportable number — its carrying capacity (K).
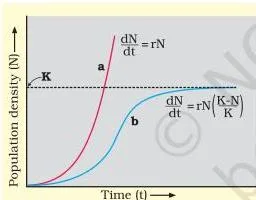
Curve a is exponential — the J-shape of unlimited resources. Curve b is logistic — it levels off at K, the maximum population the habitat can support. The Verhulst-Pearl logistic equation is:
\[ \frac{dN}{dt} = rN \left( \frac{K – N}{K} \right) \]
As N approaches K, the factor \( (K – N)/K \) shrinks toward zero, so growth slows. The curve shows four phases in order: lag, acceleration, deceleration, and finally an asymptote at K — a sigmoid (S-shaped) curve. Logistic growth is the more realistic model because real resources are finite and become limiting sooner or later (pp. 195–196).
Life History Variation: One Burst or Many Broods
Populations evolve to maximise their Darwinian fitness — a high r value — under their habitat’s constraints (p. 196). Two contrast pairs:
- Breed once in a lifetime: Pacific salmon, bamboo — versus breeding repeatedly: most birds and mammals.
- Many small offspring: oysters, pelagic fishes — versus few large offspring: birds, mammals.
The principle in one line: life history traits evolve in response to the abiotic and biotic constraints of the habitat in which the organism lives.
Population Interactions: Six Sign Patterns That Decide the Outcome
No natural habitat is single-species. Interactions between populations of two different species can be beneficial, detrimental or neutral, and Table 11.1 assigns signs: + beneficial, − detrimental, 0 neutral (p. 196). The six sign pairs: Mutualism (+,+), Competition (−,−), Predation (+, −), Parasitism (+, −), Commensalism (+, 0), Amensalism (−, 0).
Memory device: “My Cute Pet Parrot Can Amuse” keeps the six names in table order — Mutualism, Competition, Predation, Parasitism, Commensalism, Amensalism (M-C-P-P-C-A). The signs then follow a ladder: \((++)\) both win (mutualism), \((–)\) both lose (competition), \((+-)\) one wins and one loses (the two “P” interactions — predation and parasitism), \((+0)\) one free rider (commensalism), and \((-0)\) one victim with a bystander (amensalism).
Predation
- Nature’s way of transferring energy fixed by plants to higher trophic levels — a conduit of energy (p. 197).
- Keeps prey populations in check; without predators, prey density could rise and destabilise the ecosystem.
- Biological control rests on the predator’s ability to regulate prey: the prickly pear cactus, invasive in Australia from the early 1920s, was brought under control by introducing a cactus-feeding moth.
- Removing the starfish Pisaster from an intertidal area caused more than 10 invertebrate species to become extinct within a year (p. 198).
- Predators are “prudent” — overexploiting prey would drive both to extinction.
- Prey defences: camouflage (cryptic colouration) in insects and frogs; the Monarch butterfly’s distasteful chemical, acquired in its caterpillar stage from a poisonous weed.
- Plant defences: thorns (Acacia, Cactus); Calotropis’s poisonous cardiac glycosides (cattle never browse it); commercial chemicals such as nicotine, caffeine and quinine began as defences against grazers.
Competition
- Best defined as: the fitness (r) of one species is significantly lower in the presence of another species (p. 199).
- Unrelated species can compete — flamingoes and resident fishes in shallow South American lakes compete for zooplankton.
- Interference competition occurs even when resources are abundant; one species’s presence reduces the other’s feeding efficiency.
- Gause’s Competitive Exclusion Principle: two closely related species competing for the same limited resources cannot co-exist indefinitely.
- Abingdon tortoise became extinct within a decade after goats were introduced on its island.
- Competitive release: a species confined by a superior competitor expands dramatically when the competitor is removed — Connell’s barnacles (Balanus excluding Chathamalus on Scottish coasts).
- MacArthur’s five warbler species co-exist on the same tree through resource partitioning — different foraging behaviours.
Parasitism
- Parasites are often host-specific, and host and parasite co-evolve — each counters the other’s defences (p. 200).
- Adaptations: suckers or adhesive organs, loss of the digestive system, loss of unnecessary sense organs, high reproductive capacity.
- Ectoparasites (outside): lice on humans, ticks on dogs, and Cuscuta, a parasitic plant that has lost its chlorophyll and leaves.
- Endoparasites (inside): the liver fluke needs two intermediate hosts (a snail and a fish); the malarial parasite needs a mosquito vector.
- Brood parasitism: the koel lays its eggs in a crow’s nest; its eggs mimic the host’s so they are not ejected.
- The female mosquito is not a parasite — it needs blood only to mature its eggs (explained fully under Common Mistakes).
Commensalism
- One species benefits; the other is neither helped nor harmed (p. 201).
- Examples: an orchid growing as an epiphyte on a mango branch; barnacles on the back of a whale; cattle egrets feeding on insects flushed out by grazing cattle; the clown fish protected by the sea anemone’s stinging tentacles while the anemone gains nothing apparent.
Mutualism
- Both interacting species benefit (pp. 201–202).
- Lichens: a fungus with a photosynthesising alga or cyanobacterium. Mycorrhizae: fungi associated with plant roots — the fungus absorbs nutrients, the plant supplies carbohydrates.
- Fig and wasp: a tight one-to-one relationship — a given fig species is pollinated only by its partner wasp, which also lays eggs in the fruit (Figure 11.4, described in words: (a) fig flower being pollinated by the wasp; (b) the wasp laying eggs in a fig fruit).
- The Ophrys orchid uses sexual deceit — its petal resembles a female bee, the male bee “pseudocopulates” with the flower and carries pollen to the next one.
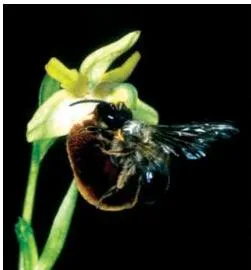
Figure 11.5 shows a bee pollinating an orchid flower. Orchids evolve floral patterns that attract the one right pollinator insect and guarantee pollination by it — a co-evolved plant–animal mutualism (p. 202).
Definitions Table: Every Key Term in One Place
This is the memorisation sheet for the chapter — each term, its meaning in one sentence, and a textbook example.
| Term | Meaning | Example from the chapter |
|---|---|---|
| Population | All same-species individuals in a defined area, sharing or competing for resources and potentially interbreeding. | Cormorants in a wetland |
| Population density (N) | The size of the population expressed for a habitat. | Banyan vs 200 Parthenium plants |
| Birth rate, death rate (per capita) | Births or deaths per individual in the population per unit time. | Lotus and fruitfly counts (p. 191) |
| Natality vs mortality | Births added to the initial density vs deaths removed from it in a given period. | Birds hatched vs birds lost in a season |
| Immigration | Same-species individuals entering the habitat from elsewhere. | Colonists of a newly invaded habitat |
| Emigration | Population members leaving the habitat for elsewhere. | Individuals moving out of a wetland |
| Sex ratio | The proportion of males and females in the population. | 60% females : 40% males |
| Age pyramid | Bar diagram of the percentage of individuals in pre-reproductive, reproductive and post-reproductive groups. | Broad base = growing population |
| Intrinsic rate of natural increase (r) | A population’s innate potential to grow; \( r = b – d \). | Norway rat r = 0.015 |
| Carrying capacity (K) | Maximum population size a habitat’s resources can support. | Asymptote of the sigmoid curve |
| Predation | One organism kills and consumes another; moves energy up trophic levels. | Sparrow eating a seed |
| Competitive Exclusion Principle | Two species competing for the same limited resource cannot co-exist indefinitely. | Gause’s laboratory experiments |
| Competitive release | A species expands its range when a superior competitor is removed. | Chathamalus after Balanus is removed |
| Resource partitioning | Competing species use the same resource differently to avoid competition. | MacArthur’s five warblers |
| Ectoparasite | Parasite feeding on the external surface of the host. | Lice, ticks, Cuscuta |
| Endoparasite | Parasite living inside the host’s body. | Liver fluke, malarial parasite |
| Brood parasitism | One bird lays its eggs in another bird’s nest for the host to incubate. | Koel in the crow’s nest |
| Commensalism | One species benefits; the other is neither helped nor harmed. | Barnacles on a whale |
| Amensalism | One species is harmed; the other is unaffected. | Sign pair (−, 0) in Table 11.1 |
| Mutualism | Both interacting species benefit. | Lichens; fig and wasp |
Growth Formulas: Symbols, Units and When to Use Them
All five equations of the chapter are collected below. If you want to double-check the source, the equations can be verified in the official NCERT textbook on the NCERT portal.
| Formula | What the symbols mean | What it tells you |
|---|---|---|
| \( N_{t+1} = N_t + [(B + I) – (D + E)] \) | N = density; B = births; D = deaths; I = immigration; E = emigration in the interval | Density after one time step (four-process rule) |
| \( \frac{dN}{dt} = (b – d) \times N \) | b = per-capita birth rate; d = per-capita death rate; N = density | Instantaneous growth rate in exponential growth |
| \( \frac{dN}{dt} = rN \) | r = b − d, the intrinsic rate of natural increase | Exponential growth when resources are unlimited |
| \( N_t = N_0 e^{rt} \) | \( N_t \) = density after time t; \( N_0 \) = density at time zero; e ≈ 2.71828 | Density after any time t in exponential growth |
| \( \frac{dN}{dt} = rN \left( \frac{K – N}{K} \right) \) | K = carrying capacity of the habitat | Logistic growth — rate falls to zero as N reaches K |
Units: N is in number of individuals; b and d are per capita per unit time; r is per individual per unit time (\( \text{time}^{-1} \), e.g. per year); e ≈ 2.71828 is a dimensionless constant — the base of natural logarithms, never a variable.
Method note — doubling time (a derivation the textbook does not print): at doubling, \( N_t = 2N_0 \). Substituting into \( N_t = N_0 e^{rt} \) gives \( 2 = e^{rt} \), so \( rt = \ln 2 \) and \( t = \frac{\ln 2}{r} \approx \frac{0.6931}{r} \). Rearranged, \( r = \frac{\ln 2}{t} \approx \frac{0.6931}{t} \).
This one division solves the textbook’s doubling question (Q2 of the exercises) — and explains why \( \ln 2 \approx 0.6931 \) appears in every doubling problem.
Worked Examples: Density, Birth Rate and Intrinsic Rate of Increase
Example 1: Applying the four-process density equation
Method: use \( N_{t+1} = N_t + [(B + I) – (D + E)] \).
Step 1: write the data.
A wetland holds \( N_t = 120 \) cormorants at the start of the breeding season.
During the season, \( B = 36 \) chicks hatch, \( D = 12 \) birds die, \( I = 8 \) birds immigrate and \( E = 5 \) emigrate.
- Step 1: compute the per-capita birth rate: \( \frac{B}{N_t} = \frac{36}{120} = 0.30 \) chicks per cormorant per season.
- Step 2: net individuals added \( = (B + I) – (D + E) = (36 + 8) – (12 + 5) = 44 – 17 = 27 \) birds.
\[ N_{t+1} = 120 + 27 = 147 \text{ cormorants} \]
Final answer: the wetland holds 147 cormorants at the next season, and the birth rate is 0.30 chicks per cormorant per season.
Example 2: Estimating r from a known doubling time
Method: use the integral exponential equation \( N_t = N_0 e^{rt} \) with the doubling condition \( N_t = 2N_0 \).
Step 1: a deer population in a fenced sanctuary doubles in 5 years.
At \( t = 5 \) years, \( N_t = 2N_0 \).
Substitute: \( 2N_0 = N_0 e^{5r} \).
- Step 1: cancel \( N_0 \) on both sides: \( 2 = e^{5r} \).
- Step 2: take natural logarithms: \( \ln 2 = 5r \).
- Step 3: \( r = \frac{\ln 2}{5} = \frac{0.6931}{5} \approx 0.139 \).
Final answer: \( r \approx 0.139 \) per year.
Mini-example (instantaneous rate): with \( N = 1000 \) and \( r = 0.02 \), \( \frac{dN}{dt} = 0.02 \times 1000 = 20 \) individuals per year. Why the doubling shortcut works: the doubling condition forces \( e^{rt} = 2 \), so \( rt = \ln 2 \), and since \( \ln 2 \approx 0.6931 \), every doubling problem reduces to one division: \( r = 0.6931 / t \).
Common Mistakes in Population Ecology — and the Correct Fix
| Students write X | Correct is Y | Why / how to check |
|---|---|---|
| Total births as the birth rate | Per-capita birth rate — births divided by initial population size. | Divide by N, state units (e.g. chicks per cormorant per season) so populations of different sizes are comparable. |
| Immigration and emigration swapped | Immigration = into the habitat (+); emigration = out of it (−). | “im” = in, “e” = exit — check the direction of movement. |
| Broad-based age pyramid = declining population | Broad base = many pre-reproductives = growing population. | Look at the bottom bar: many young individuals mean future growth. |
| Exponential and logistic curves belong to different species | They are the same population under unlimited vs limited resources. | Ask “is any resource limiting?” — no → exponential; yes → logistic. |
| The female mosquito is a parasite | It does not live on or inside the host and needs blood only to mature eggs. | Parasites feed on the host’s surface or live inside it; a mosquito is a brief visitor (p. 200). |
| Competition needs related species or limiting resources | Unrelated species compete (flamingoes vs fishes), and interference competition occurs even with abundant resources. | Recall the two chapter counter-examples whenever “competition” appears. |
| Predation and parasitism are the same | A predator usually kills its prey; a parasite usually keeps the host alive. | Ask “does the victim die?” — usually yes for predation, no for parasitism. |
| Ectoparasites and endoparasites confused | Ecto = outside (lice, ticks, Cuscuta); endo = inside (liver fluke, Plasmodium). | “Ecto” = external, “endo” = internal. |
| K in the logistic equation is the current population | K is the habitat’s carrying capacity — the maximum density it can support. | K is fixed by the habitat, not by N. |
| Population crashes when it reaches K | The growth rate \( dN/dt \) approaches zero as N approaches K; the curve levels off, it does not fall. | In \( rN(K-N)/K \), the factor \( (K-N)/K \to 0 \) as \( N \to K \). |
How to Write Complete Answers to the Chapter 11 Exercises
The ten exercises are on p. 204. These blueprints tell you what a complete answer must include — they are frameworks, not solved answers.
- Definition-based questions (Q1, Q6, Q7, Q10): open with the definition in your own words, then attach a textbook example. Q1 asks only for the group attributes — birth and death rates (per capita), sex ratio, age distribution. Q6 defines population (single species, defined area) separately from community (the interacting set of populations of different species in a habitat, p. 196). Q7’s five terms — commensalism, parasitism, camouflage, mutualism, interspecific competition — map directly to the Definitions table above (add the p. 198 statement that camouflage means cryptic colouration that hides an organism from predators). Q10: pick three attributes, define each and give one example.
- Q2 (quantitative): state that doubling means substituting \( N_t = 2N_0 \) into \( N_t = N_0 e^{rt} \), cancelling \( N_0 \), taking natural logs and using \( \ln 2 \approx 0.693 \) — the same steps as Example 2 above with t = 3 years.
- Q3 and Q5 (recall): Q3 needs both defence classes: morphological (thorns of Acacia and Cactus) and chemical (Calotropis cardiac glycosides; commercial alkaloids like nicotine, caffeine, quinine). Q5 ties the biological control principle to the predator’s ability to regulate prey populations.
- Q8 (diagram): the drawn logistic curve is mandatory, not optional. Reproduce the sigmoid shape of Figure 11.3 with axes labelled N (population density) vs t (time), show the lag, acceleration and deceleration phases, and mark the asymptote at K.
- Q9 (statement MCQ): eliminate options against Table 11.1’s sign convention — parasitism is the interaction in which one species benefits and the other is adversely affected, a \( +,- \) sign pair. Any option describing “both benefit” or “the other unaffected” contradicts that pair.
The same checklist structure applies to every chapter of the book — see, for instance, the notes for Biotechnology: Principles and Processes.
Rapid Revision: Chapter 11 on One Page
Table 1 — the six population interactions with signs:
| Interaction | Sign (A, B) | Meaning | Textbook example |
|---|---|---|---|
| Mutualism | (+, +) | Both species benefit | Fig and wasp; lichens |
| Competition | (−, −) | Both species lose | Balanus vs Chathamalus |
| Predation | (+, −) | Predator benefits; prey is killed | Sparrow eating a seed |
| Parasitism | (+, −) | Parasite benefits; host is harmed but usually survives | Koel in the crow’s nest |
| Commensalism | (+, 0) | One benefits; other unaffected | Barnacles on a whale |
| Amensalism | (−, 0) | One harmed; other unaffected | Defined in Table 11.1; no field example in the chapter |
Table 2 — exponential vs logistic growth:
| Feature | Exponential | Logistic |
|---|---|---|
| Curve shape | J-shaped | Sigmoid (S-shaped) |
| Resource assumption | Unlimited | Limiting sooner or later |
| Key symbols | r | r and K |
| Equation | \( \frac{dN}{dt} = rN \) | \( \frac{dN}{dt} = rN \left( \frac{K – N}{K} \right) \) |
| Realism | Idealised | Realistic (finite resources, p. 196) |
- Age pyramid: broad base = growing; nearly equal bars = stable; narrow base = declining.
- Four processes: natality and immigration increase density; mortality and emigration decrease it.
- Life history: one burst (salmon, bamboo) vs many broods (birds, mammals); many small vs few large offspring.
- Predation and plants: predators are energy conduits; plants defend with thorns and chemicals.
Frequently Asked Questions
Why is the female mosquito not considered a parasite even though it drinks blood?
Because it does not live on or inside the human body the way parasites do. The chapter’s parasites either feed on the host’s external surface (ectoparasites) or live inside its body (endoparasites), and they draw their nourishment from the host over a prolonged association.
A female mosquito is a short-term visitor — it takes a blood meal only to mature its eggs and then leaves, so it is not classed as a parasite (p. 200).
What is the difference between the J shaped and S shaped population growth curves?
The J-shaped curve is exponential growth — population density climbs without an upper limit because resources are treated as unlimited. The S-shaped (sigmoid) curve is logistic growth — it passes through lag, acceleration and deceleration phases and then levels off at the carrying capacity K because resources become limiting (pp. 194–195).
They are not different species: they describe the same population under unlimited versus limited resources.
Is competition always between closely related species?
No. The chapter gives two counter-examples: totally unrelated species can compete — flamingoes and resident fishes competing for zooplankton in shallow South American lakes — and competition can occur even when resources are abundant (interference competition). Competition is best defined as the significantly reduced fitness (lower r) of one species in the presence of another (pp. 198–199).
How is the tiger census done if tigers are never counted directly?
By indirect estimation. Because tigers are rarely seen, the census estimates population size from the pug marks and fecal pellets tigers leave behind in their territory, so relative densities can be tracked without direct counting (p. 192).
What is the carrying capacity K in the logistic growth equation?
K is the carrying capacity — the maximum number of individuals of a species that a habitat’s resources can support. In the logistic equation \( dN/dt = rN(K-N)/K \), the factor \( (K-N)/K \) shrinks as N approaches K, so the growth rate slows toward zero and the sigmoid curve levels off at K (pp. 194–195).
Reference: NCERT Class 12 Biology textbook, chapter Organisms and Populations.
Explore Class 12 Biology Notes
- Class 12 Biology Notes
- Class 12 CBSE Notes
- CBSE Notes for Classes 1 to 12
- Previous: Biotechnology : Principles and Processes
Class 12 Biology on LearnCBSE:
Related chapters:
- Sexual Reproduction in Flowering Plants notes
- Human Reproduction notes
- Reproductive Health notes