For the current academic session, these development class 10 notes break down the Economics chapter into a quick, exam-ready revision guide. You get definitions, comparison tables, a worked example, and exam pointers.
These notes cover the full chapter: developmental goals, per capita income, public facilities, the Human Development Index (HDI), and sustainability.
Understanding What Development Really Means
The idea of progress looks different to different people. A landless rural labourer wants more days of work, better wages, and a local school that gives children a decent education (NCERT, p. 3).
Contrast this with a prosperous Punjab farmer who seeks high support prices for crops and cheap labour, hoping to settle children abroad. The core rule: what helps one person may harm another.

Thus, conflicting goals exist. Building a dam may generate electricity for industrialists while submerging tribal land and disrupting lives. One group’s development becomes another’s ruin (NCERT, p. 4). You can explore more concepts on our main Class 10 Economics notes page.
Why People Seek More Than Just Income
Income buys material goods, but a good life also needs non-material things: equal treatment, freedom, security, and respect (NCERT, p. 4). Material goods alone cannot guarantee well-being.
Consider a job choice. A job far away may pay well but reduce family time and security. A lower-paying job nearby may offer stability and a better learning atmosphere. People look at a mix of goals.
Similarly, when women engage in paid work, their dignity at home rises. In turn, a safe environment encourages more women to work, linking respect and income in both directions (NCERT, p. 4).
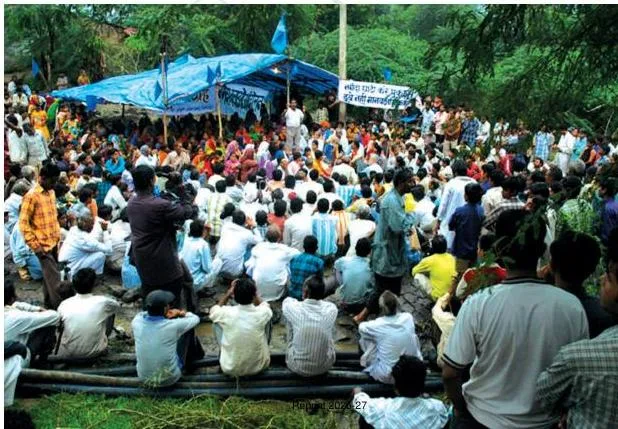
National Development: Conflicting Nation-Level Goals
National development has no single accepted definition. Different people hold different and conflicting notions of what a country should achieve (NCERT, p. 6).
A fair path requires checking whether an idea benefits a large section of the population or only a small group. For example, a multinational company dumped 500 tonnes of toxic waste in Abidjan, Ivory Coast, causing deaths and illness. The company profited, but residents suffered. True development cannot leave a community choking on waste (NCERT, p. 6).
Comparing Countries: Per Capita Income Method
For comparing countries, total income fails because countries have different populations (NCERT, p. 7). Instead, we use average income, or per capita income (PCI).
\[ PCI = \frac{Total\ Income\ of\ the\ Country}{Total\ Population} \]
The World Bank uses PCI to classify countries. For 2024, countries with PCI of US$ 66,500 or more are high-income, while those with US$ 2,300 or less are low-income. India is a low middle-income country at roughly US$ 11,000 per annum (NCERT, p. 7).
Average Income Calculation: Worked Example
- Step 1: Consider Country X with four citizens earning Rs 8,000, Rs 9,000, Rs 8,500, and Rs 8,500. Country Y has four citizens earning Rs 1,000, Rs 1,000, Rs 1,000, and Rs 31,000.
- Step 2: Calculate total income for Country X.
\[ Total\ Income_X = 8000 + 9000 + 8500 + 8500 = Rs\ 34,000 \]
Step 3: Calculate total income for Country Y.
\[ Total\ Income_Y = 1000 + 1000 + 1000 + 31000 = Rs\ 34,000 \]
Step 4: Divide by population (4) for each country.
\[ PCI_X = \frac{34000}{4} = Rs\ 8,500 \]
\[ PCI_Y = \frac{34000}{4} = Rs\ 8,500 \]
Final answer: Both have an identical average of Rs 8,500, but Country Y has extreme disparity—one person is rich while the rest are poor. Averages hide disparities (NCERT, p. 8).
Limitations of Average Income: Haryana vs Kerala vs Bihar
Per capita income alone does not capture real well-being. The three-state comparison from Tables 1.3 and 1.4 proves this (NCERT, p. 9-10).
| State | Per Capita Income (Rs) | Infant Mortality Rate | Literacy Rate % | Net Attendance Ratio % |
|---|---|---|---|---|
| Haryana | 3,25,759 | 28 | 82 | 73 |
| Kerala | 2,81,001 | 6 | 94 | 94 |
| Bihar | 60,337 | 27 | 62 | 69 |
Haryana has the highest PCI, yet Kerala has far better social outcomes—Kerala’s IMR is 6, compared to Haryana’s 28. The reason? Public facilities matter. To see how these concepts link, you can check our broader Class 10 notes hub.

Key Development Indicators and Their Meanings
| Term | Meaning | Example / Use |
|---|---|---|
| Per Capita Income | Total income of a country divided by its total population. | Used by World Bank to compare nations. |
| Infant Mortality Rate (IMR) | Deaths of children under one year per 1,000 live births. | Indicates healthcare quality. |
| Literacy Rate | Proportion of literate population aged 7 and above. | Measures educational attainment. |
| Net Attendance Ratio | Children aged 15–17 attending school as a percentage of total children in that age group. | Tracks school participation. |
| Life Expectancy at birth | Average expected length of life of a person at birth. | Key health indicator in HDI. |
| Gross Enrolment Ratio | Total enrolment at a specific level of education, regardless of age, as a percentage of the official school-age population. | Shows educational access. |
| Body Mass Index (BMI) | Weight in kg divided by the square of height in metres. | Identifies undernutrition or obesity. |
| Human Development Index (HDI) | A composite index measuring income, health, and education. | Published by UNDP. |
| Purchasing Power Parity (PPP) | An exchange rate allowing a dollar to buy the same amount of goods in any country. | Used for fair income comparison. |
Public Facilities: Why Money Alone Cannot Buy Well-being
Money in your pocket cannot buy a pollution-free environment or unadulterated medicines (NCERT, p. 10). It also cannot protect you from infectious diseases unless the whole community is safe.
Collective provision of goods and services—like public schools, health centres, and the Public Distribution System (PDS)—is the cheapest and most effective way to provide for everyone. Kerala’s low IMR exists because it has adequate basic health and educational facilities (NCERT, p. 11).
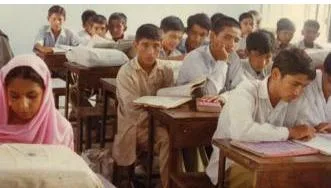
Human Development Index: A Broader Measure
Realising income is an inadequate measure, the UNDP publishes the Human Development Report. It compares countries based on educational levels, health status (life expectancy), and per capita income (NCERT, p. 12). HDI ranks are out of 193 countries. The UNDP provides the official data for this index.
| Country | GNI Per Capita (PPP $) | Life Expectancy | Mean Years of Schooling | HDI Rank |
|---|---|---|---|---|
| Sri Lanka | 12,616 | 77.5 | 10.8 | 89 |
| India | 9,047 | 72 | 6.9 | 130 |
| Bangladesh | 8,498 | 74.7 | 6.8 | 130 |
| Pakistan | 5,501 | 67.6 | 4.3 | 168 |
| Nepal | 4,726 | 70.4 | 4.5 | 145 |
| Myanmar | 4,919 | 66.9 | 6.4 | 150 |
Notice that Sri Lanka, a smaller neighbour, outranks India. Nepal and Bangladesh have lower PCI than India but higher life expectancy. The UNDP website offers the full global data.
Sustainability of Development: Renewable vs Non-Renewable Resources
Sustainability means maintaining development for future generations. The chapter quotes: “We have not inherited the world from our forefathers — we have borrowed it from our children.” (NCERT, p. 13). Our current development patterns risk exhausting resources.
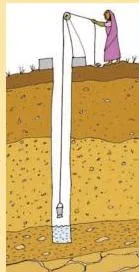
Renewable resources are replenished by nature, like groundwater and crops. However, they can be overused. If we pump out more water than rain replenishes, the resource depletes (NCERT, p. 13-14). Groundwater overuse is reported in 300 districts with a 4-metre decline in 20 years; nearly one-third of the country is overusing reserves.
Non-renewable resources have a fixed stock that cannot be replenished. Crude oil is a prime example.
| Region/Country | Reserves (Thousand Million Barrels) | Years Reserves Will Last |
|---|---|---|
| Middle East | 836 | 70 |
| USA | 69 | 10.5 |
| World | 1732 | 47 |
At the current extraction rate, world crude oil reserves will last only about 47 years. This forces us to ask hard questions about sustainable energy. For further reading, check our notes on Sectors of the Indian Economy.
Common Mistakes Students Make in This Chapter
| Mistake | Correct Rule | How to Check |
|---|---|---|
| Treating per capita income as total income. | PCI is total income divided by population; it helps compare average earnings across different populations (NCERT, p. 7). | Always divide the total by the number of people. |
| Saying high PCI always means better development. | Kerala has lower PCI than Haryana but better IMR and literacy; income is inadequate alone (NCERT, p. 9-10). | Cross-check health and education indicators. |
| Calling groundwater a non-renewable resource. | Groundwater is renewable but can be overused if extraction exceeds natural replenishment (NCERT, p. 13). | Check if the resource can be naturally replaced. |
| Confusing HDI with World Bank classification. | The World Bank uses only PCI; UNDP’s HDI adds health and education (NCERT, p. 7, p. 12). | Count the indicators used by each body. |
Exam Notes: How CBSE Frames Development Questions
- Earn the mark for goal differences: “Why do different persons have different developmental goals?” is a recurring 3-marker. Cite two contrasting categories from Table 1.1 (like a labourer vs a prosperous farmer) to score full marks (NCERT, p. 3).
- Show your division steps: For average-income numericals, write the formula, show the sum, and divide by the population. State units (Rs) at every step to earn the working mark (NCERT, p. 8).
- Structure the five-marker: For “Kerala vs Haryana” or “why PCI is not complete,” contrast the IMR and literacy data from Tables 1.3 and 1.4, then link Kerala’s success to public facilities (NCERT, p. 9-11).
- Sustainability application: State the renewable vs non-renewable distinction with one example each to earn the definition mark. Add groundwater overuse or crude oil data to earn the application mark (NCERT, p. 13-14).
Quick Revision Recap of Development
- Different people have different developmental goals based on their life situations.
- Goals can conflict (dams for electricity vs displaced tribals).
- Per Capita Income = Total Income ÷ Total Population.
- World Bank classes countries by PCI: high income (US$ 66,500+), low income (US$ 2,300 or less).
- Averages hide disparities; an equal average can hide a massive rich-poor gap.
- Haryana has higher PCI, but Kerala has better IMR and literacy due to public facilities.
- Money cannot buy collective goods; public facilities are the cheapest way to well-being.
- HDI = Income + Health (life expectancy) + Education (schooling).
- India’s HDI rank is 130 out of 193 countries.
- Sustainability means not overusing renewable or exhausting non-renewable resources.
Frequently Asked Questions About Development Chapter
Why do different persons have different developmental goals?
People seek things that fulfil their specific desires. A landless labourer wants more work days and better wages, while a prosperous farmer wants higher support prices. Since each person’s situation is different, their vision of progress differs, leading to different developmental goals.
How is per capita income calculated and why is it used instead of total income?
Per capita income is calculated by dividing a country’s total income by its total population. It is used because total income does not account for population size. Per capita income reveals what an average person is likely to earn, making it a fairer basis for comparing countries.
Why is Kerala ahead of Haryana in development despite lower per capita income?
Kerala has better social indicators: a lower Infant Mortality Rate (6 vs 28) and higher literacy (94% vs 82%). This happens because Kerala provides better collective public facilities, like basic health and educational centres, which money alone cannot buy.
How is the Human Development Index different from the World Bank’s classification?
The World Bank classifies countries using only per capita income. The Human Development Index (HDI) is a broader measure used by the UNDP that combines per capita income with health (life expectancy) and education (mean years of schooling), giving a fuller picture of development.
Why is the sustainability of development important?
Sustainability ensures that present development does not exhaust resources needed by future generations. Overusing renewable resources like groundwater or depleting non-renewable ones like crude oil makes current development patterns unsustainable.
Reference: NCERT Class 10 Economics textbook, chapter Development.
Explore Class 10 Economics Notes
Related chapters:
Official source: download the NCERT textbook free from ncert.nic.in.