
National Income Accounting Class 12 is the second chapter of NCERT’s Introductory Macroeconomics, running across 27 printed pages. It gives you the toolkit the whole macro course runs on: the circular flow of income, the three methods of measuring national income, the aggregates from GDP to Personal Disposable Income, the price indices, and the GDP-versus-welfare question.
The official chapter PDF is just below, and the rest of this page explains what the chapter actually contains.
NCERT publishes every textbook chapter free on its official website: the National Income Accounting Class 12 — NCERT Introductory Macroeconomics Chapter 2 PDF comes straight from ncert.nic.in, so the page numbers, tables and exercises match the book exactly.
| What the chapter holds | Count | Where it is used |
|---|---|---|
| Printed pages | 27 | |
| Sections in the chapter | 9 | |
| Figures with NCERT captions | 8 | |
| Tables | 9 | |
| Exercise questions | 12 | answered in our NCERT Solutions |
| Official NCERT PDF | Download the chapter PDF | the chapter exactly as NCERT publishes it |
Chapter 2 at a Glance: What the Chapter Holds
Chapter 2 builds the vocabulary and arithmetic the rest of macroeconomics leans on. It starts with final goods, stocks and flows, and gross and net investment — the concepts every measurement method depends on.
It then develops the circular flow of income, the three methods of calculating national income, the price layers between factor cost, basic prices and market prices, the aggregate ladder from GDP to Personal Disposable Income, the price indices, and the question of whether GDP measures welfare.
How much of each the chapter holds — sections, figures, worked examples and exercise questions — is listed in the table on this page, so you can see the size of the file at a glance. The map below shows where each idea lives.
- 2.1 Some Basic Concepts of Macroeconomics (NCERT p. 1–5) — final goods, consumption goods, capital goods, consumer durables, intermediate goods, stocks and flows, gross investment, depreciation and net investment.
- 2.2 Circular Flow of Income and Methods of Calculating National Income (NCERT p. 6–16) — the simple economy, the circular flow, and the three methods, with sub-parts:
- 2.2.1 The Product or Value Added Method (p. 9)
- 2.2.2 Expenditure Method (p. 13)
- 2.2.3 Income Method (p. 14)
- 2.2.4 Factor Cost, Basic Prices and Market Prices (p. 16)
- 2.3 Some Macroeconomic Identities (NCERT p. 17–20) — the aggregates and Table 2.4.
- 2.4 Nominal and Real GDP (NCERT p. 21) — the deflator, CPI and WPI.
- 2.5 GDP and Welfare (NCERT p. 22) — distribution, non-monetary exchange, externalities.
The chapter closes with a Summary and Key Concepts list (p. 32), the exercise set (p. 33), and two tables of Indian data drawn from the RBI Annual Report (p. 34–35).
What This Chapter Covers, Section by Section
Use this as a map for a first read — find the part you are stuck on and jump straight to it.
Section 2.1 — The Basic Concepts
Everything in the chapter rests on the use-basis test: a good is final by the economic nature of its use, not by its nature. The same tea leaves are a final good brewed at home, and an intermediate input when a restaurant buys them (NCERT, p. 2).
The section then divides final goods into consumption goods, consumer durables and capital goods, and sets up the stock-versus-flow distinction with gross investment, depreciation and net investment (p. 1–5).
Section 2.2 — The Circular Flow and the Three Methods
This is the heart of the chapter. It builds a simple economy — no government, no foreign trade, no saving — in which households earn four factor payments (wage, interest, profit, rent) and spend everything, so income moves in a circle (p. 6).
The same circular flow is then measured at three points, one method per point: the product or value added method (p. 9), the expenditure method (p. 13) and the income method (p. 14). The section ends with the three price bases — factor cost, basic prices and market prices — and India’s January 2015 switch to GVA at basic prices (p. 16).
Section 2.3 — The Macroeconomic Identities
Section 2.3 walks the chain of aggregates: GNP is GDP plus net factor income from abroad; NNP subtracts depreciation; National Income removes net indirect taxes; and Personal Income and Personal Disposable Income bring income down to what households actually receive (p. 17–18).
National Disposable Income and Private Income are two further aggregates used in Indian accounting (p. 18). Table 2.4 collects the whole set (p. 27–28).
Section 2.4 — Nominal and Real GDP
This section explains why GDP comparisons need constant prices. Nominal GDP values output at current prices; real GDP values it at base-year prices, and the ratio of the two is the GDP deflator (p. 21).
It then introduces the Consumer Price Index and the Wholesale Price Index, and the three reasons CPI and the deflator can move differently (p. 29–30).
Section 2.5 — GDP and Welfare
The closing section asks whether a higher GDP means higher welfare. It gives three reasons it may not: the distribution of income, non-monetary exchange, and externalities (p. 22–23).
The chapter’s verdict: GDP is not a dependable index of welfare (p. 23).
Key Concepts: The Ideas That Run Through the Chapter
These are the ideas the chapter builds on, with the NCERT page beside each one. Each subsection opens with the plain meaning, then the detail.
Final, Intermediate and Capital Goods: The Use-Basis Test
National income counts only final goods, so the first skill this chapter teaches is telling a final good from an intermediate one. The test is the use, not the object itself.
A good is final when it will not pass through any more stages of production or transformation; it has passed out of the active economic flow (NCERT, p. 2). The test is use, not nature: tea leaves bought by a household are final, even though cooking transforms them, because cooking at home is not an economic activity.
The same tea leaves bought by a restaurant are an intermediate input (p. 2).
Of the final goods, the chapter distinguishes three kinds:
- Consumption goods — food, clothing, recreation services; consumed when purchased by the ultimate consumer (NCERT, p. 2).
- Consumer durables — television sets, cars, home computers; bought for ultimate consumption but long-lived like capital goods (p. 3).
- Capital goods — tools, implements, machines; they enable production without being transformed themselves, and form part of the economy’s capital stock (p. 3).
Intermediate goods are inputs for further production — steel sheets for automobiles, copper for utensils (p. 3). They must be excluded from GDP because their value is already inside the final good; counting them separately is the error of double counting (p. 3).
Stocks, Flows, Gross Investment and Depreciation
“Average salary is Rs 10,000” means nothing until someone says per month or per year — that is the stock-versus-flow point. Income, output and profit make sense only when a time period is specified; they are flows.
Flows are defined over a period of time — annual profits, monthly salary, water entering a tank per minute (NCERT, p. 11). Stocks are defined at a particular point of time — the water in the tank right now, the machines in a factory today. A change in stock, such as machines added this year, is itself a flow (p. 4–5).

The banner compresses the whole idea into one line — read “over a period of time” as the test that separates a flow from a stock in every numerical problem.
Now the investment chain. The part of final output made of capital goods is the economy’s gross investment (p. 12). But part of this year’s capital goods only replaces worn-out machines; that replacement value is depreciation, an annual allowance for wear and tear, roughly the cost of a capital good divided by its useful life (p. 12).
\[ \text{Net Investment} = \text{Gross Investment} – \text{Depreciation} \quad \text{(NCERT, p. 12)} \]
Two warnings from the book. First, depreciation is an accounting concept — no cash may change hands each year, yet the charge is made annually (p. 12–13). Second, “investment” here always means capital formation: buying shares or property is not investment in this chapter (p. 12, footnote).
There is also a timing trade-off: producing more capital goods this year means fewer consumer goods now, but more capital equipment raises what the same labour can produce later (p. 13–14).
The Circular Flow, and Why Three Methods Must Agree
Firms pay households for their services, and households spend that income on the firms’ output — the same money goes round in a circle. That is why the chapter can measure the year’s income at three different points and get one number.
The chapter’s model is a simple economy: no government, no foreign trade, no saving (NCERT, p. 6). Households receive exactly four kinds of factor payment — wage for labour, interest for capital, profit for entrepreneurship, rent for land — and spend everything on domestic goods, so every rupee the firms pay out comes back as sales revenue (p. 6).
The flows meet in two markets, drawn in Figure 2.1 (NCERT, p. 15): the top pair of arrows is the goods market, the bottom pair the factor market. The dotted measurement points A, B and C are exactly the expenditure, product and income methods (p. 7). The arrow-by-arrow reading is in the Figure Walkthrough below.

The circular flow produces a famous paradox: an economy can decide to spend beyond its current income, and because the extra spending reaches firms, production and factor payments rise until income matches the higher spending (p. 7). Adding saving and a government changes the details but does not break the equality of the three methods (p. 8).
The simple-economy model is also worked through step by step in our Class 12 Economics notes on a simple economy.
Value Added: The Product Method in Steps
Add up every firm’s sale value and the same wheat gets counted several times. Value added gives each producer credit only for what that producer actually contributed.
Here is the book’s own wheat-baker example (NCERT, p. 9): farmers produce Rs 100 of wheat; bakers buy Rs 50 of it and turn it into Rs 200 of bread. Adding the two sale values gives Rs 300, which double-counts the wheat. The farmers’ contribution is their full Rs 100; the bakers’ contribution is only the bread value minus the wheat used, Rs 200 − Rs 50 = Rs 150.
Correct GDP: Rs 100 + Rs 150 = Rs 250 (p. 9).
The rule: value added of a firm = value of production − intermediate goods used (p. 10). Value added is a flow, and it is exactly what the firm distributes among labour, capital, entrepreneurship and land — wages, interest, profits and rents must add up to it (p. 10).
Gross versus net value added. Gross value added includes depreciation (consumption of fixed capital); net value added subtracts it (p. 10). Fresh numbers: a furniture maker produces Rs 400 of furniture using Rs 150 of wood, and its machines depreciate by Rs 30 a year.
\[ \text{GVA} = 400 – 150 = 250 \]
\[ \text{NVA} = 400 – 150 – 30 = 220 \]
The inventory twist. A firm may not sell everything it produces. The stock of unsold finished goods, semi-finished goods or raw materials is inventory (p. 11), and \[ \text{change in inventories} = \text{production} – \text{sales} \]
Change in inventories is a flow and counts as investment, because unsold output is capital the firm carries forward (p. 11–12). The change may be planned — the firm deliberately builds stock — or unplanned, when sales fall short of expectations (p. 11–12).
So gross value added of firm i equals sales + change in inventories − intermediate goods (equation 2.1, p. 20), and summing over all firms gives \[ \text{GDP} \equiv \sum_{i=1}^{N} GVA_i \quad \text{(equation 2.2, NCERT, p. 20)} \]
Expenditure and Income Methods, and the Identity That Binds Them
The same GDP can be counted from what buyers spent and from what earners received. The chapter writes both in symbols, then shows they are one number.
Expenditure method. Only final expenditures count. Firm i receives final consumption expenditure (mostly by households), final investment expenditure, government expenditure, and export revenue (NCERT, p. 13). Summing over all firms and removing imported parts gives \[ \text{GDP} \equiv C + I + G + X – M \quad \text{(equation 2.4, NCERT, p. 22)} \]
where C is consumption, I investment, G government spending, X exports and M imports. The chapter notes that investment I is the most unstable of the five (p. 13).
Income method. The revenues firms earn must be distributed to factors as wages, profits, interest and rents:
\[ \text{GDP} \equiv W + P + In + R \quad \text{(equation 2.5, NCERT, p. 22)} \]
Bring the three methods together as the grand identity, which Figure 2.2 pictures (p. 23):
\[ \text{GDP} = \sum_{i=1}^{N} GVA_i = C + I + G + X – M = W + P + In + R \quad \text{(identity 2.6, NCERT, p. 23)} \]
Worked example — the same GDP by all three methods. Take a three-stage chain: a farm, a mill and a bakery.
Step 1 (the chain): The farm produces Rs 600 of wheat using no purchased inputs, sells Rs 250 of it to the mill and Rs 350 directly to households.
The mill turns its Rs 250 of wheat into Rs 500 of flour, sold entirely to the bakery.
The bakery turns the Rs 500 of flour into Rs 950 of bread, sold entirely to households.
Step 2 (product method): value added = production − intermediate goods for each firm.
\[ \text{Farm: } 600 – 0 = 600 \]
\[ \text{Mill: } 500 – 250 = 250 \]
\[ \text{Bakery: } 950 – 500 = 450 \]
\[ \text{GDP} = 600 + 250 + 450 = \text{Rs } 1{,}300 \]
| Firm | Production | Intermediate goods | Value added |
|---|---|---|---|
| Farm | 600 | 0 | 600 |
| Mill | 500 | 250 | 250 |
| Bakery | 950 | 500 | 450 |
| Total | — | — | 1,300 |
Step 3 (expenditure method): only final purchases count.
Households buy Rs 350 of wheat and Rs 950 of bread; the mill’s wheat and the bakery’s flour are intermediate, so they are left out.
\[ \text{GDP} = 350 + 950 = \text{Rs } 1{,}300 \]
Step 4 (income method): split each firm’s value added into wages and profits — farm 250 + 350, mill 100 + 150, bakery 200 + 250.
\[ \text{Wages} = 250 + 100 + 200 = 550 \]
\[ \text{Profits} = 350 + 150 + 250 = 750 \]
\[ \text{GDP} = 550 + 750 = \text{Rs } 1{,}300 \]
Final answer: all three methods give Rs 1,300. Each method catches the same circular flow at a different point — production, spending, income — which is identity 2.6 in action.
Factor Cost, Basic Prices and Market Prices
The same goods can be valued at three price bases, and Indian news headlines changed which one they report in January 2015. The difference lies in which taxes are included.
The chapter distinguishes production taxes and subsidies, paid or received in relation to production regardless of volume (land revenues, stamp and registration fees), from product taxes and subsidies, paid per unit of output (excise, service tax, export and import duties) (NCERT, p. 16).
\[ \text{GVA at factor cost} + \text{net production taxes} = \text{GVA at basic prices} \]
\[ \text{GVA at basic prices} + \text{net product taxes} = \text{GVA at market prices} \;(= \text{GDP}) \]
In its January 2015 revision, the CSO replaced GDP at factor cost with GVA at basic prices as the headline measure, and GDP at market prices is now simply called GDP (p. 16).
The chapter grounds this in Indian data: Table 2.5 gives GVA at basic prices and GDP at 2026-27 prices, and Table 2.6 breaks GDP into its expenditure components, both sourced from the RBI Annual Report (p. 34–35).
From GDP to Personal Disposable Income: The Aggregate Ladder
GDP is not the only aggregate. Numerical problems ask you to walk down a ladder of aggregates, adding or subtracting exactly one thing at each step.
Why GNP first? Gross National Product adds to GDP the factor income earned by a country’s own factors abroad and subtracts the factor income foreign factors earn inside the country — the net factor income from abroad, NFIA (NCERT, p. 17). A Korean-owned car factory earns Indian GDP; its profits are subtracted when moving to Indian GNP (p. 17).
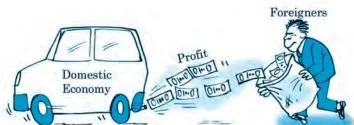
Three words in the banner do the work: aggregate (the sum over all firms), final (intermediate goods are already inside), and within the domestic economy (which is why adding NFIA turns GDP into GNP).
| Step | Aggregate | How you get there | NCERT page |
|---|---|---|---|
| 1 | GNP at market prices | GDP + Net Factor Income from Abroad (NFIA) | p. 17 |
| 2 | NNP at market prices | GNP − Depreciation | p. 25 |
| 3 | National Income (NNP at factor cost) | NNP at market prices − Net indirect taxes | p. 25 |
| 4 | Personal Income | NI − Undistributed profits − Corporate tax − Net interest paid by households + Transfers | p. 18 |
| 5 | Personal Disposable Income | PI − Personal tax payments − Non-tax payments | p. 18 |
Two more aggregates appear in Indian accounting: National Disposable Income is NNP at market prices plus other current transfers from the rest of the world (gifts, aid), and Private Income adds national debt interest, current transfers from government and net transfers from abroad to the private sector’s factor income (p. 18). Table 2.4 collects every aggregate with its formula (p. 27–28).
Real GDP, Nominal GDP, the Deflator and the Price Indices
If every price doubles, GDP doubles even though nothing more was produced — so comparing GDP across years needs constant prices.
Nominal GDP is the value of GDP at current prevailing prices; real GDP values the same goods at constant base-year prices (NCERT, p. 21). The ratio of the two is the GDP deflator (p. 29):
\[ \text{GDP deflator} = \frac{\text{Nominal GDP}}{\text{Real GDP}} \quad \text{(sometimes expressed } \times 100) \]
Worked example — real GDP, the deflator and the CPI. An economy produces only sugar and shirts. The base year is 2023.
Step 1 (nominal GDP, base year 2023): sugar 500 kg × Rs 40 = Rs 20,000; shirts 100 × Rs 200 = Rs 20,000.
Nominal GDP = Rs 40,000.
Step 2 (nominal GDP, current year 2025): sugar 520 kg × Rs 60 = Rs 31,200; shirts 115 × Rs 220 = Rs 25,300.
Nominal GDP = Rs 56,500.
Step 3 (real GDP at 2023 prices):
\[ \text{Real GDP} = (520 \times 40) + (115 \times 200) = 20{,}800 + 23{,}000 = \text{Rs } 43{,}800 \]
Step 4 (deflator):
\[ \text{GDP deflator} = \frac{56{,}500}{43{,}800} \approx 1.29 \; (= 129\%) \]
Step 5 (CPI): a representative consumer buys 100 kg of sugar and 10 shirts a year.
Cost of the basket in 2023 = 100 × 40 + 10 × 200 = Rs 6,000.
Cost in 2025 = 100 × 60 + 10 × 220 = Rs 8,200.
\[ \text{CPI} = \frac{8{,}200}{6{,}000} \times 100 = 136.7 \]
Final answer: real GDP is Rs 43,800; the deflator is 1.29 (129%), so the average price of output rose 29%; the CPI is 136.7, so consumer prices rose 36.7%. The gap appears because sugar’s price rose faster than shirts’, and the fixed CPI basket gives sugar a larger weight than sugar has in production — the constant-weights difference at work.

The banner marks the shift in the chapter: the deflator is a ratio of two GDPs, while the CPI is built from a fixed basket of consumer goods. The CPI and the deflator differ for three reasons (p. 29–30):
- Coverage: the CPI covers only goods a representative consumer buys; the deflator covers all goods and services produced.
- Imports: the CPI includes prices of imported consumer goods; the deflator does not, because imports are not domestic output.
- Weights: CPI weights are constant (the basket is fixed); deflator weights shift with the actual production level of each good.
The chapter also names the Wholesale Price Index (WPI), called the Producer Price Index (PPI) in the US, and notes that a GNP deflator can be defined just like the GDP deflator (p. 29).
GDP and Welfare: The Three Failures
More income usually means more well-being for a person. At the level of a whole country, the link breaks — and the chapter gives three reasons why.
1. Distribution. GDP can rise while most people get poorer. New numbers in the same spirit as the book’s example: an imaginary country has 80 people earning Rs 5,000 each, so GDP is Rs 4,00,000.
Next year, 70 people earn Rs 4,000 and 10 earn Rs 15,000 — GDP is now Rs 4,30,000, higher by Rs 30,000, yet 70 of the 80 people are worse off (their income fell from Rs 5,000 to Rs 4,000) (NCERT, p. 22).
2. Non-monetary exchange. Unpaid domestic work and barter exchanges never enter GDP because no money changes hands. In developing economies, where such activity is large, GDP is understated (p. 22).
3. Externalities. An oil refinery adds its value added to GDP while polluting a river — the harm to fishermen and river users is real but unpaid, so it is not subtracted. Negative externalities make GDP overestimate welfare; positive externalities make it underestimate welfare (p. 22–23).
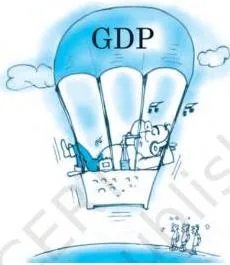
The banner defines the idea; the refinery case shows why GDP and welfare diverge. The chapter’s conclusion follows directly: GDP is not a dependable index of welfare (p. 23).
Figure Walkthrough: Reading the Chapter’s Diagrams
Each diagram is the chapter’s argument in compressed form. If you can redraw one, you have revised that idea.
Figure 2.1 — Circular Flow of Income in a Simple Economy
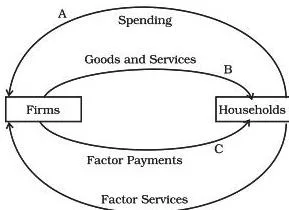
What it shows: two boxes — households and firms — joined by four arrows. The top pair is the goods market: household spending going to firms, and goods and services flowing back. The bottom pair is the factor market: household services going to firms, and factor payments flowing back (NCERT, p. 15).
How to trace it: start at households, follow the money up to firms as spending, then down as factor payments — the same rupee goes round. The dotted points A, B and C sit on the spending flow, the output flow and the factor-payment flow respectively.
The idea it proves: A, B and C are the expenditure, product and income methods. Because the flow is circular, measuring it at any point gives the same annual value — the picture behind identity 2.6 (p. 15).
How to redraw it: draw two boxes, four arrows (two above, two below), label the top pair “goods market” and the bottom pair “factor market”, then mark the three dotted points A, B, C.
Figure 2.2 — Diagramic Representation of GDP by the Three Methods
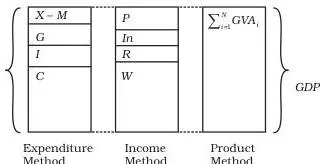
What it shows: one circle labelled GDP, with three arms attached — the sum of gross value added, \( C + I + G + X – M \), and \( W + P + In + R \) (NCERT, p. 23).
How to trace it: start at any arm and move to the centre; the centre value is the same. Pair it with the worked example above — all three arms gave Rs 1,300.
The idea it proves: the three expressions are identities, different ways of writing one variable. Each arm is one phase: production, disposition (spending), distribution (income) (p. 23).
How to redraw it: draw a circle, write GDP at the centre, and attach the three expressions with equals signs — and write identity 2.6 underneath.
Figure 2.3 — The Subcategories of Aggregate Income
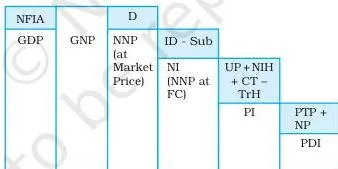
This figure is a cheat-sheet for the numerical chain in the exercises (Q7–Q10). Its caption abbreviations decode as follows (NCERT, p. 26):
| Code | Full form | Direction in the chain |
|---|---|---|
| NFIA | Net Factor Income from Abroad | added when going GDP → GNP |
| D | Depreciation | subtracted when going GNP → NNP |
| ID | Indirect Taxes | subtracted when going NNP at market prices → NI |
| Sub | Subsidies | added back (net indirect taxes = ID − Sub) |
| UP | Undistributed Profits | subtracted when going NI → PI |
| NIH | Net Interest Payments by Households | subtracted when going NI → PI |
| CT | Corporate Taxes | subtracted when going NI → PI |
| TrH | Transfers received by Households | added when going NI → PI |
| PTP | Personal Tax Payments | subtracted when going PI → PDI |
| NP | Non-Tax Payments | subtracted when going PI → PDI |
How to redraw it: write GDP at the top, then GNP (add NFIA), NNP (subtract D), NI (subtract ID, add Sub), PI (subtract UP, NIH, CT; add TrH), PDI (subtract PTP, NP) — the ladder you also met as a table in Key Concepts.
Definitions: The Terms You Must Know, With Page Numbers
These are the terms the book gathers under Key Concepts on p. 32 — the ones numerical problems make you move between. The one-line meanings below are written the way each term is used in a problem.
| Term | One-line meaning | NCERT page |
|---|---|---|
| Final goods | Goods meant for final use that will not pass through any more stages of production or transformation | p. 2 |
| Intermediate goods | Goods used as raw material or inputs in producing other goods, e.g. steel sheets for cars | p. 3 |
| Consumption goods | Goods and services consumed when purchased by the ultimate consumer, e.g. food, clothing | p. 2 |
| Capital goods | Durable goods used in production that enable output without being transformed, e.g. machines | p. 3 |
| Consumer durables | Durable goods bought for ultimate consumption, e.g. televisions, cars, home computers | p. 3 |
| Stock | A variable defined at a particular point of time, e.g. water in the tank right now | p. 4–5 |
| Flow | A variable defined over a period of time, e.g. water entering the tank per minute | p. 4–5 |
| Gross investment | The part of final output consisting of capital goods, including replacement of worn-out capital | p. 4/12 |
| Net investment | Gross investment minus depreciation; the new addition to capital stock | p. 4/12 |
| Depreciation | Annual allowance for wear and tear of capital; cost of a capital good divided by its useful life | p. 4/12 |
| Value added | Value of production minus the value of intermediate goods used | p. 10 |
| Inventories | Stock of unsold finished goods, semi-finished goods or raw materials carried from one year to the next | p. 11 |
| GDP | The sum total of gross value added of all firms in the domestic economy in a year | p. 12/20 |
| GNP | GDP plus net factor income from abroad | p. 17 |
| NFIA | What our factors earn abroad minus what foreign factors earn here | p. 17 |
| NNP at market prices | GNP minus depreciation | p. 17/25 |
| National Income | NNP at factor cost: NNP at market prices minus net indirect taxes | p. 17/25 |
| Personal Income | Income accruing to households — NI minus undistributed profits, corporate tax and net household interest, plus transfers | p. 18 |
| Personal Disposable Income | PI minus personal tax payments and non-tax payments | p. 18 |
| National Disposable Income | NNP at market prices plus other current transfers from the rest of the world | p. 18 |
| Private Income | Private sector’s factor income from NDP plus national debt interest, NFIA, current transfers from government and other net transfers from abroad | p. 18 |
| Nominal GDP | GDP valued at current prevailing prices | p. 21 |
| Real GDP | GDP valued at constant base-year prices | p. 21 |
| Base year | The year whose prices are used to compute real GDP | p. 21/29 |
| GDP deflator | Ratio of nominal GDP to real GDP; an index of the price level | p. 29 |
| CPI | Index of the prices of a fixed basket of goods bought by a representative consumer | p. 21/29 |
| WPI | Index of wholesale prices of goods traded in bulk; called PPI in the US | p. 29 |
| Externalities | Benefits or harms a firm or individual causes to another for which they are not paid or penalised | p. 22–23 |
Common Mistakes Students Make in This Chapter
The errors in this chapter are definition slips rather than arithmetic slips — fix the definition and the number fixes itself.
| The mistake | Why it happens | The correction |
|---|---|---|
| Intermediate goods added into GDP | Totalling every producer’s sales feels like “more output” | Count only final goods; use value added so each stage’s contribution is counted once (p. 3/10) |
| Calling a good final by its nature | The object itself looks finished | Apply the use test: the same tea leaves are final at home, intermediate in a restaurant (p. 2) |
| Quoting income or output without a time period | The context makes the period seem obvious | State the period — a flow only has meaning over a period (p. 4) |
| Calling the purchase of shares or property investment | Everyday usage of the word | In this chapter investment means capital formation — a gross or net addition to capital stock (p. 12) |
| Using GDP and GNP interchangeably | Both claim to be “the country’s income” | GNP = GDP + NFIA; a foreign-owned factory is in India’s GDP but not in India’s GNP (p. 17) |
| Skipping depreciation when moving gross → net | Net feels like the same number with a new label | Always subtract depreciation: NNP = GNP − Dep; net investment = gross investment − depreciation (p. 12/25) |
| Mixing factor cost, basic prices and market prices | All three are “prices” | Production taxes separate factor cost from basic prices; product taxes separate basic prices from market prices (p. 16) |
| Treating the GDP deflator and CPI as the same index | Both measure price change | They differ in coverage, imports and weights (p. 21/29) |
| Sign error on a negative budget deficit | A deficit “with a minus sign” reads as no deficit | A negative deficit is a surplus: enter it as −1,500 in \((I – S) + (G – T) = M – X\), which reduces the trade deficit (Q6) |
What the Chapter’s Exercises Actually Test
The chapter’s twelve exercises open on factor definitions and close on GDP’s limitations, with the numerical chain in between. Use the map below to practise the exact move each question demands.
| Q# | The skill it practises | Section it draws from | Answer to check |
|---|---|---|---|
| 1 | The four factors of production and their remunerations | 2.1/2.2 (p. 6) | — |
| 2 | Why aggregate final expenditure equals aggregate factor payments | Circular flow (p. 6–8) | — |
| 3 | Stock vs flow; net investment vs capital, with the water-tank comparison | 2.1 (p. 4–5) | — |
| 4 | Planned vs unplanned inventory change; the inventory–value added relation | 2.2.1 (p. 11–12) | — |
| 5 | The three GDP identities and why they agree | 2.2 (p. 20–23) | — |
| 6 | The sectoral gap identity linking private investment − saving, the budget deficit and the trade deficit | 2.2/2.3 | Trade deficit Rs 500 crore (worked below) |
| 7 | Depreciation from GDP, GNP and National Income data | 2.3 chain (p. 25–28) | Depreciation Rs 200 crore |
| 8 | Transfer payments from the PDI chain | 2.3 (p. 18, 27–28) | Transfers Rs 100 crore |
| 9 | Personal Income and Personal Disposable Income from given data | 2.3, Table 2.4 (p. 27–28) | PI Rs 7,300 crore; PDI Rs 6,800 crore |
| 10 | Raju the barber — the whole aggregate ladder for one person | 2.3 aggregate ladder | GDP 500; NNP at market price 450; NNP at factor cost 420; PI 200; PDI 180 |
| 11 | The GNP deflator; reading the index against 100 | 2.4 (p. 29) | 83.33%; the price level has fallen |
| 12 | The limitations of GDP as a welfare index | 2.5 (p. 22–23) | — |
Q6 is the exercise that most often trips students, because the budget deficit is given as a negative number. Work it from the grand identity instead of quoting a result.
Step 1 (two ways to write GDP): on the expenditure side, \(\text{GDP} \equiv C + I + G + X – M\).
On the income side, every rupee of GDP is consumed, saved or paid in taxes, so \(\text{GDP} \equiv C + S + T\).
Step 2 (equate and cancel C):
\[ I + G + X – M \equiv S + T \]
Step 3 (bring the three gaps together):
\[ (I – S) + (G – T) \equiv M – X \]
Step 4 (substitute): the excess of private investment over saving, \(I – S\), is Rs 2,000 crore.
The budget deficit is \(G – T = -1{,}500\) crore — a negative deficit is a budget surplus.
\[ M – X = 2{,}000 + (-1{,}500) = 500 \]
Final answer: the trade deficit is Rs 500 crore.
The trap: a negative budget deficit is not “no deficit” — it is a surplus, and it must be entered as −1,500. Students who subtract 1,500 get 3,500. The check: the surplus of 1,500 pays for part of the 2,000 excess investment, so only 500 must be financed from abroad.
A full answer to Q2 or Q5 must do two things: write the identity and explain the circular flow in words — the formula alone is half the answer. For Q10, give all five measures separately, in the order asked, each with its unit (Rs).
Textbook contents and the examinable syllabus are not always identical — check the current official CBSE syllabus for what is examinable this session.
One practice strategy for the whole set: rewrite the grand identity (equation 2.6) with your own numbers each time you revise, because nearly every numerical in this exercise set is a rearrangement of it.
Revision Summary: The Chapter in One Read
These takeaways follow the book’s own Summary (NCERT, p. 32), restated so you can check overnight whether you can still reproduce each step.
- The macroeconomy runs in a circle — firms pay households for factor services, households buy firms’ output, and the money keeps going round.
- Because the same income circulates, it can be measured at three points: factor payments (income method), output value (product method), spending (expenditure method).
- The product method must count only final goods — value added removes intermediate goods and kills double counting.
- Investment goods add future productive capacity, so more capital goods now means a smaller share for consumer goods now but a bigger economy later — a present-versus-future trade-off.
- Aggregate income has many forms depending on whose hands it reaches: GDP, GNP, NNP at market prices, NNP at factor cost (National Income), PI and PDI.
- Prices move, so comparisons need constant prices and the price indices — the GDP deflator, the CPI and the WPI.
- GDP is not a dependable index of welfare.
Equations in reading order, with pages:
- Net Investment = Gross Investment − Depreciation (p. 12)
- \(\text{GDP} \equiv \sum_{i=1}^{N} GVA_i\) (p. 20)
- \(\text{GDP} \equiv C + I + G + X – M\) (p. 22)
- \(\text{GDP} \equiv W + P + In + R\) (p. 22)
- \(\text{GDP} = \sum GVA = C + I + G + X – M = W + P + In + R\) (p. 23)
- GNP = GDP + NFIA; NNP = GNP − Depreciation; National Income = NNP at market prices − net indirect taxes (p. 25)
- GDP deflator = Nominal GDP ÷ Real GDP (p. 29)
Related Resources
Once Chapter 2 is in place, the natural next moves are the rest of the book and the revision material around it.
- Class 12 Economics book page — see every chapter of the NCERT book at a glance.
- Chapter 1, Introduction — the chapter before this one.
- Chapter 3, Money and Banking — the chapter that follows.
- Class 12 Economics notes — revision notes for the same chapters.
- Money and Banking notes — a closer look at the next chapter’s ideas.
- Class 12 study material — hubs for every Class 12 subject.
- CBSE notes index — everything organised by class and subject.
Reference: NCERT Class 12 Introductory Macroeconomics textbook, chapter 2, official edition on ncert.nic.in.
Sources and Data Verification
- The figures and page references on this page describe the current NCERT Class 12 Introductory Macroeconomics textbook — the edition whose chapter tables carry the 2024-25 provisional Indian estimates from the RBI’s Annual Report (Tables 2.5 and 2.6, NCERT p. 34–35) — as published on ncert.nic.in. The current edition can be verified on the official NCERT textbook portal.
- This page covers Chapter 2 of that book only — not the whole syllabus, and not other Class 12 books.
- The listing is maintained for the current academic session using the NCERT information available to us.
- NCERT settles textbooks, editions and PDFs; CBSE settles the curriculum, syllabus and examinations.
FAQ: National Income Accounting Class 12
What is the difference between GDP and GNP?
GNP = GDP + net factor income from abroad (NFIA). GDP counts production inside the country whoever produces it; GNP counts production by a country’s own factors wherever they work. A Korean-owned factory in India adds to India’s GDP, but its profits are subtracted when moving to India’s GNP (NCERT, p. 17).
Why do the product, expenditure and income methods give the same GDP?
Because the same income circulates: what firms pay out as factor incomes becomes households’ spending, and that spending equals the value of what firms produced. In symbols, GDP = \(\sum GVA = C + I + G + X – M = W + P + In + R\) (identity 2.6, NCERT p. 23). Each method catches the circular flow at a different point (p. 6–8).
What is the difference between the GDP deflator and the Consumer Price Index?
The deflator is nominal GDP divided by real GDP and covers everything produced; the CPI tracks the cost of a fixed basket of consumer goods. They differ because the CPI covers only consumer goods, the CPI includes prices of imported goods while the deflator does not, and CPI weights are constant while the deflator’s weights move with production (NCERT, p. 29–30).
What is the difference between final goods and intermediate goods?
Apply the use test: a good is final if it will not pass through any more stages of production; it is intermediate if it is used as an input. The same tea leaves are a final good brewed at home and an intermediate good bought by a restaurant (NCERT, p. 2–3).
Why is GDP not a good measure of welfare?
Three reasons: income distribution can worsen while GDP rises; non-monetary exchange such as unpaid domestic work and barter is missed; and externalities — a polluting refinery adds to GDP while the harm it causes is not counted. GDP can therefore overestimate or underestimate welfare (NCERT, p. 22–23).
How do you move from National Income to Personal Disposable Income?
First get Personal Income: PI = NI − undistributed profits − corporate tax − net interest paid by households + transfer payments. Then subtract personal tax payments and non-tax payments: PDI = PI − personal tax − non-tax (NCERT, p. 18).
Explore Class 12 Economics Books
Related chapters: