
Open economy macroeconomics class 12 chapter 6 of the NCERT Economics textbook Introductory Macroeconomics explains what happens to the basic macro model once a country trades with the rest of the world. The chapter covers the balance of payments, the foreign exchange market and exchange rate systems, and closes with an appendix on how trade changes national income determination.
It appears in the 2026-27 NCERT reprint, and the official chapter PDF is on this page.
Download the official Open Economy Macroeconomics Class 12 Chapter 6 PDF
The official NCERT chapter file is published on the NCERT textbook portal for the current edition of Introductory Macroeconomics as a clean, printable PDF and is the exact version the board prescribes. Open the Open Economy Macroeconomics Class 12 Chapter 6 PDF directly from the NCERT portal rather than a third-party scan.
| What the chapter holds | Count | Where it is used |
|---|---|---|
| Printed pages | 15 | |
| Sections in the chapter | 9 | |
| Figures with NCERT captions | 6 | |
| Tables | 5 | |
| Worked examples | 2 | solved step by step in our NCERT Solutions |
| Exercise questions | 19 | answered in our NCERT Solutions |
| Official NCERT PDF | Download the chapter PDF | the chapter exactly as NCERT publishes it |
Chapter 6 at a glance
The table below lists what this chapter holds — its sections, figures, worked examples and exercise questions — so you know the size of the file before you open it.
What this chapter covers, section by section
This map follows the printed book page by page. Read a row, then open the chapter to that page and the ideas line up with the headings you see.
| Section | What it holds | NCERT page |
|---|---|---|
| Chapter opening | What an open economy is; output, financial and labour market linkages; imports as leakage and exports as injection; the foreign exchange rate defined for the first time | 86 |
| 6.1 The Balance of Payments | The BoP as the record of transactions with the rest of the world; its two main accounts | 87 |
| 6.1.1 Current Account | Trade in goods and services, factor and non-factor income, transfer payments (gifts, remittances, grants) | 87 |
| Balance on Current Account | Balance of trade (goods only) and net invisibles; surplus, balance and deficit | 88 |
| 6.1.2 Capital Account | Asset transactions: FDI, FII, external borrowings and assistance; why buying a foreign asset is a debit | 88 |
| 6.1.3 BoP Surplus and Deficit | The identity current account + capital account = 0; official reserve transactions as the balancing item | 89 |
| Autonomous and Accommodating Transactions; Errors and Omissions | Above the line vs below the line items; Table 6.1, a sample BoP for India | 90 |
| 6.2 The Foreign Exchange Market | Participants; reasons for the demand for and supply of foreign exchange | 91 |
| 6.2.2 Determination of the Exchange Rate | Flexible rates with Fig 6.1 and Fig 6.2; speculation, interest rate differential, income effects, purchasing power parity | 92-93 |
| Fixed Exchange Rates | Government-set rate; devaluation and revaluation; Fig 6.3 and RBI intervention | 94 |
| 6.2.3-6.2.4 Merits, Demerits, Managed Floating | The two systems compared; dirty floating and central bank moderation | 95 |
| Key Concepts and Exercises | The chapter’s concept list and its full exercise set | 95-96 |
| Appendix 6.1: Determination of Equilibrium Income in an Open Economy | National income identity, import function, marginal propensity to import, the open economy multiplier, export and import multipliers | 97-99 |
| Worked examples in the chapter | Example 6.1 on PPP and shirt prices; Example 6.2 on closed vs open multipliers | 94, 98 |
Key concepts of the chapter
The chapter’s own Key Concepts list (p. 95) names the ideas you must be able to define; this section strings them together so they read as one story.
- Open vs closed economy. A closed economy has no linkages with the rest of the world; an open economy trades in goods and services and usually also in financial assets. The three channels of linkage are the output market, the financial market and the labour market (p. 86).
- Leakage and injection. When Indians buy foreign goods, that spending escapes as a leakage from the circular flow and lowers aggregate demand. Exports enter as an injection and raise demand for domestic output (p. 86). This leakage idea returns in the appendix as the marginal propensity to import.
- Balance of payments. The BoP records transactions in goods, services and assets between residents of a country and the rest of the world over a year. It has two main accounts — the current account and the capital account (p. 87).
- Current vs capital account. The current account records trade in goods and services plus transfer payments; the capital account records all international transactions of assets (pp. 87-88).
- The BoP identity and reserves. Because any current account deficit must be financed, the two accounts always cancel: current account + capital account = 0. If they do not cancel by themselves, the central bank steps in through official reserve transactions, which are the balancing (accommodating) item (p. 89).
- Autonomous vs accommodating. Autonomous transactions are made for their own sake (such as earning profit) and are above the line; accommodating transactions exist to bridge the BoP gap and are below the line (p. 90).
- Demand for and supply of foreign exchange. People demand dollars to buy foreign goods, send gifts abroad and buy foreign assets; dollars are supplied when foreigners buy our exports, send transfers and buy our assets (pp. 91-92).
- Depreciation vs devaluation. Depreciation/appreciation are market outcomes under a flexible rate; devaluation/revaluation are government acts under a fixed rate (pp. 92, 94).
- Purchasing power parity. PPP is how the book predicts long-run exchange rates: with no tariffs or quotas, exchange rates adjust so the same product costs the same in any country, apart from transport costs (p. 93).
- Managed floating. Also called dirty floating, this mixes the two systems — the market floats the rate while central banks intervene to moderate movements, so official reserve transactions are not zero (p. 95).
- Marginal propensity to import. The fraction of an extra rupee of income spent on imports, written m, with 0 < m < 1. It shrinks the open economy multiplier (p. 98).
Flexible, fixed and managed floating at a glance
Examiners ask for this comparison in several forms, so learn the table, not the paragraphs.
| Feature | Flexible (floating) rate | Fixed rate | Managed floating |
|---|---|---|---|
| Who sets the rate | Market demand and supply (p. 92) | The government (p. 94) | Market, but central banks steer (p. 95) |
| Central bank intervention | None in a completely flexible system (p. 92) | Continuous, to hold the announced rate (p. 94) | Occasional, to moderate movements (p. 95) |
| Term when the domestic currency becomes cheaper | Depreciation (p. 92) | Devaluation (p. 94) | No separate term given |
| Term when the domestic currency becomes dearer | Appreciation (p. 92) | Revaluation (p. 94) | No separate term given |
| Main weakness the book notes | Needs no reserves, but the book lists its merits rather than a drawback | Prone to speculative attack when reserves look inadequate (p. 95) | Official reserves still change (p. 95) |
A way to remember the BoP identity. Think of a household: a family that spends more than it earns must borrow or sell something. A country with a current account deficit (spending more than it receives from the rest of the world) must finance it by a capital account surplus, a net capital inflow.
So CA + KA ≡ 0 — one account’s shortage is the other account’s job (p. 89).
Reading the figures of the chapter
One warning before the diagrams: the book numbers Fig 6.1 and Fig 6.2 twice — once for the current and capital account components (pp. 87-88) and again for the flexible exchange rate graphs (p. 92). Follow the caption, not the number.
The current and capital account diagrams (pp. 87-88)
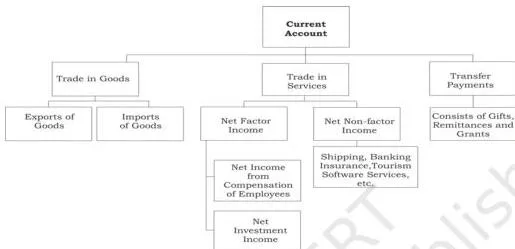
The current account branches into trade in goods (exports and imports), trade in services (factor income such as earnings on labour, land and capital, plus non-factor income such as shipping, banking, tourism and software services) and transfer payments — gifts, remittances and grants received without any good or service in return (p. 87).
Memorise the three branches; questions on remittances and services land here.
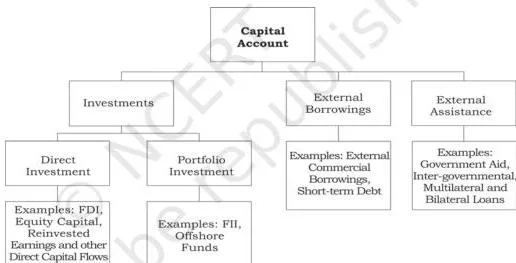
The capital account classifies the asset transactions: FDI (foreign direct investment), FII (foreign institutional investment), external borrowings and assistance (p. 88). The debit/credit rule matters here: buying a foreign asset sends foreign exchange out of India and is a debit; selling an asset to a foreigner brings foreign exchange in and is a credit.
The flexible exchange rate diagrams (p. 92)
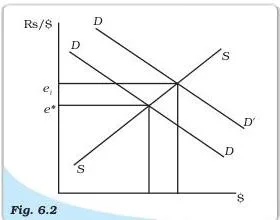
Read this graph the way you read any market: the exchange rate (rupees per dollar) is on the vertical axis and the quantity of dollars on the horizontal axis. The demand curve slopes down — a dearer dollar makes imports costlier in rupees, so import demand and the demand for foreign exchange fall.
The supply curve slopes up — a dearer dollar makes Indian exports cheaper for foreign buyers, so more dollars are offered. The rate settles where the two curves cross, at point e on the vertical axis, trading quantity q of dollars (p. 92).

Now the demand curve shifts right and up — the book’s example is Indians travelling abroad more. The equilibrium moves from e0 = 50 to e1 = 70 rupees per dollar, so it takes more rupees to buy one dollar. Because the price of the dollar in terms of the rupee has risen, the rupee has depreciated (p. 92).
This one diagram explains the most frequent numerical question in the chapter.
The PPP and fixed rate diagrams (pp. 93-94)

This figure belongs to the purchasing power parity discussion: as long as there are no tariffs or quotas, exchange rates should eventually adjust so the same product costs the same whether measured in rupees in India or dollars in the US, apart from transport costs (p. 93).
Example 6.1 applies it: if a shirt costs $8 in the US and Rs 400 in India, the rate should be Rs 50 per dollar; any higher rate sends the shirt business to India, any lower rate to the US (p. 94).
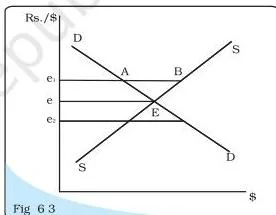
Under a fixed rate the market may want a different rate than the government. If the government fixes e1 above the market rate e, the supply of dollars exceeds demand by the segment marked AB; the RBI buys the surplus with rupees, accumulating reserves.
If it fixes e2 below the market rate, there is excess demand for dollars; the government must sell from its past holdings, and if it cannot, a black market for dollars appears (p. 94). The government action that raises the rate is devaluation; the action that lowers it is revaluation (p. 94).
Definitions to write correctly in the exam
These are the terms the chapter expects you to define precisely. Each is a student rewrite of the book’s idea, with the page where the book presents it.
| Term | What to write | NCERT page |
|---|---|---|
| Open economy | An economy that trades in goods and services with other nations and usually also in financial assets | 86 |
| Foreign exchange rate | The price of one currency in terms of another; it links currencies and allows comparison of international costs and prices | 86 |
| Balance of payments | The record of all transactions in goods, services and assets between a country’s residents and the rest of the world for a year | 87 |
| Current account | The record of trade in goods and services plus transfer payments received for free — gifts, remittances and grants | 87 |
| Balance of trade | The difference between the value of exports and imports of goods only; exports are credits, imports are debits | 88 |
| Net invisibles | The difference between exports and imports of services, transfers and income flows between countries | 88 |
| Capital account | The record of all international transactions of assets; buying a foreign asset is a debit because foreign exchange flows out | 88 |
| Autonomous transactions | Transactions made for reasons other than bridging the BoP gap, such as earning profit; the above the line items | 90 |
| Accommodating transactions | Transactions determined by the BoP gap — the below the line items; official reserves are the accommodating item | 90 |
| Errors and omissions | The third element of the BoP, reflecting that not every international transaction can be recorded accurately | 90 |
| Foreign exchange market | The market in which national currencies are traded for one another, worldwide, with continuous contact between trading centres | 91 |
| Depreciation | A rise in the price of foreign currency in terms of domestic currency under a flexible rate, making the domestic currency cheaper | 92 |
| Appreciation | A fall in the price of foreign currency under a flexible rate, making the domestic currency dearer | 92 |
| Devaluation | A government action that raises the exchange rate under a fixed rate system, making the domestic currency cheaper | 94 |
| Revaluation | A government action that lowers the exchange rate under a fixed rate system, making the domestic currency costlier | 94 |
| Managed floating | A mixture of flexible and fixed systems, also called dirty floating, where central banks intervene to moderate exchange rate movements | 95 |
| Marginal propensity to import | The fraction of an extra rupee of income spent on imports, with value between 0 and 1; analogous to the marginal propensity to consume | 98 |
Formulas from the chapter, with symbols explained
These are the working formulas of the chapter. The BoP identity is an accounting fact; the income identities from the appendix drive every numerical question on equilibrium income.
| Formula | What it says | Symbols | NCERT page |
|---|---|---|---|
| \( \text{Current account} + \text{Capital account} \equiv 0 \) | Any current account deficit must be financed by a capital account surplus (net capital inflow) | Current account, capital account | 89 |
| \( Y = C + I + G \) (6.1) | Closed economy national income identity — three sources of demand for domestic goods | Y income, C consumption, I investment, G government spending | 97 |
| \( Y + M = C + I + G + X \) (6.2) | Open economy identity; imports supplement domestic supply and exports add foreign demand | M imports, X exports | 97 |
| \( Y = C + I + G + X – M \) (6.3) \( Y = C + I + G + NX \) (6.4) |
Rearranged forms; net exports NX = X − M, positive in a trade surplus and negative in a deficit | NX net exports | 97 |
| \( M = \bar{M} + mY \), with \( \bar{M} > 0 \), \( 0 \lt m \lt 1 \) (6.5) | Import function — imports have an autonomous part and rise with income | \( \bar{M} \) autonomous imports, m marginal propensity to import | 98 |
| \( \text{Open economy multiplier} = \frac{\Delta Y}{\Delta \bar{A}} = \frac{1}{1 – c + m} \) (6.10) | Autonomous expenditure multiplier once imports leak from income | c marginal propensity to consume, m marginal propensity to import | 98-99 |
| \( \frac{\Delta Y^*}{\Delta \bar{X}} = \frac{1}{1 – c + m} \) (6.13) | Export multiplier — a rise in exports raises equilibrium income like any autonomous demand rise | \( \bar{X} \) autonomous exports | 99 |
| \( \frac{\Delta Y^*}{\Delta \bar{M}} = \frac{-1}{1 – c + m} \) (6.14) | Import multiplier — an autonomous rise in imports lowers equilibrium income; note the minus sign | \( \bar{M} \) autonomous imports | 99 |
Worked example: open multiplier vs closed multiplier
Take a marginal propensity to consume of c = 0.6 and a marginal propensity to import of m = 0.1.
Step 1: Write both multiplier formulas.
\[ \text{Closed economy multiplier} = \frac{1}{1 – c}, \quad \text{Open economy multiplier} = \frac{1}{1 – c + m} \]
Step 2: Substitute \( c = 0.6 \) and \( m = 0.1 \).
\[ \frac{1}{1 – 0.6} = \frac{1}{0.4} = 2.5 \]
\[ \frac{1}{1 – 0.6 + 0.1} = \frac{1}{0.5} = 2 \]
Step 3: Apply the open multiplier to a rise in exports of 100 units.
\[ \Delta Y = \frac{1}{1 – c + m} \times \Delta \bar{X} = 2 \times 100 = 200 \]
Final answer: the open economy multiplier is 2 against 2.5 in the closed economy, so exports rising by 100 raise equilibrium income by only 200 units.
Why it is smaller: at every round of the multiplier, households spend part of their extra income on imports, so that fraction m never becomes demand for domestic output — it leaks abroad exactly like saving does (p. 98).
Worked example: the real exchange rate and what to buy
The real exchange rate R is the price of foreign goods in terms of domestic goods, \( R = \frac{e \times P^*}{P} \), where e is the nominal rate, \( P^* \) the foreign price level and P the domestic price level.
Step 1: Suppose a meal basket costs ₹300 in India and $5 in the US, with the nominal rate at ₹55 per dollar.
\[ R = \frac{55 \times 5}{300} = \frac{275}{300} \approx 0.92 \]
- Step 1: Since the US basket costs only ₹275 while the Indian basket costs ₹300, foreign goods are cheaper — buy the US basket.
- Step 2: Now let the rupee depreciate to ₹65 per dollar, prices unchanged.
\[ R = \frac{65 \times 5}{300} = \frac{325}{300} \approx 1.08 \]
Step 4: The US basket now costs ₹325 — domestic goods are cheaper.
Final answer: R less than 1 means foreign goods are cheaper; R greater than 1 means domestic goods are. The real exchange rate, not the nominal one, is the rate that decides whether to buy domestic goods or foreign goods (p. 96, Q3).
Mistakes students make in this chapter
Most errors here are not calculation errors but confusions between two terms the book deliberately sets apart. Name the confusion before it happens and the numerical questions become mechanical.
| Mistake | Correct rule | How to check your answer |
|---|---|---|
| Mixing up depreciation and devaluation | Depreciation is the market outcome under a flexible rate (p. 92); devaluation is a government action under a fixed rate (p. 94) | Ask who moved the rate: the market → depreciation; the government → devaluation |
| Treating balance of trade as equal to the current account balance | BOT counts goods only; the current account adds net invisibles — services, transfers and income (p. 88) | If the question mentions services or remittances, use the current account |
| Thinking a current account deficit means the BoP is in deficit | CA + KA ≡ 0: a current account deficit can be fully financed by a capital account surplus (p. 89); Table 6.1 shows India with a trade deficit, a current account deficit and overall balance zero (p. 90) | Check the overall balance, never the current account alone |
| Reversing the sign of reserve changes | A BoP deficit means official reserves fall — the central bank sells foreign exchange (p. 89) | Remember a reserve sale is how a deficit is paid for |
| Assuming a current account deficit is automatically alarming | It is a problem only if it cannot be financed; financed by capital inflows it is BoP equilibrium (pp. 89, 96 — the book sets exercise Q17 precisely on this) | Ask how the deficit is financed before judging it |
| Using the closed multiplier \( 1/(1 – c) \) in an open economy | Use \( 1/(1 – c + m) \); imports leak from every round of the multiplier (p. 98) | Whenever imports depend on income, add m to the denominator |
| Using the nominal exchange rate to decide what to buy | The real exchange rate compares actual prices, so it is the relevant rate (p. 96, Q3) | Convert both goods to one currency and compare |
Exam notes: what to practise
The chapter’s exercise set (p. 96) is the best practice map available. The mapping below shows what each question actually tests, so you can drill weak spots instead of redoing everything.
| Question | What it tests | What a full answer includes |
|---|---|---|
| Q1 | Balance of trade vs current account balance | Both definitions and one contrast: BOT is goods only, the current account adds invisibles |
| Q2 | Official reserve transactions | Definition and their role as the accommodating, balancing item (p. 89) |
| Q3 | Nominal vs real exchange rate | Both definitions and the conclusion that the real rate decides buying (p. 96) |
| Q4 | Real exchange rate calculation | Convert the nominal rate to rupees per yen first, then apply the formula and state the answer |
| Q5 | Automatic BoP adjustment under the gold standard | The self-correcting mechanism when a fixed gold price anchors currencies |
| Q6 | Flexible rate determination | Demand and supply of foreign exchange; equilibrium where they cross (p. 92) |
| Q7 | Devaluation vs depreciation | Both definitions, with the regime each belongs to (pp. 92, 94) |
| Q8 | Managed floating intervention | Yes — central banks intervene to moderate movements, not to fix a level (p. 95) |
| Q9 | Demand for domestic goods vs domestic demand | Domestic demand includes imports; demand for domestic goods excludes them (p. 97) |
| Q10 | Marginal propensity to import from an import function | Read m from \( M = 60 + 0.06Y \): m = 0.06, and imports are a leakage from aggregate demand (p. 98) |
| Q11 | Why the open multiplier is smaller | The import leakage at each round of the multiplier (p. 98) |
| Q12 | Multiplier with proportional taxes \( T = tY \) | Redo the derivation with \( c(1 – t) \) in place of c: multiplier \( 1/(1 – c(1 – t) + m) \) |
| Q13 | Equilibrium income with imports | Substitute into the open identity, solve for Y, then find NX = X − M (pp. 97-98) |
| Q14 | Change in exports | Use the export multiplier \( 1/(1 – c + m) \) and recompute the net export balance (p. 99) |
| Q15 | PPP calculation | Prices doubling in India halve the rupee’s value: the rate becomes Rs 60 per dollar (p. 93) |
| Q16 | Fixed rates and inflation | Higher inflation makes a country’s goods less competitive when the rate cannot adjust (p. 96) |
| Q17 | Current account deficit | A reasoned answer — not always alarming if financed (pp. 89, 96) |
| Q18 | Equilibrium income, budget and trade balance | Full substitution for Y, then T − G for the budget and X − M for the trade balance (p. 96) |
| Q19 | Exchange rate arrangements | Fixed, flexible and managed floating, with how each brings stability (pp. 92-95) |
Learn the method, not the numbers. The two worked examples in the chapter — Example 6.1 on PPP and shirt prices (p. 94) and Example 6.2 comparing closed and open multipliers (p. 98) — demonstrate the exact substitution style expected for numerical answers. Practise with your own numbers so the steps, not the figures, become automatic.
One detail objective questions can test: Box 6.1 (p. 90) explains that India has moved to the IMF’s new BPM6 classification of the BoP into three accounts — current, financial and capital — even though the RBI still publishes the older two-account format. The chapter teaches the two-account format; know that the change exists.
Check the syllabus. Textbook contents and the examinable syllabus are not always identical — check the current official CBSE syllabus before deciding what to skip. For chapter-wise practice material on this book, the Class 12 Economics notes hub gathers the pages for both NCERT economics textbooks.
Rapid recap of the whole chapter
This recap pulls the chapter’s own Key Concepts (p. 95) into a single chain you can read in two minutes, the night before the exam.
- An open economy trades goods, services and financial assets with the rest of the world; imports leak from and exports inject into the circular flow (p. 86).
- The balance of payments records all such transactions in the current account and the capital account (p. 87).
- Current account + capital account ≡ 0; official reserves are the balancing item, and a BoP deficit means reserves fall (p. 89).
- The exchange rate is the price of one currency in terms of another — set by demand and supply under flexible rates, fixed by the government under fixed rates, and steered by central banks under managed floating (pp. 91-95).
- Depreciation and appreciation are market movements; devaluation and revaluation are policy acts (pp. 92, 94).
- Purchasing power parity explains long-run exchange rate movements: the same product ends up costing the same everywhere, apart from transport costs (p. 93).
- In the open economy \( Y = C + I + G + NX \), and the multiplier shrinks to \( 1/(1 – c + m) \) because imports leak from every round (pp. 97-98).
Related resources
This is the final chapter of Introductory Macroeconomics, so the natural next step is revision of the whole book. The demand-supply reasoning you met in microeconomics chapters such as Market Equilibrium reappears here as the foreign exchange market, and the multiplier analysis builds on the consumption ideas from earlier macro chapters.
The Class 12 Economics book page lists both NCERT economics textbooks, the Class 12 hub collects every subject, and the main CBSE notes page is where all class levels begin.
Sources and data verification
- The content on this page describes Chapter 6, Open Economy Macroeconomics, of the NCERT Class 12 Economics textbook Introductory Macroeconomics, Reprint 2026-27 edition, as published on ncert.nic.in.
- This page covers that single chapter of that book only — it does not cover the Class 12 microeconomics textbook or Indian Economic Development.
- This listing is maintained for the current academic session using the NCERT information available to us.
- NCERT settles textbooks, editions and official PDFs; CBSE settles the curriculum, syllabus and examinations. Textbook contents and the examinable syllabus are not always identical — check the current official syllabus.
Reference: NCERT Class 12 Economics textbook (Introductory Macroeconomics), chapter 6, official edition on ncert.nic.in.
Frequently asked questions
What is the difference between depreciation and devaluation of a currency?
Depreciation is a market outcome: under a flexible exchange rate, the price of foreign currency rises because demand and supply moved — for example, Indians travelling more raises the demand for dollars (p. 92). Devaluation is a government act: under a fixed exchange rate, the government itself raises the exchange rate, making the domestic currency cheaper (p. 94).
Both mean the domestic currency buys fewer dollars; the difference is who moved the rate.
Why is the open economy multiplier smaller than the closed economy multiplier?
The closed multiplier is \( 1/(1 – c) \), the open multiplier is \( 1/(1 – c + m) \). Since the marginal propensity to import m is positive, the open denominator is larger and the multiplier smaller. The reason is that at every round of the multiplier, part of the extra income is spent on imports and leaks abroad, so it never becomes demand for domestic output (p. 98).
What is the difference between balance of trade and current account balance?
Balance of trade is exports minus imports of goods only. Current account balance is the balance of trade plus net invisibles — services, transfers and income flows (p. 88). The balance of trade is therefore one component of the current account, not its equal.
What are official reserve transactions in the balance of payments?
They are foreign exchange bought or sold by the monetary authority to settle the balance of payments gap. A BoP deficit means official reserves fall; a surplus means they rise. Because these transactions exist to bridge the gap, they are the accommodating item in the BoP (p. 89).
Is a current account deficit always a cause for alarm?
No. The identity current account + capital account = 0 means a current account deficit must be financed either by a net capital inflow or by drawing down reserves (p. 89). If stable capital inflows finance it, the BoP is in equilibrium; the deficit is alarming only when it cannot be financed. Exercise Q17 (p. 96) exists precisely on this point.
How is the exchange rate determined under a flexible exchange rate regime?
By demand and supply in the foreign exchange market. The demand for dollars slopes down — a dearer dollar makes imports costlier — and the supply slopes up — a dearer dollar makes exports cheaper for foreigners. The rate settles where the two curves cross, and in a completely flexible system the central bank does not intervene (p. 92).
Explore Class 12 Economics Books
- Previous: Market Equilibrium
Related chapters:
- Adam Smith
- A Simple Economy
- National Income Accounting