
Chapter 6 of the NCERT Class 11 Practical Work in Geography Part II textbook is titled “Introduction to Remote Sensing” and runs from NCERT page 69 to page 91. Below you get what the chapter actually contains — the stages of remote sensing, the satellites and sensors, the resolutions, and the elements of image interpretation — and the official PDF is right here.
Download the introduction to remote sensing class 11 chapter PDF from ncert.nic.in to read the full text, Box 6.1 and Tables 6.1 and 6.2 in print quality.
| What the chapter holds | Count | Where it is used |
|---|---|---|
| Printed pages | 24 | |
| Figures with NCERT captions | 26 | |
| Tables | 3 | |
| Exercise questions | 3 | answered in our NCERT Solutions |
| Activities | 1 | |
| Official NCERT PDF | Download the chapter PDF | the chapter exactly as NCERT publishes it |
Chapter 6 at a Glance
A satellite image is the end of a chain: energy, surface, sensor, product, interpretation. Hold that order in your head and every detail in this chapter finds its place.
The chapter moves from the concept of remote sensing and its eight data-acquisition stages, through the sensors that record energy and the satellites that carry them, to the resolutions that decide what can be seen, and finally to the data products and how interpreters read them. It closes with an Exercise and an Activity.
Watch for three study aids as you read: Box 6.1 compares sun-synchronous and geostationary satellites, Table 6.1 lists the spatial, spectral and radiometric resolutions of Landsat, IRS and SPOT sensors, and Table 6.2 gives colour signatures on a standard False Colour Composite.
What This Chapter Teaches: The Idea of Remote Sensing
Before any satellite or scanner makes sense, you need one sentence: remote sensing reads objects without touching them.
The term came into use in the early 1960s. It is defined as the total processes used to acquire and measure information about the properties of objects and phenomena through a recording device — the sensor — that is not in physical contact with what is being studied (NCERT, p. 69).
That definition rests on three ingredients, and Figure 6.1 shows them together: the object surface, the recording device, and the energy waves that carry information between them.
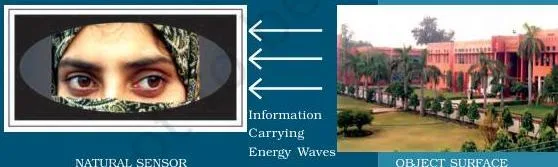
Why is this better than the two older methods, human eyes and photography? Both eyes and photographic systems respond to only a minute portion of the energy an object surface receives. Remote sensing devices react to a much wider range of radiations — reflected, emitted, absorbed and transmitted — from all surfaces with a temperature above 0 K (−273 °C) (NCERT, p. 69).
The Eight Stages of Remote Sensing, From Sun to Map
A satellite image is the end of a chain that starts with the Sun. The chapter breaks that chain into eight steps, shown together in Figure 6.2, and almost everything else in the chapter is a detail inside one of them (NCERT, pp. 71–74).
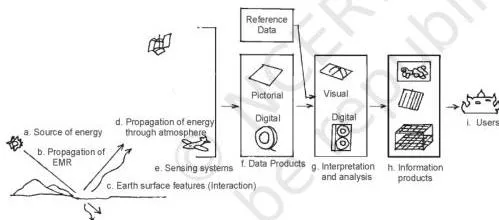
- Source of energy. The Sun is the most important source; energy can also come from self-emission or from artificial sources such as radar beams (NCERT, p. 71).
- Transmission to the surface. Energy travels from source to surface as waves at about 300,000 km per second — this propagation is electromagnetic radiation (NCERT, pp. 71–72).
- Interaction with the surface. Objects absorb, transmit, reflect or emit the energy they receive, and each object responds differently in different spectral regions (NCERT, pp. 72–73).
- Propagation back through the atmosphere. Reflected or emitted energy re-enters the atmosphere, where carbon dioxide, hydrogen and water molecules absorb middle-infrared energy and dust scatters blue energy — so some energy never reaches the sensor (NCERT, p. 73).
- Detection by the sensor. A sensor onboard a satellite records the energy that survives the trip (NCERT, p. 74).
- Conversion into data. The received radiation is converted into photographic or digital form and transmitted to an Earth Receiving Station (NCERT, p. 74).
- Extraction of information. After errors are corrected, information is pulled from digital images by digital image processing and from analogue products by visual interpretation (NCERT, p. 74).
- Conversion into maps and tables. The interpreted information is delineated into layers of thematic maps, with quantitative tables where needed (NCERT, p. 74).
Stage (c) is where objects reveal themselves, and water is the chapter’s cleanest example (NCERT, p. 73). Fresh water absorbs more energy in the red and infrared regions, so it reflects little of that energy and appears dark or black in a satellite image. Turbid water, loaded with suspended particles, reflects more in the blue and green regions and appears light.
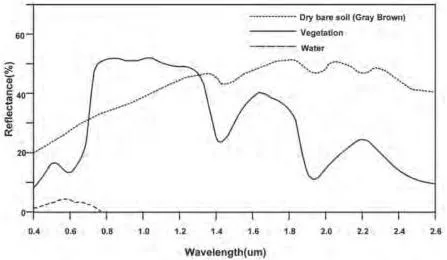
Figure 6.4 compares the spectral signatures of soil, vegetation and water — how each surface type responds differently across the spectrum. Figure 6.5 applies the idea to a real place: IRS-1C images of Sambhar Lake in Rajasthan, taken in the green band (left) and the infrared band (right).
The same lake looks different in the two bands, which is exactly the behaviour the chapter wants you to recognise (NCERT, p. 73).
The Electromagnetic Spectrum in This Chapter
The energy that carries object information is not one uniform wave — it spans a spectrum. This short section answers a whole MCQ.
Waves of electromagnetic radiation vary in wavelength and frequency; plotting those variations gives the electromagnetic spectrum, from short-wave, high-frequency gamma rays to long-wave, low-frequency radio waves (NCERT, p. 72).
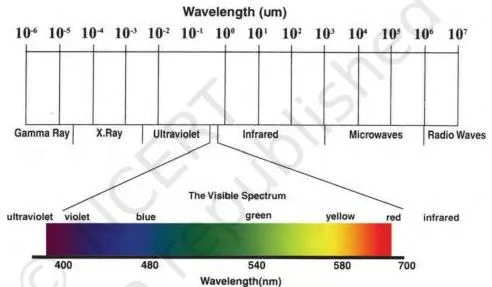
Figure 6.3 lays the spectrum out. The fact to memorise is the chapter’s restriction: only the visible, infrared and microwave regions are used in remote sensing (NCERT, p. 72). Exercise Question 1(ii) tests exactly this — the region that is not used is X-rays.
Sun-Synchronous vs Geostationary Satellites: IRS and INSAT
Where the sensor sits decides what it can see. The chapter sets two orbit types against each other, and students constantly swap their names.
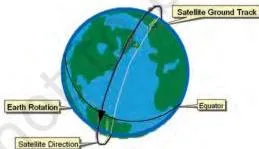
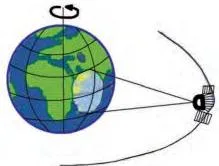
Remote sensing satellites, such as the Indian Remote Sensing (IRS) series, fly in near-polar sun-synchronous orbits at an altitude of 700–900 km. Weather monitoring and telecommunication satellites, such as the INSAT series, sit in geostationary orbits at nearly 36,000 km, moving in step with the Earth’s rotation so they stay over the same region (NCERT, p. 74).
| Orbital characteristic | Sun-synchronous (IRS) | Geostationary (INSAT) |
|---|---|---|
| Altitude | 700–900 km | About 36,000 km |
| Coverage | 81° N to 81° S | About one-third of the globe |
| Orbital period | About 14 orbits per day | 24 hours |
| Resolution | Fine — 182 m down to 1 m | Coarse — about 1 km × 1 km |
| Uses | Earth-resources applications | Telecommunication and weather monitoring |
Figure 6.6 shows the two paths: the near-polar orbit sweeps the latitudes as the Earth turns beneath it, while the geostationary satellite stays fixed over one part of the globe. Hold onto the altitude difference — 36,000 km is the giveaway for geostationary — and exercise Question 2(ii) writes itself from the table above (NCERT, Box 6.1, p. 74).
How Sensors Work: Whiskbroom and Pushbroom Scanners
Once the energy reaches the satellite, something has to turn it into data. The chapter focuses on two non-photographic sensors, and the number of detectors is the key to telling them apart.
A sensor receives electromagnetic radiation, converts it into a signal and presents it in a form suitable for extracting information. Photographic sensors — cameras — record a scene at one instant of exposure; non-photographic sensors, called scanners, build the image bit-by-bit (NCERT, p. 75).
Whiskbroom scanners use a rotating mirror and a single detector. As the mirror completes a rotation, the detector sweeps across the field of view through an angle of 90° to 120°, recording many narrow spectral bands from the visible to the middle infrared.
Two terms go with this design: the total extent of the oscillating sensor is the Total Field of View (TFOV), and the particular dimension the optical head sees while scanning is the Instantaneous Field of View (IFOV). Figures 6.7 and 6.8 in the chapter illustrate both scan mechanisms (NCERT, p. 76).
Pushbroom scanners replace the single detector with a line of detectors. The number of detectors equals the swath divided by the spatial resolution (NCERT, p. 76):
\[ \text{Number of detectors} = \frac{\text{swath}}{\text{spatial resolution}} = \frac{60\ \text{km} \times 1000\ \text{m/km}}{20\ \text{m}} = 3000 \]
That is the SPOT HRV-1 (High Resolution Visible Radiometer-1) on the French satellite SPOT. With a swath of 60 km and a spatial resolution of 20 m, the sensor needs 3000 detectors, each collecting the energy reflected by one 20 m ground cell (pixel) at the nadir view (NCERT, p. 76).
| Feature | Whiskbroom | Pushbroom |
|---|---|---|
| Detectors | Single detector + rotating mirror | Linear array of many detectors |
| Scan method | Mirror swings across the field of view | Detector line sweeps as the satellite moves |
| Detector count | One | Swath ÷ spatial resolution |
| Worked example | — | SPOT HRV-1: 3000 detectors |
Keep the contrast to two sentences: whiskbroom = one detector with a rotating mirror; pushbroom = a linear array whose size is swath ÷ resolution. Those two sentences carry exercise Questions 2(iii) and 3(i).
Resolving Powers and the Three Sensor Resolutions
The word “resolution” appears twice in this chapter with two different meanings — once for the satellite and once for the sensor. Separating them is half the battle.
The resolving power of a satellite is its temporal resolution, also called the revisit time. Because a sun-synchronous polar orbit brings the satellite back over the same area at fixed intervals, the satellite can image the same ground again and again and record change (NCERT, p. 77).
Figures 6.10(a) and 6.10(b) are the chapter’s proof. Both are images of Banda Aceh in Indonesia: the pre-tsunami image of June 2004 shows undisturbed topography, and the post-tsunami image of December 2004 reveals the damage caused by the Indian Ocean tsunami (NCERT, p. 77).
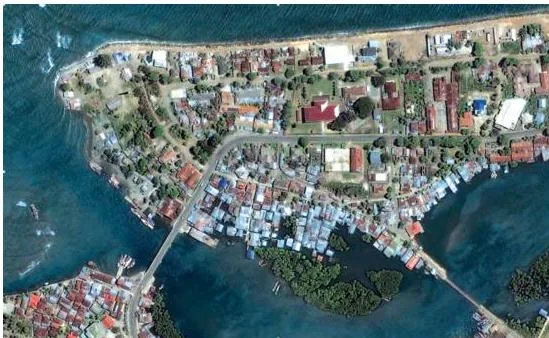
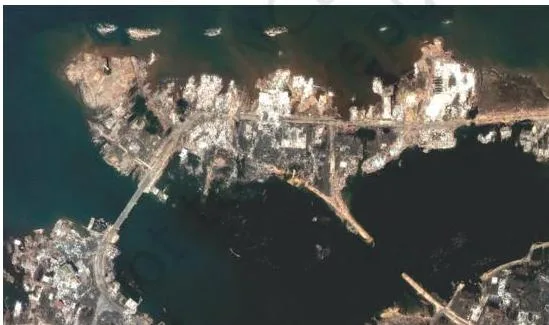
Put the two panels side by side: the same coastline months apart. No single photograph can produce that comparison — only a satellite that revisits the same spot can.
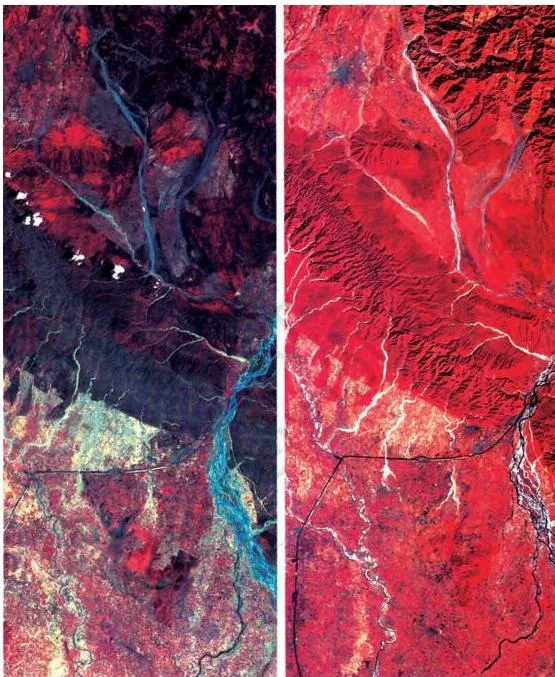
A second revisit example, the Himalayas imaged in May and November (Figure 6.9), shows vegetation change; that figure is needed for Question 3(ii) and is read in the exercise section below.
Sensor resolutions, by contrast, are three properties of the sensor itself (NCERT, p. 80):
- Spatial resolution — the capability to distinguish two closely spaced object surfaces as two different surfaces. The chapter compares it to eyesight: a person with weak resolving power needs spectacles to separate letters that blur together. Finer resolution means smaller objects can be identified (NCERT, p. 80).
- Spectral resolution — the sensing and recording power of the sensor in different bands of the electromagnetic spectrum. Multispectral images come from dispersing the received radiation and recording each band with dedicated detectors — the same principle as a rainbow or a prism (NCERT, p. 80).
- Radiometric resolution — the capability to discriminate between two targets. The higher it is, the smaller the radiance difference the sensor can detect between two targets (NCERT, p. 80).
Table 6.1 in the chapter puts numbers on these resolutions (NCERT, p. 80). A few rows show the trend:
| Satellite / sensor | Spatial resolution (m) | Bands | Radiometric range (grey levels) |
|---|---|---|---|
| Landsat MSS (USA) | 80.0 × 80.0 | 4 | 0–64 |
| Landsat TM (USA) | 30.0 × 30.0 | 4 | 0–255 |
| IRS LISS-III (India) | 23.0 × 23.0 | 4 | 0–127 |
| SPOT HRV-II (France) | 10.0 × 10.0 | 1 | 0–255 |
| IRS PAN (India) | 5.8 × 5.8 | 1 | 0–127 |
Read the trend: later sensors see sharper detail (80 m down to 5.8 m) and record finer grey-level differences (0–64 up to 0–255). Radiometric range is the grey scale of the glossary — black to white with intermediate greys (NCERT, p. 70).
Dispersion of Light and the False Colour Composite
A colour satellite image does not show true colours. Understanding why starts with a rainbow.
Multispectral imaging rests on the dispersion of light. A rainbow forms when water droplets in the atmosphere disperse sunlight, and a prism does the same in the laboratory, splitting white light into seven colours (NCERT, p. 81). Dispersion lets a sensor split the radiation it receives into bands and record each band separately.
Those separate bands have to be displayed as one picture, and that is what a False Colour Composite (FCC) does. An FCC is an artificially generated colour image in which blue, green and red are assigned to wavelength regions to which they do not belong in nature (NCERT, p. 70). The standard assignment is:
- blue is assigned to green radiation (0.5 to 0.6 µm);
- green is assigned to red radiation (0.6 to 0.7 µm);
- red is assigned to near-infrared radiation (0.7 to 0.8 µm).
Because healthy vegetation reflects strongly in the infrared, it appears red in a standard FCC — the single most important colour rule in this chapter (NCERT, p. 85).
The three panels below are IRS P-6 (Resourcesat-1) images of part of Najafgarh, Delhi, taken on 3 June 2005, each recorded in a single band (NCERT, p. 82):
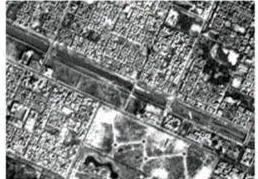
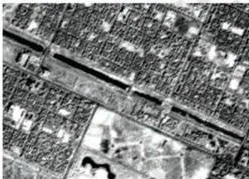
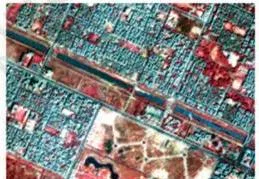
The chapter draws two extremes from these panels: fresh water shows strong absorption in band 4, the infrared, so water bodies go dark there, while dry surfaces give a mixed, strong reflectance in band 2, the green (NCERT, p. 80). That dark-water rule is the bridge to reading the colour signatures of Table 6.2.
Photographic vs Digital Data Products and What a Pixel Is
Once the data is down, what form does it take? One definition sentence separates the two kinds of product, and it is a favourite exam phrase.
An image is a pictorial representation of a scene, regardless of which region of energy detected and recorded it. A photograph is specifically an image recorded on photographic film. Hence: all photographs are images, but all images are not photographs (NCERT, p. 83).
Photographic images are acquired in the optical region of the spectrum, 0.3 to 0.9 µm, on one of four film types — black and white, colour, black and white infrared, and colour infrared — with black and white film the normal choice in aerial photography. A photograph can be enlarged as much as you like without losing information or contrast (NCERT, p. 83).
Digital images are built from discrete picture elements called pixels. Each pixel has an intensity value and an address in two-dimensional image space; that intensity value is the Digital Number (DN), which depends on the energy the sensor received and the intensity range used to describe it (NCERT, p. 83).
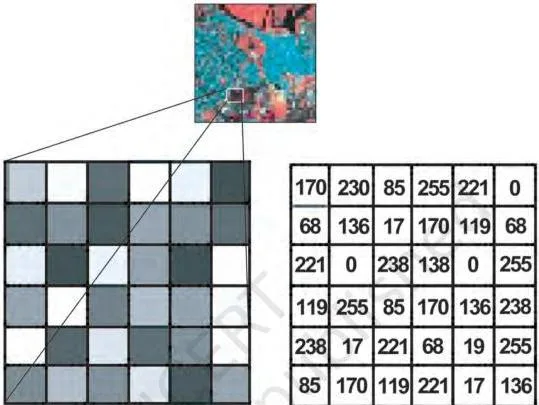
Figure 6.12 shows the idea: the top is the full digital image, the left panel is part of it zoomed until each pixel’s brightness is visible, and the right panel lists the associated Digital Numbers. Zoom past a certain point and the image loses information — you see only pixels (NCERT, p. 83).
A concrete detail closes the chain: the sensor onboard an earth-orbiting satellite transmits its collected data electronically to Earth Receiving Stations, and one in India is at Shadnagar near Hyderabad (NCERT, p. 74).
The Seven Elements of Visual Interpretation

Once you have a product, someone has to read it. Visual interpretation is the manual reading of images — identifying objects from their characteristics, with no software involved.
The chapter groups these characteristics into image characteristics — tone or colour, shape, size, pattern, texture and shadow — and terrain characteristics — location and association (NCERT, p. 85). The seven elements, with the chapter’s own examples (NCERT, pp. 85–89):
-
Tone or colour — the grey tone or colour in which an object appears, set by how much energy it reflects. Smooth, dry surfaces reflect more than rough, moist ones. Healthy vegetation reflects strongly in the infrared because of its multi-layered leaf structure, so it appears bright red in a standard FCC; scrub appears greyish-red.
A fresh water body appears dark or black; turbid water appears light or bluish.
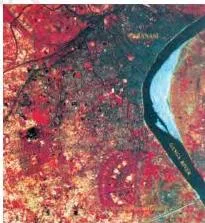
Figure 6.13(a) Turbid river. Source: NCERT -
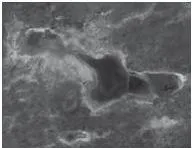
Texture — minor variations in tone or colour caused by many small features too small to see individually. Dense residential areas give fine texture; low-density areas are coarse. In high-resolution images, sugarcane or millet shows coarser texture than rice or wheat.

Figure 6.14(a) Coarse texture image of mangroves. Source: NCERT 
Figure 6.14(b) Fine texture of cropped land. Source: NCERT -
Size — judged from the resolution or scale of the image. Size distinguishes industrial complexes from residential dwellings, a stadium from brick kilns, and the hierarchy of settlements.
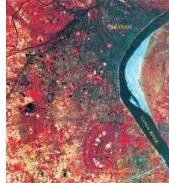
Figure 6.15 Variations in size between institutional buildings and residential areas may be distinctly identified in the images of parts of Kolkata (a) and Varanasi (b). Source: NCERT -
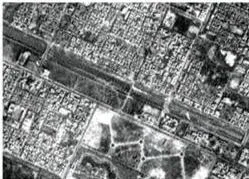
Shape — the outline or configuration of an object. The shape of the Sansad Bhawan is distinct from other built-up features. A railway line’s long, continuous, gradually curving linearity separates it from sharply bending roads; shape also identifies religious places such as mosques and temples.
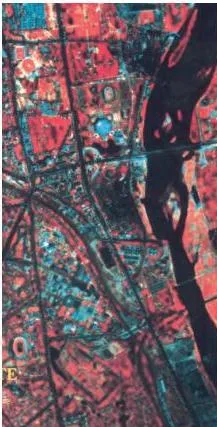
Figure 6.16 Curvilinear shape of the Railway Tract is Distinctly different from Sharp Bending Roads. Source: NCERT -
Shadow — depends on the Sun’s illumination angle and the object’s height. Qutub Minar, mosque minarets, overhead water tanks and electric or telephone lines can be identified from their shadows. Shadows are less useful in satellite images but helpful in large-scale aerial photography; in city centres they darken and hide features.
-
Pattern — repetitive arrangement of forms. Planned residential areas repeat the same house size and layout; orchards and plantations show uniform spacing between same-type plants; drainage and settlement types can be told apart by pattern.
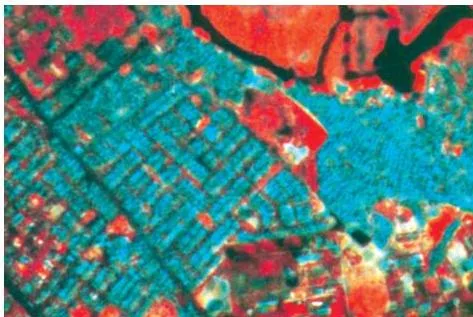
Figure 6.17 Planned residential areas are easily identifiable using the pattern they form. Source: NCERT -
Association — the relationship between objects and their surroundings, along with their geographical location. An educational institution sits in or near a residential area with a playground; stadiums, race courses and golf courses belong to large cities; industrial sites line highways at a growing city’s periphery; slums appear along drains and railway lines.
Tone and colour are read against the chapter’s Table 6.2 (NCERT, p. 86). The working set to remember:
| Earth surface feature | Colour on standard FCC |
|---|---|
| Healthy vegetation — evergreen | Red to magenta |
| Deciduous vegetation | Brown to red |
| Cropped land | Bright red |
| Scrub | Light brown with red patches |
| Clear water body | Dark blue to black |
| Turbid water body | Light blue |
| High-density built-up area | Dark blue to bluish green |
| Low-density built-up area | Light blue |
| Rock outcrops | Light brown |
| Sandy desert / river sand | Light blue to white |
| Deep ravines | Dark green |
| Waterlogged / wetlands | Mottled black |
Key Terms From the Chapter’s Glossary
The chapter prints its own glossary of the exact vocabulary. These are the terms that keep recurring in short-answer questions (NCERT, p. 70):
| Term | Meaning in the chapter |
|---|---|
| Absorptance | Ratio of the radiant energy absorbed by a substance to the energy it receives |
| Reflectance | Ratio of the radiant energy reflected by a substance to the energy it receives |
| Band | Specific wavelength interval in the electromagnetic spectrum |
| Electromagnetic radiation (EMR) | Energy propagated through space or a medium at the speed of light |
| Electromagnetic spectrum | Continuum of EMR from short-wave, high-frequency cosmic radiation to long-wave, low-frequency radio waves |
| Sensor | Any imaging or non-imaging device that receives EMR and converts it into a signal that can be recorded and displayed |
| Scene | The ground area covered by an image or a photograph |
| Image | Permanent record of a scene, produced by photographic or non-photographic means |
| Digital image | Array of digital numbers in rows and columns, each with an intensity value and a location |
| Digital Number (DN) | The intensity value of a pixel in a digital image |
| False Colour Composite (FCC) | Artificial colour image assigning blue, green and red to wavelength regions they do not belong to in nature |
| Grey scale | Scale from black to white with intermediate grey values, used to calibrate image brightness |
Common Mistakes Students Make in This Chapter
Five confusions cause most of the slip-ups in this chapter. Each row names the error, the rule in the book, and a quick way to catch yourself.
| Mistake | Correct rule (NCERT) | Quick check |
|---|---|---|
| Calling IRS a geostationary satellite | IRS is a remote sensing series in near-polar sun-synchronous orbit at 700–900 km; INSAT is geostationary at about 36,000 km (p. 74) | An altitude of 36,000 km means geostationary |
| Listing temporal resolution as a sensor resolution | Temporal resolution is the satellite’s revisit time; the three sensor resolutions are spatial, spectral and radiometric (pp. 77–80) | Ask: does this describe the orbit or the sensor? |
| Expecting fresh water to look bright | Fresh water absorbs red and infrared energy, so it appears dark or black; turbid water reflects blue-green and looks light (p. 73) | Dark water in the infrared band is fresh; light water is turbid |
| Calling every image a photograph | All photographs are images, but all images are not photographs — photographs are recorded on film (p. 83) | Was it recorded on photographic film? |
| Assuming X-rays or gamma rays are used | Only the visible, infrared and microwave regions are used in remote sensing (p. 72) | Question 1(ii) answer: X-rays |
How to Answer the Chapter’s Exercise Questions
The exercise on the last page of the chapter (NCERT, p. 91) tests exactly the ideas above: three MCQs, three short answers and two longer answers. Here is what each question is really asking.
Question 1: Three MCQs
1(i) asks for the true order of evolution of A. remote sensors, B. human eyes and C. photographic system. The chapter’s opening line gives the clue: human eyes and photographic systems are the older, limited methods, while remote sensing devices are “present day” (p. 69). So the order is human eyes → photographic system → remote sensors, option (b) BCA.
1(ii) asks which region is not used in satellite remote sensing. The chapter states plainly that the visible, infrared and microwave regions are used (p. 72); X-rays, option (c), is the odd one out.
1(iii) asks what is not used in visual interpretation. Visual interpretation is the manual exercise of reading images (p. 85); digital image processing runs on hardware and software, so it is option (d).
Question 2: About 30 words each
2(i) Why is remote sensing better? Build the answer on the chapter’s comparison: eyes and photographic systems respond to only a minute portion of the energy objects receive, while remote sensing devices react to a much wider range of radiations — visible, infrared and microwave — and can revisit an area to record change (pp. 69, 77).
2(ii) IRS vs INSAT. Use the Box 6.1 table. IRS satellites are sun-synchronous at 700–900 km with fine resolution, built for earth-resources applications; INSAT satellites are geostationary at about 36,000 km with coarse resolution, built for telecommunication and weather monitoring (p. 74).
2(iii) Pushbroom scanner. A linear array of detectors whose number equals the swath divided by the spatial resolution; SPOT HRV-1’s 60 km swath at 20 m resolution therefore needs 3000 detectors (p. 76).
Question 3: About 125 words each
3(i) Whiskbroom scanner with a diagram. Describe the rotating mirror and single detector sweeping across the field of view between 90° and 120°, define TFOV and IFOV, then contrast it with the pushbroom’s linear array — one detector versus many, mirror sweep versus fixed line. Draw the mirror and detector path using Figures 6.7 and 6.8 in the chapter (p. 76).
3(ii) Vegetation changes in the Himalayas (Fig. 6.9). Read the two panels of the image on NCERT page 77. The caption tells you what to list: the May image shows red patches of coniferous vegetation; the November image adds red patches of deciduous plants, and light red tones that are crops.
A complete answer names each vegetation class the caption gives and states which season shows it.
Revision Summary: The Chapter’s Ideas in One Place
If you have ten minutes, run this chain once, then again, until it sticks.
- Definition. Remote sensing acquires and measures information about objects through a sensor not in physical contact with them; the three ingredients are the object surface, the sensor and the energy waves (p. 69).
- Eight stages. Energy source → transmission → interaction → propagation → detection → conversion → extraction → map/table (pp. 71–74).
- Spectrum. Visible, infrared and microwave regions are used in remote sensing; X-rays are not (p. 72).
- Orbits. Sun-synchronous IRS at 700–900 km (resources, fine detail) vs geostationary INSAT at 36,000 km (weather and telecom, coarse) (p. 74).
- Sensors. Whiskbroom = one detector + rotating mirror; pushbroom = array of swath ÷ resolution detectors; SPOT HRV-1 gives 3000 detectors (p. 76).
- Resolutions. Temporal = the satellite’s revisit time; spatial, spectral and radiometric = sensor qualities (pp. 77–80).
- FCC. Blue ← green, green ← red, red ← near-infrared; vegetation reflects NIR, so it appears red; fresh water absorbs IR, so it appears dark (pp. 70, 82, 85).
- Products. All photographs are images, but all images are not photographs; digital images are pixels with Digital Numbers (p. 83).
- Interpretation. Seven elements — tone/colour, texture, size, shape, shadow, pattern, association (pp. 85–89).
Memory hook: one definition, eight stages, two orbit types, two scanners, four resolution terms, three FCC bands, seven elements. Remember that temporal resolution belongs to the satellite, while spatial, spectral and radiometric resolutions belong to the sensor.
Related Resources
The Practical Work chapter that comes just before this one, plus the class-level notes, let you go deeper.
- Class 11 Geography Topographical Maps notes — the previous chapter of Practical Work in Geography
- Class 11 Geography Climate notes — a related chapter from India Physical Environment
- All Class 11 Geography notes
- Class 11 study material hub
- CBSE notes index
The chapter itself suggests further reading at the ISRO, NRSC and IIRS websites — www.isro.gov.in, www.nrsc.gov.in and www.iirs.gov.in (NCERT, p. 89). You can also verify the complete book and edition on the official NCERT site: Practical Work in Geography Part II on ncert.nic.in.
Sources and Data Verification
This page describes Chapter 6 of the NCERT Class 11 Practical Work in Geography Part II textbook as published on ncert.nic.in; the page numbers, figures, tables and exercise text follow that edition (2026-27). It covers this one chapter only, not the other chapters of the book or the other Class 11 Geography textbooks.
NCERT settles the textbook, its editions and the official PDFs. CBSE settles the curriculum, syllabus and examinations — and textbook contents and the examinable syllabus are not always identical, so check the current official syllabus for what is assessable this session.
Frequently Asked Questions
Which regions of the electromagnetic spectrum are used in satellite remote sensing?
The chapter groups the spectrum into gamma, X-ray, ultraviolet, visible, infrared, microwave and radio regions, and states that only the visible, infrared and microwave regions are used in remote sensing (NCERT, p. 72). X-rays — option (c) of exercise Question 1(ii) — are the classic wrong answer.
What is the difference between IRS and INSAT satellites?
IRS (Indian Remote Sensing series) flies in near-polar sun-synchronous orbits at 700–900 km with fine resolution (182 m to 1 m) for earth-resources applications. INSAT satellites are geostationary at about 36,000 km, cover about one-third of the globe and give coarse resolution (about 1 km × 1 km) for telecommunication and weather monitoring (NCERT, p. 74, Box 6.1).
Why does fresh water appear dark or black in a satellite image?
Fresh water absorbs more energy in the red and infrared regions than it reflects, so little of that radiation reaches the sensor and the water body records as dark or black. Turbid water, carrying suspended particles, reflects more blue and green energy and appears light (NCERT, p. 73).
What is the difference between a photograph and an image in remote sensing?
An image is any pictorial representation of a scene, whatever energy region detected it. A photograph is specifically an image recorded on photographic film. So all photographs are images, but all images are not photographs (NCERT, p. 83).
How many detectors does a pushbroom scanner need, and how is that number calculated?
The number equals the swath divided by the spatial resolution. For SPOT HRV-1: 60 km × 1000 m/km ÷ 20 m = 3000 detectors, each recording one 20 m ground cell (NCERT, p. 76).
What is a False Colour Composite and why does vegetation appear red in it?
An FCC is an artificial colour image that assigns blue, green and red to wavelength regions they do not belong to in nature — standard FCC assigns blue to green radiation, green to red radiation, and red to near-infrared radiation (NCERT, p. 70). Healthy vegetation reflects strongly in the infrared, so it turns bright red in a standard FCC (NCERT, p. 85).
Reference: NCERT Class 11 Practical Work in Geography textbook, chapter 6, official edition on ncert.nic.in.
Explore Class 11 Geography Books
Class 11 Geography on LearnCBSE:
Related chapters:
- Geography as a Discipline
- India – Location
- Introduction to Maps