
If you are revising gene cloning class 12 notes from the NCERT Biotechnology textbook, this page walks you through the entire pipeline of Chapter 3.
Gene cloning is the routine procedure of using a gene for its product: a vector carries a DNA fragment containing the gene of interest into a host cell, so that many identical copies (clones) of the gene become available for characterisation and future use (NCERT, p. 27).
These notes follow the NCERT Class 12 Biotechnology textbook (Chapter 3, Gene Cloning, textbook pages 27–66) for the 2026-27 session, and every section number below matches the book’s — 3.1 through 3.8 — so you can move between this page and the NCERT text without losing your place.
The chapter is one workflow in eight steps: identifying the candidate gene, isolating nucleic acids, using enzymes that cut and join DNA, transferring DNA into hosts, screening and selection, blotting techniques, polymerase chain reaction (PCR), and DNA libraries. Work through the steps in order on a first read; afterwards, any single step can be revised on its own.
Read the pipeline map below first, then use the table of contents to jump to the step you are stuck on.
If you want to verify a figure, table or numbered section against the source, the official NCERT PDF of this chapter (lebt103.pdf) carries the complete text.
Meet gene cloning: one workflow, eight steps
Gene cloning traditionally means transferring a DNA fragment carrying the gene of interest into a host cell by a vector, so that many copies of the gene become available for study and later use, and ultimately for producing its product in industry (NCERT, p. 27). The whole chapter is a single pipeline — each step feeds the next:
- 3.1 Identifying the candidate gene — decide which gene is worth cloning and obtain a clonable copy of it.
- 3.2 Isolating nucleic acids — extract clean DNA or RNA from cells without degrading it.
- 3.3 Enzymes for rDNA technology — cut the vector and insert with restriction enzymes, join them with ligase, and use a supporting enzyme cast.
- 3.4 Modes of DNA transfer — get the recombinant DNA into host cells.
- 3.5 Screening and selection — find the rare host cells that actually carry the gene.
- 3.6 Blotting techniques — prove the gene, its transcript or its protein is present.
- 3.7 Polymerase chain reaction (PCR) — amplify tiny amounts of DNA exponentially.
- 3.8 DNA libraries — store the genome, or the expressed genes of a tissue, as cloned fragments.
Why clone at all? One cell yields an unusably small amount of a gene; cloning gives virtually unlimited copies whose product can be characterised or used (p. 27). The section map below shows where each step sits in the book.
| Section | Topic | Textbook pages |
|---|---|---|
| 3.1 | Identification of candidate gene | 27–28 |
| 3.2 | Isolation of nucleic acids | 28–33 |
| 3.3 | Enzymes used for rDNA technology | 34–39 |
| 3.4 | Modes of DNA transfer | 40–43 |
| 3.5 | Screening and selection | 44–48 |
| 3.6 | Blotting techniques | 48–52 |
| 3.7 | Polymerase chain reaction | 52–58 |
| 3.8 | DNA libraries | 59–62 |
This page sits inside the Class 12 Biotechnology notes collection, which covers every chapter of the same textbook; the wider Class 12 notes hub holds the other subjects.
Step 1 (3.1): identifying the candidate gene
A candidate gene is a gene selected for cloning because of its biomedical, economic or evolutionary significance (p. 27). The textbook’s examples:
- insulin — its deficiency causes diabetes;
- blood clotting factors and milk protein — economically important products;
- salinity tolerance — resistance to environmental stress;
- genes for resistance to infection, in both plants and animals;
- genes that fix metabolic defects such as chlorosis caused by iron deficiency (p. 27–28).
The needle-in-a-haystack problem. The haploid human genome holds about 3.2 billion base pairs, but a typical candidate gene is only 3000–3500 bp — roughly one-millionth of the genome (p. 28). In ratio form:
\[ \frac{3.2 \times 10^9\ \text{bp}}{3.2 \times 10^3\ \text{bp}} = 10^6 \]
Randomly searching that much DNA is unrealistic, so two practical routes are used (p. 28):
- Deduce the DNA sequence of the gene from the known amino acid sequence of its polypeptide.
- Isolate the gene’s mRNA from the specific tissue, synthesise single-stranded cDNA with reverse transcriptase, then convert it into double-stranded cDNA as the clonable candidate.
Watch for route 2 — it returns in the cDNA library section (3.8), where the same cDNA idea stores every gene a tissue expresses.
Step 2 (3.2): isolating DNA and RNA
Every molecular biology experiment starts with clean nucleic acids, and extraction meets two big challenges (p. 28–29):
- Tiny amounts — DNA and RNA are present in far lower quantities than proteins, carbohydrates and lipids;
- Fragility — their enormous length makes them vulnerable to physical stress and chemical attack.
Whatever the organism, extraction follows four steps (p. 29–30):
- Rupture the cell boundary to release the nucleic acids and other cellular molecules;
- Protect the nucleic acids from their own degrading enzymes (DNases and RNases) released at the same time;
- Separate the nucleic acids from other molecules;
- Precipitate and concentrate with ethanol or isopropanol.
Isolating DNA from bacteria, plants and animals
Bacteria are easiest because they have little structure beyond the cell wall and membrane. Lysozyme digests peptidoglycan, the main component of the bacterial wall, and the anionic detergent SDS (sodium dodecyl sulphate) disrupts the lipid bilayer (p. 30).
Plant cells are mechanically ruptured in a blender; the cationic detergent CTAB (cetyl trimethyl ammonium bromide) handles their tough walls and also lyses them (p. 30–31).
CTAB is a classic trap: the solubility of DNA and polysaccharides in CTAB flips with ionic strength (p. 30–31).
| Ionic strength | DNA | Polysaccharides |
|---|---|---|
| Low | Soluble | Insoluble |
| High | Insoluble | Soluble |
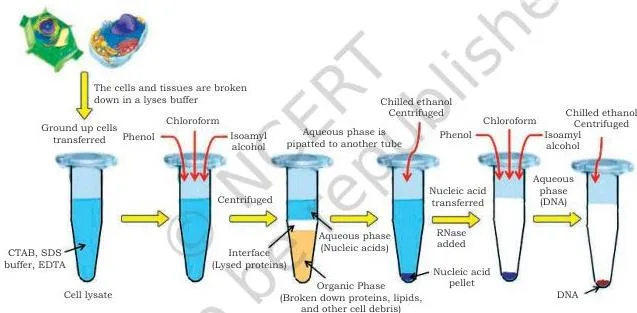
The rest of the plant/animal protocol (p. 30–32): PVP neutralises phenols; the extraction buffer is mild alkaline with minimum ionic strength (≈ 0.05 M) and contains EDTA, which chelates \( \text{Mn}^{2+} \) and \( \text{Mg}^{2+} \) and thereby blocks nucleases; SDS makes proteins anionic so basic histones dissociate from DNA; high NaCl breaks the remaining DNA–protein interactions; chloroform:isoamyl alcohol deproteinises — chloroform denatures proteins while isoamyl alcohol stabilises the interface and stops foaming; ethanol precipitates DNA by reducing the polarity of the aqueous medium; ribonuclease A removes leftover RNA (p. 31–32).
Chloroform also forms a denser lower layer that carries the denatured proteins after centrifugation, leaving the nucleic acids in the upper aqueous phase (p. 31–32).
The flow in Fig. 3.1 packs this into the visual form you can reproduce in an answer: cell lysis releases the nucleic acids together with unwanted proteins and polysaccharides, deproteinisation removes the proteins, precipitation recovers the DNA, and the purified DNA is stored at low temperature. Each arrow in the figure is one of the four extraction steps above (p. 32).
Isolating RNA: fighting the RNase problem
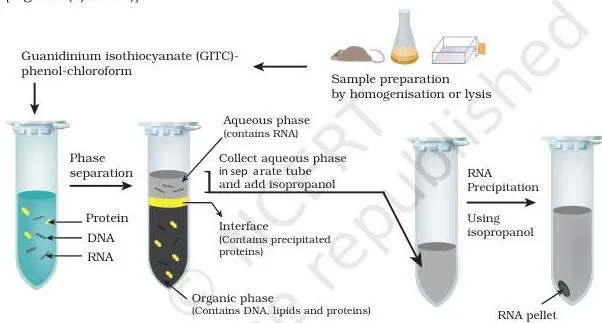
RNA extraction is harder than DNA extraction for two reasons: RNA is single-stranded, and RNases are abundant in the environment, stable, and hard to destroy completely (p. 32). The standard reagent is GITC–phenol–chloroform:
- GITC (guanidinium isothiocyanate) is an acidic chaotropic reagent — it disrupts hydrogen bonds, denatures proteins and inactivates RNases;
- phenol denatures proteins;
- chloroform dissolves lipids and raises the density of the organic phase (p. 32–33).
Centrifugation separates the mixture into three phases. Because the reagent is acidic, RNA stays in the upper aqueous phase while DNA and denatured proteins are held at the interface or in the organic phase; the RNA is then precipitated with isopropanol (p. 32–33).
The book’s Fig. 3.2(a) flow chart gives the stages in order — cell lysis with GITC, DNase/proteinase K treatment, RNase inactivation, chloroform separation, isopropanol precipitation — and the photograph in Fig. 3.2(b) shows the actual extraction.
Separating plasmid DNA from genomic DNA (Box 1, p. 33)
Cloning experiments isolate two kinds of bacterial DNA — plasmid and chromosomal — and the two separate on a property worth memorising: partially denatured plasmid DNA renatures; irreversibly denatured chromosomal DNA does not.
- Boiling method: boiling the lysate irreversibly denatures chromosomal DNA and proteins, which form a gel and precipitate on centrifugation; plasmid DNA is only partially denatured, so it renatures into its circular double helix and stays soluble.
- SDS + NaOH method: lyse and denature with SDS and NaOH, then replace Na⁺ with K⁺; the SDS-coated chromosomal DNA/protein mass precipitates, and plasmid DNA is recovered from the supernatant by ethanol precipitation.
Step 3 (3.3): the enzyme toolkit for cutting and joining DNA
Manipulating DNA means cutting the vector and the gene of interest, then joining them. Every enzyme below exists in nature; rDNA technology borrows it. Study the list in this order: nucleases first, then restriction enzymes (the centrepiece), then ligases, polymerases and the supporting cast.
Nucleases: exonuclease versus endonuclease
Nucleases cleave nucleic acids by hydrolysing the phosphodiester bond that joins the sugar residues of adjacent nucleotides. DNA-specific nucleases are DNases; RNA-specific ones are RNases (p. 34). The two classes differ only in where they cut:
- Exonuclease removes mononucleotides one at a time, from the 3′ or 5′ end of a polynucleotide chain;
- Endonuclease breaks internal phosphodiester bonds (p. 34).
The mnemonic: exo exits from the end; endo enters inside. Fig. 3.3(a) shows an exonuclease working at the end of a DNA molecule, removing nucleotides one at a time; the book’s panel (b), an endonuclease, is not reproduced here.
Restriction enzymes: recognising, cutting, naming
Restriction endonucleases (restriction enzymes, REs) are endonucleases that cleave DNA at specific positions. They occur mostly in bacteria and archaea as a defence against invading bacteriophages: the enzyme recognises and binds a specific recognition sequence, often 4–8 bp long (p. 35).
The three types differ in cofactor needs and in where they cut relative to the recognition site (Table 3.1, p. 35):
| Type | Cleavage site | Cofactors | Endonuclease + methylase | Examples |
|---|---|---|---|---|
| I | ~1000 bp away from recognition site | SAM, \( \text{Mg}^{2+} \), ATP | On a single protein | EcoKI, EcoAI, CfrAI |
| II | Within the recognition site | \( \text{Mg}^{2+} \) only | Separate entities | EcoRI, BamHI, HindIII |
| III | 24–26 bp away from recognition site | SAM, \( \text{Mg}^{2+} \), ATP | On a single protein | EcoPI, HinfIII, EcoPI5I |
The exam-critical line: only Type II enzymes are used in rDNA technology, because they cut predictably inside their own recognition site and need only \( \text{Mg}^{2+} \) (p. 35).
The 1978 Nobel Prize in Physiology or Medicine went to Werner Arber, Daniel Nathans and Hamilton Smith for discovering restriction enzymes and applying them to molecular genetics; HindII was the first restriction enzyme isolated (Box 2, p. 35).
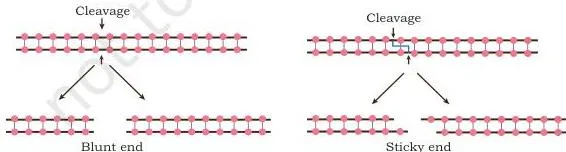
Type II recognition sequences are palindromic: the forward direction of one strand reads the same as the reverse direction of the complementary strand (p. 36). Cleavage generates a 5′-phosphate group at one end of the break and a 3′-hydroxyl at the other.
If the two strands are cut at different points, the staggered cut leaves short single-stranded overhangs called cohesive or sticky ends; if both strands are cut at the same position, the product has blunt ends (p. 36). Fig. 3.4 shows the two outcomes side by side — sticky ends can hydrogen-bond to a complementary overhang, which is what makes later ligation easy.
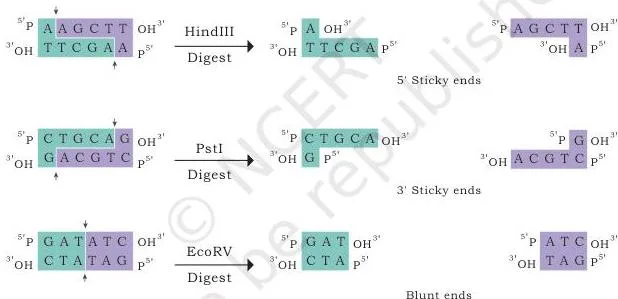
Nomenclature decodes an enzyme’s name (Table 3.2, p. 36–37): genus (first capital letter) + species (next two letters) + strain (following letter) + order of isolation (Roman numeral).
- EcoRI = Escherichia (E) + coli (co) + strain Ry13 (R) + first endonuclease (I);
- HindIII = Haemophilus (H) + influenzae (in) + strain Rd (d) + third endonuclease (III).
Ligases, polymerases and the supporting enzyme cast
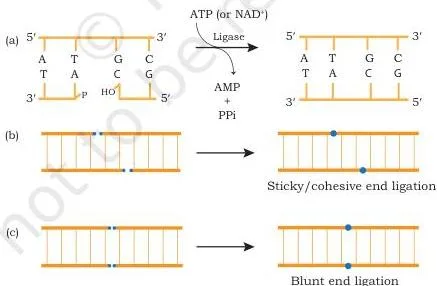
DNA ligase joins DNA strands by catalysing phosphodiester bond formation in duplex DNA — the 5′-phosphate of one chain links covalently to the 3′-hydroxyl of the adjacent chain (p. 37). Two ligases matter:
- E. coli ligase — uses NAD as its energy source; joins cohesive ends;
- T4 ligase — uses ATP; joins sticky ends or blunt ends (p. 37).
Fig. 3.5 shows the three ligation situations in one picture: the phosphodiester bond forming, a sticky-end join, and a blunt-end join.
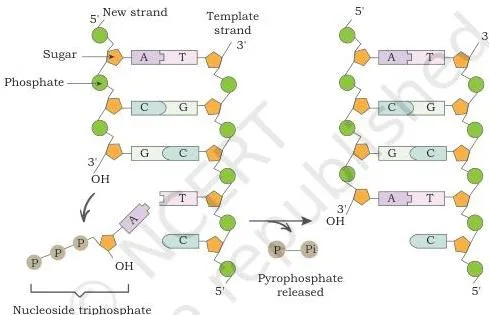
DNA polymerases synthesise a new strand in the \( 5′ \rightarrow 3′ \) direction from dNTPs on a template strand. They cannot start a chain from nothing — they need a primer carrying a free 3′-OH as the starting point of chain growth (p. 38). E. coli DNA polymerase I also carries 5’→3′ and 3’→5′ exonuclease activities.
Fig. 3.6 shows the growing chain: nucleotides are always added at the 3′-OH end of the new strand.
The remaining enzymes are smaller but frequently tested (p. 38–39):
| Enzyme | Action |
|---|---|
| Alkaline phosphatase | Removes the terminal phosphate group from the 5′ end of DNA |
| Polynucleotide kinase | Attaches a phosphate to a free 5′-OH — the reverse of alkaline phosphatase |
| Terminal deoxynucleotidyl transferase | Adds a homopolymer tail to the 3′ end of DNA; needs no template |
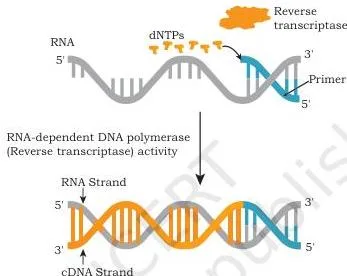
| Reverse transcriptase | RNA-directed DNA polymerase; makes cDNA from an RNA template (reverse transcription) |
| Poly A polymerase | Adds adenine residues to the 3′ end of RNA |
Reverse transcriptase gets its own diagram in Fig. 3.7 because it is the bridge between RNA and DNA — the same enzyme returns in RT-PCR (3.7) and cDNA library construction (3.8): an RNA strand acts as the template and a complementary DNA strand is laid down on it.
One small detail to recognise, not memorise in depth: poly A polymerase is shown in the book’s Fig. 3.8 adding dATPs to the 3′ end of an RNA molecule (p. 39).
Step 4 (3.4): moving foreign DNA into host cells
Getting foreign DNA into a host is a basic step of rDNA technology. Bacteria acquire foreign DNA in nature by three routes — transformation, transduction and conjugation — and laboratories use a separate set of chemical and physical delivery methods (p. 40, 42).
Natural methods: transformation, transduction and conjugation
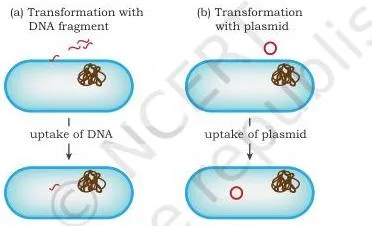
Transformation is the direct uptake of exogenous DNA from the surroundings through the cell membrane and its incorporation into the recipient’s genetic material. The recipient cell is called a transformant, and transformation occurs naturally in some species of bacteria (p. 40). Fig. 3.9 shows free DNA entering a cell and joining its genetic material.
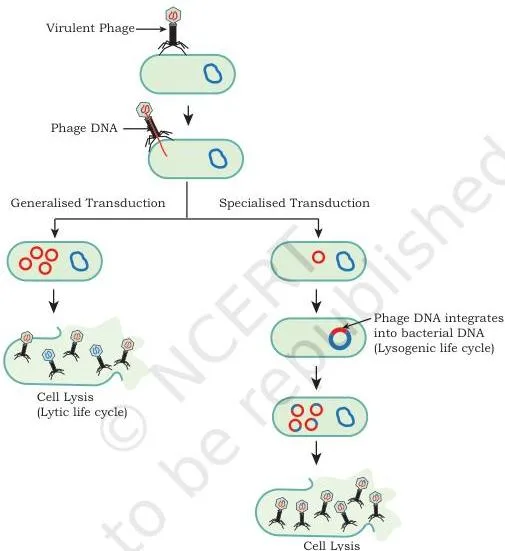
Transduction is bacteriophage-mediated transfer. In the lysogenic life cycle, the phage genome integrates into the bacterial DNA and stays dormant for generations; when it eventually excises, it occasionally takes a small piece of bacterial DNA with it.
That DNA is packaged into phage coats, and when the recombinant phage particle infects a new cell it injects the bacterial DNA into it. The recipient is called a transductant (p. 40–41). Fig. 3.10 traces the phage’s journey between two bacterial cells.
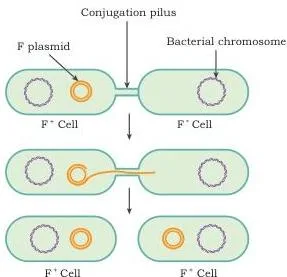
Conjugation is cell-to-cell DNA transfer through direct contact. The F plasmid (F-factor) encodes the fertility factor, which forms a thin tube called a pilus through which the donor contacts the recipient.
The enzyme relaxase nicks one strand of the F plasmid in the donor; that single strand passes through the pilus into the recipient, and inside both cells it is replicated into a double-stranded F plasmid identical to the original (p. 41–42). Fig. 3.11 shows the pilus bridging the two cells with a single DNA strand in transit.
Laboratory delivery: calcium chloride to gene gun
The book’s Fig. 3.12 pictures all five laboratory methods together (p. 42–43); the methods themselves are the revision target:
- Calcium chloride method: the DNA complexes with positively charged calcium ions, and host cells take it up during heat shock (p. 42);
- Electroporation: a mild electric current creates transient micropores in the host membrane through which rDNA enters (p. 42);
- Lipofection: liposomes — phospholipid vesicles — fuse with the cell membrane and deliver their DNA cargo (p. 42);
- Microinjection: a specialised automated apparatus injects DNA directly into the nucleus (p. 42–43);
- Biolistic method (gene gun): microscopic gold, nickel or tungsten particles coated with DNA are bombarded into cells at high velocity (p. 42–43).
| Method | How it works in one line | Natural or laboratory? |
|---|---|---|
| Transformation | Direct uptake of free DNA from the surroundings | Natural (also adapted in labs) |
| Transduction | Bacteriophage carries DNA between bacteria | Natural |
| Conjugation | Pilus transfers a single F-plasmid strand between cells | Natural |
| Calcium chloride | Calcium–DNA complex taken up on heat shock | Laboratory |
| Electroporation | Electric pulses open transient micropores | Laboratory |
| Lipofection | Liposome fuses with the cell membrane | Laboratory |
| Microinjection | DNA injected straight into the nucleus | Laboratory |
| Biolistic (gene gun) | DNA-coated metal particles shot into cells | Laboratory |
A cloning experiment actually delivers rDNA by the chemical/physical methods; transformation, transduction and conjugation are the natural routes the chapter contrasts with them (p. 40, 42).
Step 5 (3.5): screening — finding the rare recombinant
Inserting DNA into a plasmid and getting the plasmid into bacteria rarely works, so the real difficulty of a cloning experiment is picking the few recombinant cells out of a huge population (p. 44).
The guiding principle: recombinants differ from non-recombinants in biological traits — antibiotic resistance, expression of \( \beta \)-galactosidase or GFP, or nutritional dependence such as needing the amino acid leucine (p. 44).
Direct selection with antibiotic resistance
If a host that is not resistant to an antibiotic takes up a plasmid carrying an antibiotic-resistance gene, it becomes resistant. Plated on antibiotic medium, the plasmid-free cells die and the transformants survive and grow (p. 44). The limitation: this proves the cell took up a plasmid, not that the plasmid carries the insert.
Insertional inactivation: the ampR–tetR logic
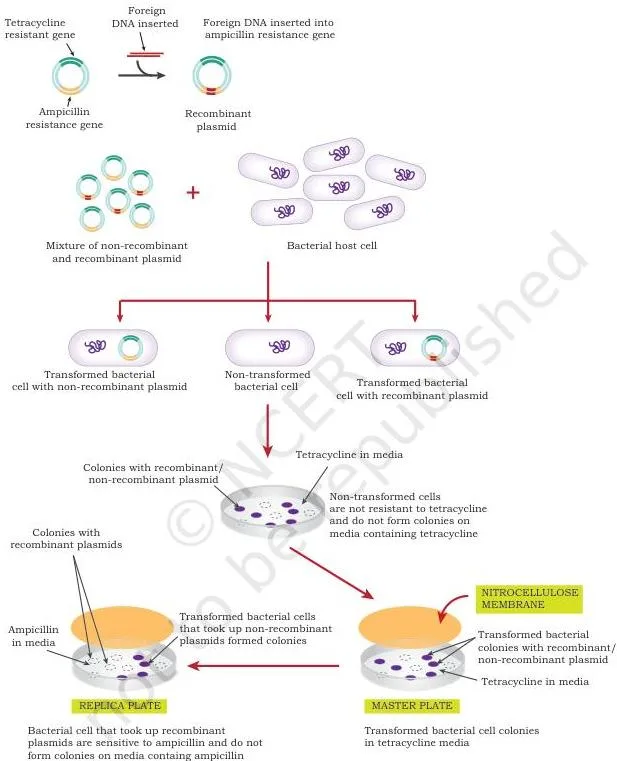
The vector carries two markers — ampicillin resistance (ampR) and tetracycline resistance (tetR) — and the insert is cloned into ampR, disrupting its expression. That disruption is the insertional inactivation (p. 44–45). The screening flow:
- Plate the transformed mixture on tetracycline: non-transformed cells are sensitive and die; both kinds of transformants survive because tetR is functional in both. Two colony types appear on the master plate (p. 45).
- Press a nitrocellulose membrane onto the master plate and use it to replica-plate the colonies onto ampicillin medium.
- Only non-recombinants have an intact ampR, so only they grow on the replica plate (p. 45–46).
- Compare the plates: colonies present on the master but absent on the replica are the recombinants carrying the insert of interest.
Fig. 3.13 lays the comparison out: match the master-plate colony positions against the replica, and the missing colonies are the recombinants.
Blue-white selection: colour tells the story
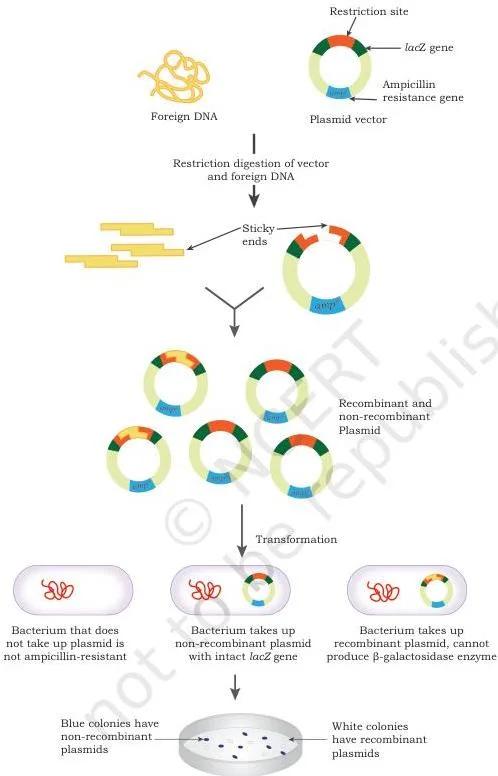
Blue-white selection is insertional inactivation with a visual marker. The vector’s lacZ gene expresses \( \beta \)-galactosidase, which cleaves the colourless chromogenic substrate X-gal (5-bromo-4-chloro-3-indolyl-\( \beta \)-D-galactoside) into 5-bromo-4-chloro-indoxyl; this spontaneously dimerises into the insoluble blue pigment 5,5′-dibromo-4,4′-dichloro-indigo (p. 47–48).
- Insert inside lacZ → \( \beta \)-galactosidase is not produced → X-gal is not cleaved → colony stays white (recombinant).
- Uninterrupted lacZ → enzyme is active → X-gal is hydrolysed → colony turns blue (non-recombinant).
The plates contain ampicillin, X-gal and the inducer IPTG; ampicillin eliminates non-transformed cells, and the surviving colonies are scored by colour (p. 48). Fig. 3.14 shows the blue and white colonies side by side on one plate.
GFP works the same way: an insert that disrupts the GFP coding sequence produces non-fluorescing bacteria (p. 48). The lacZ gene and the plasmid vectors it sits in were introduced in the earlier chapter on vectors — see the Vectors chapter notes if the marker logic feels unfamiliar.
Why two markers? A single antibiotic marker tells you a transformant exists, but it cannot distinguish a recombinant (insert present) from a non-recombinant transformant (empty plasmid). The second marker — revealed by inactivation — is what makes the insert’s presence visible (p. 44–45).
Step 6 (3.6): blotting — proving the clone is present and expressed
All blotting techniques share one principle (p. 48–49): separate the molecules, immobilise them on a support — a nitrocellulose, nylon or PVDF membrane — and detect the target. Nucleic acids are detected by a labelled probe through hybridisation; proteins are detected by a specific antibody. Detection may be chromogenic, fluorescent, chemiluminescent or radioactive.
Southern blot — detects DNA
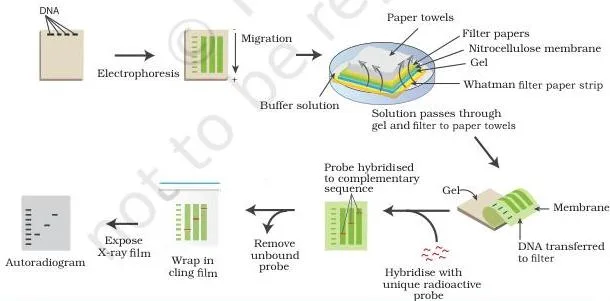
Invented by Edwin Southern, the original blotting technique detects a specific DNA sequence (p. 49). The flow (p. 49–50):
- Cut large DNA into smaller pieces with restriction enzymes;
- Separate the fragments by size on an agarose gel by electrophoresis;
- Transfer the DNA to a nitrocellulose membrane by capillary action — buffer is drawn through the gel by a stack of filter papers/paper towels and a weight;
- Bake the membrane to fix the DNA permanently;
- Hybridise with a labelled probe — a single DNA strand complementary to the target sequence;
- Visualise by autoradiography on X-ray film.
The probe tag can be radioactive, fluorescent or chemical (p. 50). Fig. 3.15 shows the capillary-transfer set-up and the final probe detection: buffer moves upward through gel and membrane, carrying the DNA bands with it.
Northern blot — detects RNA
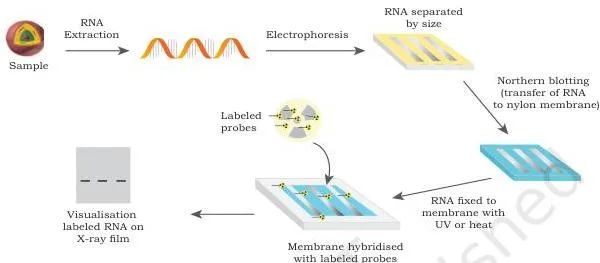
Developed in 1977 by J. Alwine, David Kemp and George Stark, northern blotting detects specific RNA molecules (p. 50). Total RNA is separated by size on an agarose gel, then transferred to a positively charged nylon membrane — negatively charged nucleic acids bind to it well.
The transfer buffer contains formamide, which lowers the probe–RNA annealing temperature so that RNA is not degraded by high heat. RNA is fixed to the membrane by UV light or heat, hybridised with radioactive probes, and detected by autoradiography or fluorescence (p. 50–51). Fig. 3.16 shows RNA bands immobilised on the membrane and picked up by the probe.
Western blot — detects protein
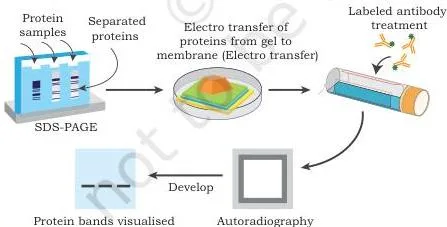
The name was coined by W. Neal Burnette in 1981; the technique detects specific proteins (p. 51). Proteins are separated on an SDS-PAGE gel by their electrophoretic mobility — which depends on charge, size and structure — transferred to a nitrocellulose membrane, and detected with an antibody specific to the protein (p. 51–52). Fig. 3.17 shows the protein bands transferred and probed by the antibody.
Memory device: the three blots run in the order Southern, Northern, Western, and that order matches the central dogma DNA → RNA → protein. This order removes all guesswork: Southern is DNA, Northern is RNA, Western is protein (p. 48–52).
| Blot | Molecule detected | Separation method | Detection tool | Figure |
|---|---|---|---|---|
| Southern | DNA | Agarose gel electrophoresis | Labelled DNA probe (hybridisation) | Fig. 3.15 |
| Northern | RNA | Agarose gel electrophoresis | Radioactive or fluorescent probe | Fig. 3.16 |
| Western | Protein | SDS-PAGE | Specific antibody | Fig. 3.17 |
The Eastern blot is a useful extra detail (Box 3, p. 52): it detects specific post-translational modifications of proteins using substrates such as cholera toxin, concanavalin or phosphomolybdate, or antibodies.
Which blot would you run to check whether a gene is actually expressed in a tissue? Northern — the RNA transcript. The gene’s presence in DNA (Southern) does not prove it is being transcribed (p. 52).
Step 7 (3.7): PCR — exponential DNA amplification
PCR amplifies a very small amount of DNA into thousands to millions of copies. It was developed by Kary B. Mullis, is often called “molecular photocopying”, and earned him the Nobel Prize in Chemistry in 1993 (p. 52).
The three thermal steps of one PCR cycle
PCR needs five things (p. 52–54):
- a thermocycler, which cycles the temperature automatically;
- a heat-stable DNA polymerase — Taq polymerase from the hot-spring bacterium Thermus aquaticus (a human or E. coli polymerase would denature at PCR temperatures), or Pfu polymerase from Pyrococcus furiosus, prized for its higher copying fidelity;
- two synthetic deoxyoligonucleotide primers (forward and reverse), complementary to the sequences flanking the target region;
- the four dNTPs — dATP, dTTP, dCTP and dGTP;
- a small amount of template DNA.
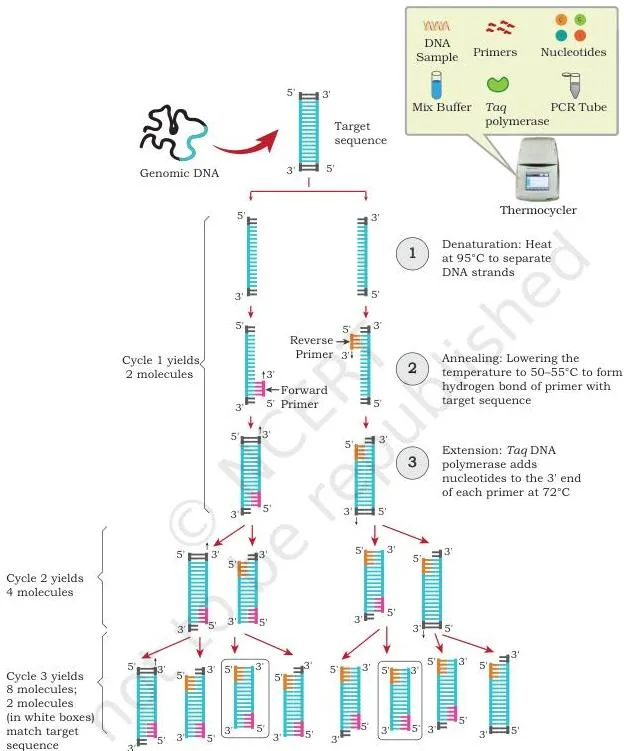
Each cycle has three steps (p. 54):
| Step | Temperature | What happens |
|---|---|---|
| Denaturation | \( 94 \)–\( 95^\circ\text{C} \) | Hydrogen bonds between the two strands break; each strand becomes a template |
| Annealing | \( 50 \)–\( 55^\circ\text{C} \) | Primers bind their complementary sites; the exact temperature depends on primer length and sequence |
| Extension | ~\( 72^\circ\text{C} \) | The heat-stable polymerase adds dNTPs to the primers’ 3′-OH ends, synthesising in the \( 5′ \rightarrow 3′ \) direction |
New strands are called amplicons. The copy number doubles every cycle, so after \( n \) cycles a single template gives \( 2^n \) copies; typical runs use 25–30 cycles (p. 54). Fig. 3.18 shows one full cycle — the two strands separate, primers land, and the polymerase extends them — and the multiplying bands in the figure are the amplicons the next cycle starts from.
At the end of the reaction the product is checked by gel electrophoresis (end-point analysis); the intensity of the band gives a semi-quantitative estimate of the starting DNA (p. 54–55).
PCR variants: RT-PCR and real-time qPCR
RT-PCR (reverse transcription PCR): mRNA is first converted to cDNA by reverse transcriptase, then amplified by PCR. It is used when the starting material is RNA (p. 55). Fig. 3.19 shows the two phases of the reaction — reverse transcription first, then the PCR cycles.
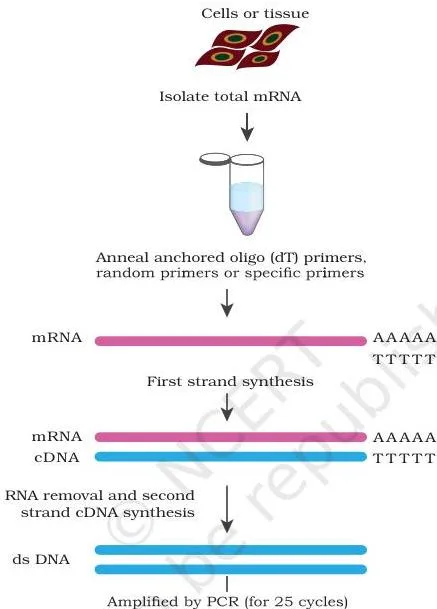
Real-time quantitative PCR (qPCR): fluorescent markers such as SYBR green bind only double-stranded DNA. When bound, they fluoresce, and the fluorescence is proportional to the amount of double-stranded product — measured after every cycle. Because the product is tracked in real time, no gel electrophoresis is needed; the thermocycler simply carries a fluorescence detector (p. 55–56).
The COVID-19 RT-PCR test and the Ct value
SARS-CoV-2 is an enveloped, positive-sense single-stranded RNA virus (≈ 30 kb genome, 38% G+C) whose structural proteins are S (spike), E (envelope), M (membrane) and N (nucleocapsid) (p. 56–57); this is the context for why an RNA-based test works. The rRT-PCR test (Box 5, p. 58) detects SARS-CoV-2 RNA in respiratory specimens such as sputum and broncho-alveolar lavage:
- Primers and probes target the ORF1a/b, N and S regions of the viral genome, plus human RNase P as a control;
- Viral RNA is converted to cDNA by reverse transcription, then amplified in a real-time thermal cycler;
- Each probe carries a reporter dye at its 5′ end and a quencher at its 3′ end — while the probe is intact, the quencher absorbs the reporter’s fluorescence;
- During amplification, the Taq polymerase’s 5’→3′ exonuclease activity cleaves the bound probe, separating reporter from quencher and generating a measurable fluorescent signal.
The Ct (threshold cycle) value is the cycle number at which the fluorescence generated in a reaction crosses the background threshold — the number of cycles needed to amplify viral RNA to a detectable level. It is inversely proportional to the starting amount of viral RNA: a low Ct means more virus was present in the sample (p. 58).
PCR’s practical uses — quantifying mRNA to assess gene expression, and amplifying minute DNA samples from crime scenes or fossils (p. 56) — feed directly into the applications of recombinant DNA technology notes.
Step 8 (3.8): DNA libraries — genomic and cDNA
Genomes are enormous — the book estimates a DNA molecule in a diploid cell at around \( 3 \times 10^9 \) bp (p. 59) — and gene sequences sit scattered through them. Only a small portion of the genome is ever transcribed.
So when a gene’s location and sequence are unknown, the practical move is to clone random fragments into vectors; any fragment can later be identified and isolated for study (p. 59). That collection of clones is a DNA library.
Genomic library: a snapshot of the whole genome
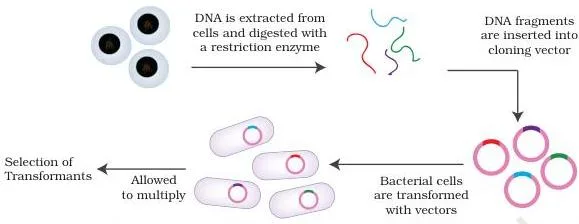
A genomic library is a collection of clones of small DNA fragments that together represent the complete genome of an organism (p. 59). Construction (p. 59–60):
- Isolate genomic DNA from the source;
- Digest it with a restriction enzyme into fragments of usable size;
- Ligate the fragments into vectors using DNA ligase to form recombinant vectors;
- Transform host bacteria and let them multiply into colonies on nutrient medium;
- All host cells carrying recombinant vectors together form the library.
Fig. 3.20 runs the whole flow in one diagram: genomic DNA is cut into fragments, each fragment is inserted into a vector, and transformed bacteria multiply into the colonies that hold the library.
Applications (p. 60): complete genome sequencing; searching for genes that are never expressed; understanding species evolution; and comparing the sequences of healthy and diseased tissue of the same organism to identify genetic aberrations.
cDNA library: a snapshot of what a tissue expresses
Gene expression in higher eukaryotes is tissue-specific: insulin genes are expressed only in the beta cells of the pancreas, and albumin genes only in liver cells (p. 60). That specificity is the whole point of a cDNA library — isolate mRNA from a chosen tissue and you are collecting the genes that tissue actually expresses.
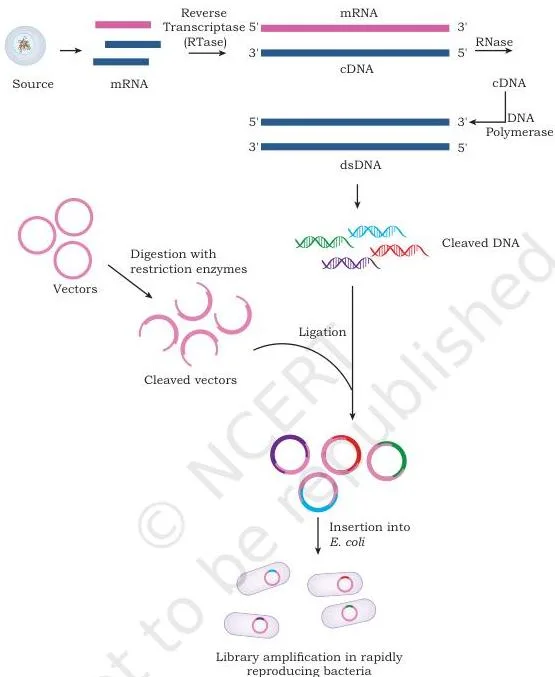
Construction (p. 60–62):
- Isolate total mRNA from the tissue of interest;
- Use reverse transcriptase to synthesise a complementary DNA strand on the mRNA template;
- Remove the mRNA with RNase;
- Convert the single-stranded cDNA to double-stranded cDNA with DNA polymerase;
- Clone the cDNA into a suitable host–vector system.
Fig. 3.21 flows from tissue mRNA to cloned cDNA: reverse transcription, removal of the RNA strand, second-strand synthesis by DNA polymerase, and cloning into host cells that multiply into colonies.
Why is the cDNA step compulsory? mRNA is single-stranded, cannot be cloned as such, and is not a substrate for DNA ligase — so it must be converted into double-stranded cDNA first (p. 60–61).
Applications: identifying which genes are active in a particular tissue under a particular physiological state, isolating specific genes, and using cDNA clones as probes to screen genomic libraries (p. 62).
The two libraries answer different questions — the comparison below is the revision summary of this section.
| Feature | Genomic library | cDNA library |
|---|---|---|
| What it represents | The complete genome, including untranscribed regions | Only the genes expressed in a specific tissue or physiological state |
| Source | Genomic DNA | mRNA isolated from a tissue |
| Construction | Random restriction fragments ligated into vectors | Reverse transcription of mRNA into cDNA, then cloning |
| Tissue dependence | No — the same for every tissue | Yes — libraries vary with cell type and physiological state (p. 62) |
| Typical uses | Genome sequencing; finding unexpressed genes; studying evolution | Expression studies; isolating specific genes; probes for genomic libraries |
Key terms at a glance: definitions you must know
One line per term, in the language you would write in an answer. Enzyme names and their actions live in the Step 3 table; these are the rest of the chapter’s vocabulary.
| Term | Meaning | Page |
|---|---|---|
| Gene cloning | Using a vector to carry a DNA fragment with a gene of interest into a host so many identical copies are produced | 27 |
| Candidate gene | A gene shortlisted for cloning for biomedical, economic or evolutionary significance | 27 |
| Vector | The DNA molecule (e.g. a plasmid) that carries the foreign DNA into the host | 27 |
| rDNA molecule | Vector DNA joined to the gene of interest | 27 |
| Transformant | Recipient cell that took up exogenous DNA by transformation | 40 |
| Transductant | Recipient cell that received DNA carried by a bacteriophage | 41 |
| Recognition sequence | The specific DNA sequence, often 4–8 bp, that a restriction enzyme recognises and binds | 35 |
| Palindromic sequence | Reads the same forward on one strand and reverse on the complementary strand | 36 |
| Cohesive (sticky) ends | Short single-stranded overhangs left by staggered cuts | 36 |
| Blunt ends | Flush ends produced when both strands are cut at the same position | 36 |
| cDNA | Complementary DNA synthesised from an RNA template by reverse transcriptase | 39, 60 |
| Probe | Labelled single-stranded DNA complementary to the sequence being sought | 49–50 |
| Insertional inactivation | Disrupting a marker gene’s expression by inserting foreign DNA inside it | 44 |
| lacZ gene | The \( \beta \)-galactosidase gene used as a visual marker in blue-white screening | 47 |
| Amplicon | A DNA copy produced by PCR, identical to the target region between the two primers | 54 |
| Thermocycler | Automated machine that cycles the three PCR temperatures | 52 |
| Taq polymerase | Heat-stable DNA polymerase from Thermus aquaticus used in PCR | 52 |
| Genomic library | Clones of small DNA fragments that together represent the complete genome | 59 |
| cDNA library | cDNA clones of all genes expressed in a specific cell type or tissue | 60 |
The numbers in this chapter: formulas and values to remember
PCR’s \( 2^n \) doubling is the chapter’s only true equation. The other numbers are comparison values designed to show why cloning needs special tools — memorise them as one block.
- PCR copy number: after \( n \) cycles, one template gives \( 2^n \) copies; typical runs use 25–30 cycles (p. 54).
- Haploid human genome: ≈ \( 3.2 \times 10^9 \) bp — one set of chromosomes, as in gametes (p. 28).
- Diploid human genome: \( 6.4 \times 10^9 \) bp — two sets of chromosomes, as in body cells (Exercise 16, p. 66). Note that p. 59 loosely rounds a diploid cell’s DNA to ≈ \( 3 \times 10^9 \) bp, so in an answer state clearly which genome (haploid or diploid) the question means.
- Typical candidate gene: 3000–3500 bp — about one-millionth of the human genome (p. 28).
- Recognition sequences: 4–8 bp long (p. 35).
- Cut-site distances: Type I ≈ 1000 bp away; Type III 24–26 bp away; Type II within the site (Table 3.1, p. 35).
- PCR temperatures: denaturation \( 94 \)–\( 95^\circ\text{C} \); annealing \( 50 \)–\( 55^\circ\text{C} \); extension ~\( 72^\circ\text{C} \) (p. 53–54).
- Extraction buffer: minimum ionic strength ≈ 0.05 M (p. 31).
Worked examples: gene cloning in action
Example 1: Exponential amplification by PCR
Method: exponential amplification by PCR.
Step 1: A forensic lab starts with 6 copies of a 210 bp target and runs 30 PCR cycles.
Copies after \( n \) cycles = starting copies \( \times 2^n \).
\[ \text{copies} = 6 \times 2^{30} \]
Step 2: Evaluate the power.
\( 2^{30} = 1.07 \times 10^9 \) (each cycle doubles the previous total).
\[ 6 \times 2^{30} = 6 \times 1.07 \times 10^9 = 6.44 \times 10^9\ \text{copies} \]
Step 3: Each amplicon is still 210 bp — PCR copies only the region flanked by the two primers, so product size never grows with cycle number.
Final answer: about \( 6.44 \times 10^9 \) copies (≈ 6.4 billion) after 30 cycles.
Mini-case: starting with 4 copies, how many cycles are needed to pass a million?
Set up the inequality \( 4 \times 2^n \gt 10^6 \).
\[ 2^n \gt \frac{10^6}{4} = 2.5 \times 10^5 \]
Step 2: Compare powers: \( 2^{17} = 131,072 \) and \( 2^{18} = 262,144 \).
Since \( 2^{18} \gt 2.5 \times 10^5 \), 18 cycles cross the million.
\[ 4 \times 2^{18} = 4 \times 262,144 = 1.05 \times 10^6 \]
Final answer: 18 cycles (after 17 cycles the count is only 524,288, still below a million).
This is why labs run 25–30 cycles: a vanishingly small forensic or fossil sample becomes a usable quantity (p. 54).
Example 2: Estimating search difficulty — the haystack problem
Method: calculating the fraction of the genome occupied by a single gene.
Step 1: A candidate gene is 3,400 bp long and the haploid human genome is \( 3.2 \times 10^9 \) bp (p. 28).
Write the gene as a fraction of the genome.
\[ \frac{3400}{3.2 \times 10^9} = 1.06 \times 10^{-6} \]
Step 2: Convert to everyday terms.
\( 1.06 \times 10^{-6} \) is about one part per million — exactly the “needle in a haystack” scale the textbook states (one-millionth of the genome, p. 28).
\[ 1.06 \times 10^{-6} \times 100 = 0.000106\% \]
Conclusion: random searching is impractical, so the mRNA → cDNA route exists: isolate the gene’s mRNA, copy it to cDNA with reverse transcriptase, and clone the cDNA (p. 28).
Example 3: Insertional inactivation with the insert in tetR instead of ampR
Method: predicting master-plate and replica-plate outcomes when the insert flips to the other marker.
The textbook’s scenario inserts the target into ampR (p. 45). This example asks the opposite: the target is inserted into tetR, leaving ampR intact. Predict the plates.
Step 1 — master plate on ampicillin: non-transformed cells carry no resistance and die.
Both recombinant cells (ampR intact, tetR disrupted) and non-recombinant cells (both markers intact) survive, so two colony types appear.
Step 2 — replica plate on tetracycline: non-recombinants have a functional tetR and grow; recombinants have tetR inactivated by the insert and do not grow.
Step 3 — compare the plates: recombinants are the colonies present on the ampicillin master plate but absent on the tetracycline replica — the mirror image of the textbook scenario (p. 45–46).
| Cell population | Ampicillin master plate | Tetracycline replica plate |
|---|---|---|
| Non-transformed | Dies | Dies |
| Transformant, plasmid without insert (both markers intact) | Grows | Grows |
| Transformant, insert in tetR (ampR intact) | Grows | Does not grow |
Common mistakes students make (and the corrections)
| Students write… | Correct idea | Why / how to check |
|---|---|---|
| Exonuclease cuts DNA from inside | Exonuclease removes mononucleotides one at a time from the 3′ or 5′ end; endonuclease cuts internal bonds | Exo exits from the end, endo enters inside (p. 34) |
| EcoRI is a Type I restriction enzyme | EcoRI is Type II — it cuts within its recognition site and is the rDNA workhorse | Exercise 17’s incorrect pair; Type II is the only group used in rDNA (p. 35, 66) |
| PstI comes from Pyrococcus stuartii | That matched pair is the wrong one in the exercise; PstI is named from Providencia stuartii — apply the nomenclature rule (genus + species + strain + order) instead of guessing | Table 3.2, p. 36–37; Q11, p. 65 |
| In blue-white selection the recombinant colony is blue | Recombinants are white — the insert disrupts lacZ, so \( \beta \)-galactosidase is not made and X-gal is not cleaved | Non-recombinants hydrolyse X-gal and turn blue; white = insert present (p. 47–48) |
| Northern blot detects DNA | Southern = DNA, Northern = RNA, Western = protein | The blot order Southern, Northern, Western matches the central dogma (p. 48–52) |
| Taq polymerase comes from E. coli or humans | Taq is from the hot-spring bacterium Thermus aquaticus; Pfu is from Pyrococcus furiosus with higher fidelity | PCR extension runs at ~\( 72^\circ\text{C} \), which denatures ordinary polymerases (p. 52–53) |
| All three restriction enzyme types are used in rDNA technology | Only Type II, because it cuts within its recognition sequence | Types I and III cut ~1000 bp and 24–26 bp away from the site (p. 35) |
| Genomic and cDNA libraries contain the same DNA | Genomic = whole genome including untranscribed regions; cDNA = only genes expressed in a particular tissue or state | cDNA libraries vary with cell type and physiological state; genomic ones do not (p. 59–62) |
| Blunt ends cannot be ligated | Blunt ends ligate too — T4 ligase joins blunt ends, while E. coli ligase joins cohesive ends | Enzyme table, p. 37 |
| Alkaline phosphatase adds a phosphate to the 5′ end | Alkaline phosphatase removes the terminal 5′-phosphate; polynucleotide kinase does the reverse | The two are opposites (p. 38) |
| The diploid human genome is \( 3.2 \times 10^9 \) bp | \( 3.2 \times 10^9 \) bp is the haploid value; the diploid value is \( 6.4 \times 10^9 \) bp | Diploid = two chromosome sets, so double the haploid number (p. 28, 66) |
| At high ionic strength DNA is soluble in CTAB | At low ionic strength DNA is soluble and polysaccharides are not; at high ionic strength the pattern flips | Differential affinity to CTAB, p. 30–31 |
Exam notes: writing answers to this chapter’s question types
These are answer skeletons, not finished answers. The chapter’s exercises (p. 64–66) fall into five types; match your answer structure to the type.
“Describe in detail” questions (Q1, Q4, Q7, Q12, Q14)
Use one skeleton for all of them: definition → principle → numbered steps → one line of significance. For PCR, that skeleton expands to: name and inventor, principle (exponential copying from a tiny template), requirements (Taq polymerase, two primers, dNTPs, thermocycler), the three thermal steps with their temperatures, then applications. Filling this skeleton with the chapter’s facts produces a complete answer.
“Differentiate / comparative account” questions (Q13, Q15)
Answer in a table: one row per feature (target molecule or content, source, method of separation, detection tool, purpose), then one closing sentence of significance — e.g. what the comparison tells you about how a gene is traced from DNA to protein (Q13) or what a tissue’s expression profile reveals (Q15).
“Identify the matched pair” questions (Q10, Q11, Q17)
These are memory items. Know this set cold:
| Pair to recognise | Correct match |
|---|---|
| Taq polymerase | Thermus aquaticus (p. 52) |
| Pfu polymerase | Pyrococcus furiosus (p. 54) |
| HindIII | Haemophilus influenzae (p. 37) |
| PstI | Not Pyrococcus stuartii — apply the nomenclature rule (Q11, p. 65) |
| Southern / Northern / Western | DNA / RNA / protein (p. 48–52) |
| EcoRI | Type II restriction enzyme, not Type I (Q17, p. 66) |
Assertion-reason questions (Q18, Q19)
Test each statement independently before checking the link: is the assertion true? is the reason true? then ask whether the reason actually explains the assertion. The most common trap is choosing (a) when both statements are true but the reason does not explain the assertion — that case is (b).
For Q18 both statements are true, yet Taq polymerase alone is not what lets PCR amplify tiny samples — the cyclic thermal profile is — so the statements are not linked as explanation.
Diagram-based answers
For screening questions, reproduce the logic of Fig. 3.13 (master plate vs replica plate, noting which colonies match) or Fig. 3.14 (blue vs white colonies). For PCR questions, sketch Fig. 3.18 and label the three temperatures.
Definitions in answers should stay close to the textbook’s own phrasing — for example, a genomic library is “a collection of clones of small fragments of DNA that together represents the complete genome” (p. 59).
The chapter summary on pages 62–64 is the textbook’s own revision list, and it pairs section by section with this page — use the two together when you revise. For the wider picture, the Class 12 Biotechnology notes hub links every chapter of the book.
One-page revision recap
This is the whole chapter on one screen, built from the textbook’s own summary (p. 62–64).
| Stage | What happens in one line | Three key terms to write | Pages |
|---|---|---|---|
| Identification | Shortlist a gene by biomedical or economic significance and obtain a clonable copy | candidate gene, cDNA, reverse transcriptase | 27–28 |
| Isolation | Lyse cells, protect from nucleases, separate, precipitate | lysozyme, SDS, CTAB, GITC | 28–33 |
| Enzymes | Cut with Type II restriction enzymes, join with ligase | sticky/blunt ends, palindromic sequence, EcoRI | 34–39 |
| Transfer | Deliver rDNA by natural or laboratory methods | transformant, transductant, electroporation | 40–43 |
| Screening | Pick the rare recombinant from a huge population | insertional inactivation, blue-white selection, lacZ | 44–48 |
| Blotting | Identify DNA, RNA or protein on a membrane | Southern, Northern, Western, probe | 48–52 |
| PCR | Amplify a DNA stretch exponentially | denaturation, annealing, extension, Taq, \( 2^n \) | 52–58 |
| DNA libraries | Store the genome or the expressed genes of a tissue | genomic library, cDNA library, tissue-specific expression | 59–62 |
Revise these facts first.
- The four extraction steps: rupture, protect, separate, precipitate;
- Only Type II restriction enzymes are used in rDNA technology;
- Staggered cuts give sticky ends; same-position cuts give blunt ends;
- Insertional inactivation needs two markers to distinguish recombinants from transformants;
- The three blots run in central-dogma order — DNA, RNA, protein;
- PCR copies double each cycle (\( 2^n \)), typically over 25–30 cycles;
- RT-PCR starts from RNA through reverse transcriptase, then amplifies by PCR;
- A cDNA library varies with tissue and physiological state; a genomic library does not.
Frequently asked questions about gene cloning
Why is Type II restriction enzyme used in rDNA technology and not Type I or III?
Type II enzymes cut within their own recognition site and need only \( \text{Mg}^{2+} \), so the cut position is predictable and precise. Types I and III cleave roughly 1000 bp and 24–26 bp away from the recognition site and demand extra cofactors (SAM and ATP), which makes them unusable for controlled rDNA construction (p. 35).
Why are recombinant colonies white in blue-white selection?
The insert is cloned inside the lacZ gene, so \( \beta \)-galactosidase is not produced, X-gal is not cleaved, and no blue pigment forms — the colony stays white. Non-recombinants keep an intact lacZ, hydrolyse X-gal and appear blue (p. 47–48).
What is the difference between a genomic library and a cDNA library?
A genomic library represents the complete genome, including untranscribed regions, built from random restriction fragments of genomic DNA. A cDNA library represents only the genes expressed in a specific tissue or physiological state, built from mRNA through reverse transcriptase (p. 59–62).
Why does PCR need a heat-stable polymerase like Taq?
The extension step runs at about \( 72^\circ\text{C} \), a temperature that denatures ordinary human or E. coli polymerases. Taq polymerase, from the hot-spring bacterium Thermus aquaticus, survives and stays active at that heat, so the enzyme does not need to be replaced each cycle (p. 52–53).
What is the difference between PCR and RT-PCR?
Conventional PCR copies DNA directly. RT-PCR first converts RNA to cDNA using reverse transcriptase and then amplifies it by PCR — which is why it is used to study gene expression and to detect RNA viruses (p. 54–55, 58).
What does the Ct value mean in a COVID-19 RT-PCR test?
The Ct (threshold cycle) value is the cycle number at which the fluorescence signal crosses the background threshold — the cycles needed to amplify viral RNA to a detectable level. It is inversely proportional to the starting amount of viral RNA, so a low Ct means more virus was present in the sample (p. 58).
If you are revising several chapters together, start from the full library of CBSE notes and narrow down by class and subject.
Reference: NCERT Class 12 Biotechnology textbook, chapter Gene Cloning.
Explore Class 12 Biotechnology Notes
- Class 12 Biotechnology Notes
- Class 12 CBSE Notes
- CBSE Notes for Classes 1 to 12
- Previous: Host–Vector System
- Next: Applications of Recombinant DNA Technology
Class 12 Biotechnology on LearnCBSE:
Related chapters:
- Recombinant DNA Technology notes
- Genome Engineering notes
- Plant Tissue Culture notes