
These human capital formation in India class 11 notes compress Chapter 4 of the NCERT Indian Economic Development textbook into a revision-ready format, following the 2026-27 rationalised NCERT session. You get the meaning of human capital, its five sources, the core comparisons, why the government must intervene, and India’s education expenditure and attainment data — everything needed for a confident revision pass.
The page also carries three worked data examples with original numbers, a common-mistakes table, an answer-writing map for all 20 textbook exercises, and a one-page final recap. Every fact here comes from the NCERT chapter — open the official chapter PDF on the NCERT website if you want to verify any table or figure against the original text.
This page sits inside three collections you can jump between: the Class 11 Economics notes, the wider Class 11 notes library, and the complete CBSE notes index.
Chapter 4 at a Glance: The Ideas You Must Revise
The chapter builds one argument: invest in people and the economy grows. This table maps that argument so you always know where you are in it.
| Chapter idea | What it says | Textbook page |
|---|---|---|
| What human capital is | Skills and productive knowledge embodied in people, built by deliberate investment | pp. 58-60 |
| Five sources of formation | Education, health, on-the-job training, migration, information | pp. 60-61 |
| Physical vs human capital | Six differences: tangibility, separability, mobility, depreciation and more | pp. 62-63 |
| Human capital and economic growth | A two-way link whose evidence is “nebulous” | pp. 63-66 |
| Human capital vs human development | Means versus ends: productivity versus well-being | pp. 66-67 |
| Need for government intervention | External benefits, poor consumer information, poverty, citizens’ rights | pp. 67-68 |
| Education expenditure | Two ratios; 7.92 to 16.54 per cent of government spending; 0.64 to 4.47 per cent of GDP | pp. 68-69 |
| Educational attainment and gaps | Literacy up, yet illiterates about equal to India’s population at independence | pp. 70-71 |
| Conclusion | Rich technical manpower; improve its quality and use it in India | p. 71 |
The Core Idea: Turning People into an Asset
Human capital is the stock of skills and productive knowledge embodied in people, created by deliberate investment rather than inherited (NCERT, p. 60). The chapter’s opening claim: the labour skill of an educated person is greater than that of an uneducated person, so the educated person earns more income and contributes more to economic growth (NCERT, p. 59).
Education also delivers benefits that are not income:
- better social standing and pride;
- better choices in life;
- knowledge to understand changes in society;
- stimulation of innovation;
- an educated labour force that absorbs new technologies.
There is a recursive twist: to produce human capital you first need human capital. Professors and professionals must themselves be educated and trained before they can train others (NCERT, p. 60).
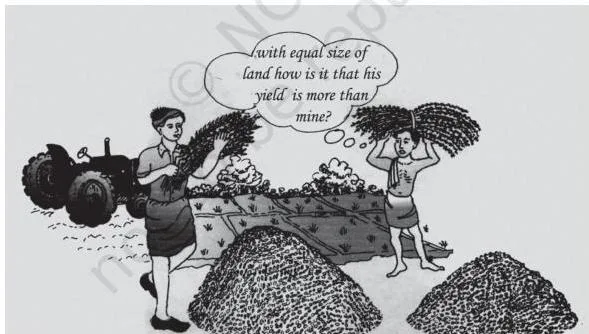
Figure 4.1 opens the chapter with the proof: farmers given adequate education and training can raise productivity in farms (NCERT, p. 59). Training people is productive investment, not charity — the same logic applies on the farm, in the factory and in the office. The rural side of this story continues in our Class 11 Rural Development notes.
The Five Sources of Human Capital Formation
Five investments build human capital: education, health, on-the-job training, migration and information (NCERT, pp. 60-61).
Memory device: “Every Healthy Mind Invests in Training” — Education, Health, Migration, Information, on-the-job Training.
| Source | What it includes | Why it counts as investment |
|---|---|---|
| Education | Schooling and higher education | Raises future income, just as firms buy capital goods to raise future profits (p. 60) |
| Health | Preventive medicine (vaccination), curative medicine, social medicine (health literacy), clean water and sanitation | Keeps the labour supply healthy; a sick worker loses productivity (pp. 60-61) |
| On-the-job training | In-firm training under a skilled worker, or off-campus training | Enhanced productivity returns more than the training costs; firms bind workers for a fixed period to recover it (p. 61) |
| Migration | Rural-urban moves for jobs; international moves of engineers and doctors | Higher earnings outweigh transport cost, higher living cost and the psychic cost of a strange socio-cultural setup (p. 61) |
| Information | Labour-market, education and health information | Needed to decide where to invest in human capital and to use the acquired stock efficiently (p. 61) |
All five are costs people and firms bear today for higher returns tomorrow — that is what makes each one an investment. Continued investment is needed because human capital depreciates with ageing; education and health spending slows that depreciation (NCERT, p. 62).
The “Work This Out” activity (p. 60) asks you to compare how a very poor, a middle-class and an affluent family split expenditure on the education of male and female children — a reminder that the sources of human capital appear in everyday family budgets.
Key Definitions: The Terms You Must Know
The short questions of this chapter run on these terms. Meanings are in original words; examples are the chapter’s own or direct extensions of it.
| Term | Meaning | Example |
|---|---|---|
| Human capital (p. 60) | The stock of skills and productive knowledge embodied in people, built by deliberate investment | A trained doctor or engineer |
| Human capital formation (pp. 60-61) | The outcome of investments in education, health, on-the-job training, migration and information | A student turned into an engineer |
| Physical capital (p. 62) | Tangible capital sold in the market, separable from its owner | A bus, a machine, a factory building |
| On-the-job training (p. 61) | Training firms give workers, in-firm or off-campus, to raise productivity | Apprenticeship under a skilled worker |
| External benefit (p. 62) | A benefit of human capital that flows to society, not only the owner | An educated citizen strengthens democracy |
| Human development (p. 66) | The view that education and health are integral to well-being; people are ends in themselves | Literacy as a right, not a productivity tool |
| Knowledge economy (p. 66) | An economy whose growth rests on knowledge-based production, powered by information technology | India’s IT-services vision in Box 4.2 |
| Social medicine (p. 61) | The spread of health literacy among the people | Public campaigns on hygiene and sanitation |
| Education cess (p. 69) | A 2 per cent levy on all Union taxes, earmarked for elementary education | The fund that finances elementary schooling |
These definitions feed directly into the chapter’s short questions — Q1 (the two major sources: education and health), Q2 (indicators of achievement) and Q6 (factors of formation).
Physical Capital vs Human Capital: Six Differences
Box 4.1 is the chapter’s most reliable contrast. Both capitals are outcomes of conscious investment, but they differ on six dimensions (NCERT, pp. 62-63).
| Dimension | Physical capital | Human capital |
|---|---|---|
| Basis of decision | Conscious, based on the entrepreneur’s knowledge; mainly an economic and technical process | Partly a social process — parents, peers, educators and society influence it |
| Tangibility | Tangible; sold in the market like any commodity | Intangible; built in the body and mind; never sold — only its services are sold |
| Separability | Separable from its owner — the bus owner need not be present | Inseparable — the bus-driver must be present when the bus is used |
| Mobility | Mobile across countries except for artificial trade restrictions; can be built even through imports | Restricted by nationality and culture |
| Depreciation | Wears with use; becomes obsolete when technology changes | Ages, but continued education and health investment slows it and helps cope with new technology |
| Benefits | Private benefit only | Private plus external social benefit (a healthy person checks contagion; an educated person strengthens democracy) |
The one-line conclusion to memorise: physical capital formation is mainly an economic and technical process, while human capital formation is partly a social process that needs conscious policy (NCERT, p. 62).
Human Capital and Economic Growth: The Two-Way Link
The mechanism: educated and healthy workers raise labour productivity, stimulate innovation and absorb new technologies — which together raise real national income (NCERT, pp. 63-64).
Misconception autopsy — “the data proves education causes growth” is wrong. The chapter’s own word for the evidence is “nebulous” (NCERT, p. 64). The indicators mis-measure: years of schooling, teacher-pupil ratio and enrolment rates do not capture the quality of education; health spending, life expectancy and mortality rates do not capture true health status.
Table 4.1 (p. 65) shows the puzzle: human capital indicators converge between developing and developed countries while per-capita real income does not. Causality, the chapter argues, flows in both directions — higher income builds human capital, and higher human capital raises income.
The Seventh Five Year Plan made the policy point: human resource development had to be assigned a key role, because a large population, trained and educated on sound lines, can itself become an asset in accelerating economic growth (NCERT, p. 64).
The National Education Policy 2020 extends the argument to the future: with the rise of big data, machine learning and artificial intelligence, many unskilled jobs will be taken over by machines, while skilled multidisciplinary labour — mathematics, computer science, data science, the sciences, humanities and arts — will be in greater demand (NCERT, p. 65).
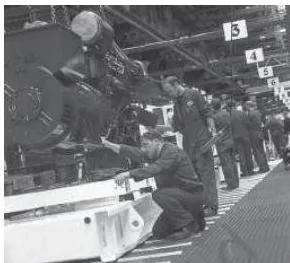
Figure 4.3 names the second ingredient: scientific and technical manpower is itself a rich ingredient of human capital, and India counts a strong stock of it (NCERT, p. 64).
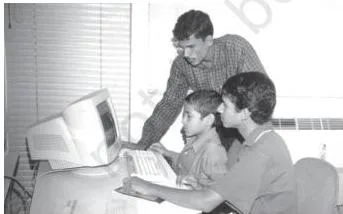
Figure 4.4, “Job on hand”, pictures the policy destination: transforming India into a knowledge economy (NCERT, p. 65). Box 4.2 then poses the discussion question: will IT-based rural services lead to human development? (NCERT, p. 66).
For how India’s policy framework changed around such growth ambitions — the market reforms that began in the early 1990s — see our notes on Liberalisation, Privatisation and Globalisation: An Appraisal.
Human Capital vs Human Development: Means vs Ends
The master key is ends versus means. Human capital treats education and health as means to raise labour productivity — human beings are a means to an end, and any education or health investment that does not raise output is called unproductive.
Human development treats education and health as integral to well-being — human beings are ends in themselves, and welfare gains count even when productivity does not rise (NCERT, p. 66).
| View | View of people | Test of a productive investment | Status of basic education and health |
|---|---|---|---|
| Human capital | Means to an end (higher productivity) | Does it raise the output of goods and services? | Funded for their productivity effect |
| Human development | Ends in themselves | Does it improve well-being? | A right of every person, even without any productivity gain |
Consequence to memorise: in the human development view, every individual has a right to basic education and basic health care — a right to be literate and lead a healthy life. The human capital view would not automatically fund them where the output gain is absent.
The “Work This Out” prompt (p. 66) applies the idea: trace how a worker who stays absent for long due to ill health loses job security and wages — the human cost the productivity view measures only indirectly.
Why Government Intervention Is Essential in Education and Health
Four reasons, all on NCERT pp. 67-68:
- External benefits: education and health create private and social benefits, which is why private and public institutions both exist.
- Long-term, hard-to-reverse effects: a child placed in a bad school suffers damage before a shift decision can be made.
- Information problems: consumers do not know the quality and cost of services, so providers acquire monopoly power and exploit clients — the government must enforce standards and correct prices.
- Poverty and rights: a large section of the population lives below the poverty line and cannot afford basic services; where basic education and health are citizens’ rights, the state must provide them free to the deserving and the socially oppressed.
India is a federal country, so the union, state and local governments all spend on both sectors (p. 67). The institutional map:
| Sector | Key organisations |
|---|---|
| Education | NCERT, UGC, AICTE, plus union and state ministries and departments of education |
| Health | National Medical Commission, ICMR, plus union and state ministries and departments of health |
The textbook analyses the health sector later, in Chapter 8; this chapter therefore analyses education only (NCERT, p. 67).
Education Sector in India: Expenditure, Targets and Gaps
The chapter has no formula sheet, but two ratios play that role (NCERT, p. 68):
- Education expenditure as a percentage of total government expenditure — shows the importance of education in the government’s scheme of things.
- Education expenditure as a percentage of GDP — shows how much of people’s income is committed to education.
Memorise the trend numbers from 1952 to 2020:
| Measure | 1952 | 2020 | What it answers |
|---|---|---|---|
| Education expenditure as % of total government expenditure | 7.92 | 16.54 | How important education is in the government’s agenda |
| Education expenditure as % of GDP | 0.64 | 4.47 | How much of people’s income goes to education |
The rise was irregular — it went up and down — and private and philanthropic spending, if added, would make the totals much higher (NCERT, p. 68).
Structure and per-student spending: elementary education takes the largest share of total education expenditure and tertiary the least, yet expenditure per student is higher in tertiary. Do not conclude that funds should shift: expanding school education needs more teachers trained in higher institutions, so spending at every level must rise (NCERT, p. 68).
State disparity (2020-21): per capita public expenditure on elementary education ranged from Rs 96,968 in Sikkim to Rs 10,710 in Bihar — a gap that produces differences in educational opportunities and attainment across states (NCERT, p. 68).
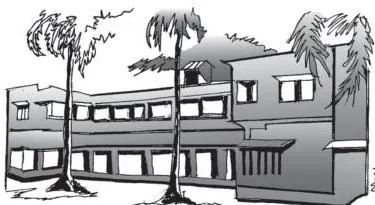
Figure 4.5 makes the policy point visual: investment in educational infrastructure is inevitable — classrooms, laboratories and buildings are the physical base on which human capital is built (NCERT, p. 69).
Targets and turning points:
| Committee or Act | Year | What it set |
|---|---|---|
| Education Commission | 1964-66 | At least 6 per cent of GDP on education for a noticeable rate of growth in educational achievements |
| Tapas Majumdar Committee | 1999 | About Rs 1.37 lakh crore over 10 years (1998-99 to 2006-07) to bring all children aged 6-14 into school |
| Right of Children to Free and Compulsory Education Act | 2009 | Free and compulsory education as a fundamental right for children aged 6-14 |
| Education cess | Current | 2 per cent on all Union taxes, earmarked for elementary education |
Actual spending of a little over 4 per cent of GDP remains below the 6 per cent goal — which is why the chapter calls the current level inadequate and accepts reaching 6 per cent as a must (NCERT, p. 69).
Educational Attainment: Progress, Gender Equity and the Pyramid Problem
Three indicators of educational achievement: adult literacy rate, primary completion rate and youth literacy rate (NCERT, p. 70). The condensed Table 4.2 story (1990 to 2017-18):
| Indicator | 1990 | 2017-18 |
|---|---|---|
| Adult literacy rate, male | 61.9 | 82 |
| Adult literacy rate, female | 37.9 | 66 |
| Primary completion rate, female | 61 | 96 |
| Youth literacy rate, female | 54.2 | 90 |
Education for All is still a distant dream: despite rising rates, the absolute number of illiterates in India is about as large as India’s population at independence. The Constitution’s Directive Principle asked the government to provide free and compulsory education to all children up to age 14 within ten years of 1950 — that target was never met (NCERT, pp. 70-71).
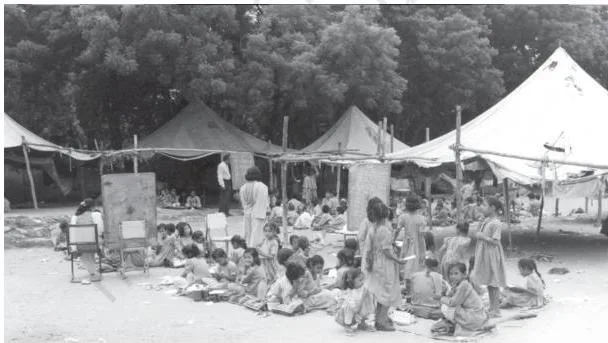
Figure 4.2 — a school run in makeshift premises in Delhi — carries the chapter’s “Look at Fig. 4.2 and discuss” prompts: what are the advantages of a proper classroom? Are the children here receiving quality education? Why do such schools not have buildings? (NCERT, p. 63). Together with Figure 4.5, it links infrastructure to the quality of the human capital being created.
Gender equity — better than before: the male-female literacy gap is narrowing, but women’s education still needs promotion for economic independence, social status, and its favourable effect on fertility rate and the health of women and children (NCERT, p. 71).
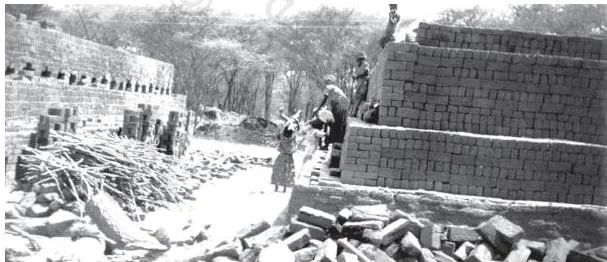
Figure 4.6 shows the channel of loss: school dropouts give way to child labour — a loss to human capital because the investment in each child’s schooling is abandoned before it matures (NCERT, p. 70).
Higher education — few takers, and the educated-unemployment paradox: the Indian education pyramid is steep — fewer and fewer people reach the top. Unemployment is highest among the educated. NSSO 2011-12 data: rural male graduates 19 per cent unemployed, urban male graduates 16 per cent, rural female graduates about 30 per cent — against only about 3-6 per cent among primary-educated youth.
The Periodic Labour Force Survey 2023-24 shows moderate improvement, but the pattern stands (NCERT, p. 71).
The paradox overturns the simple “more education means easier jobs” assumption. The chapter’s answer lies in institutions: increase allocation for higher education and improve its standard, so students are imparted employable skills (NCERT, p. 71).

Figure 4.7, “Higher Education: few takers”, visualises the steep pyramid — the small numbers who continue to the top (NCERT, p. 71).
Reading the Data Like an Economist: Three Worked Examples
This chapter has no formula sheet, but its two expenditure ratios play that role. These three worked examples use original numbers and show how to compute and interpret the chapter’s data. Units are stated at every step.
Worked Example 1: From Education Ratio to a State Education Budget
Scenario: A state has a GDP of Rs 10,00,000 crore and spends 4.5 per cent of GDP on education.
Step 1: Apply the GDP ratio — education budget is 4.5 per cent of GDP:
\[ \frac{4.5}{100} \times 10{,}00{,}000 = 45{,}000\ \text{crore} \]
Step 2: Suppose 60 per cent of the education budget goes to elementary education:
\[ \frac{60}{100} \times 45{,}000 = 27{,}000\ \text{crore} \]
Final answer: The education budget is Rs 45,000 crore, of which elementary education receives Rs 27,000 crore.
Worked Example 2: The Sikkim-Bihar Per-Student Expenditure Gap
Scenario: Per capita public expenditure on elementary education in 2020-21: Sikkim Rs 96,968, Bihar Rs 10,710 (NCERT, p. 68).
Step 1: Divide Sikkim’s figure by Bihar’s:
\[ \frac{96{,}968}{10{,}710} \approx 9.05 \]
Step 2: Interpret the ratio: Sikkim spends about nine times what Bihar spends per elementary pupil.
Conclusion: This gap is the concrete reason for regional differences in educational opportunities and attainment across states (NCERT, p. 68).
Worked Example 3: The Narrowing Male-Female Literacy Gap
Scenario: Adult literacy rates from Table 4.2: male 61.9 per cent in 1990 and 82 per cent in 2017-18; female 37.9 per cent in 1990 and 66 per cent in 2017-18 (NCERT, p. 70).
Step 1: Gap in 1990:
\[ 61.9 – 37.9 = 24\ \text{percentage points} \]
Step 2: Gap in 2017-18:
\[ 82 – 66 = 16\ \text{percentage points} \]
Step 3: Narrowing over the period:
\[ 24 – 16 = 8\ \text{percentage points} \]
Conclusion: The male-female adult literacy gap narrowed by 8 percentage points between 1990 and 2017-18 — the quantitative basis of the chapter’s “gender equity — better than before” argument (NCERT, p. 71).
Reusable interpretation for answers: Table 4.1 shows human capital indicators converging between developing and developed countries while per-capita real income does not — so you cannot claim a simple proof that education causes growth. The evidence is nebulous and causality flows both ways (NCERT, p. 64).
Common Mistakes Students Make in This Chapter
| Mistake | Correct rule | How to check your answer |
|---|---|---|
| “Human capital and human development are the same thing” | They differ on ends vs means — capital uses people to raise output; development treats people as ends (p. 66) | Ask: does this statement treat education as a productivity tool or as a right? |
| “Only education forms human capital” | Five sources: education, health, on-the-job training, migration, information (pp. 60-61) | When asked for sources, list all five, not one. |
| “Physical and human capital are alike because both come from investment” | Both result from conscious investment but differ on six dimensions — especially separability and benefits (p. 62) | Apply the bus test: can the owner be absent while the capital works? |
| “The data proves education causes growth” | Evidence is nebulous; indicators mis-measure quality; causality runs both ways (p. 64) | Can you name both mis-measurement examples and the two-way causality? |
| “Government spends most per student on elementary education” | Elementary gets the largest total share, but per-student spending is higher in tertiary (p. 68) | Separate “share of total expenditure” from “expenditure per student”. |
| “More education automatically means less unemployment” | NSSO shows graduates with higher unemployment than the primary-educated (p. 71) | Quote the graduate versus primary-educated unemployment figures. |
| Mixing up the two expenditure ratios | One is relative to total government expenditure, the other to GDP; they answer different questions (p. 68) | Name what each ratio measures before using it. |
Writing Full-Answer Responses to the Textbook Exercises
This section gives response frameworks for the 20 NCERT exercises (pp. 72-73), grouped by the skill each question tests. Use the chapter’s own vocabulary — external benefit, monopoly power, inseparable from its owner, social process — in every answer.
(a) Definitional one-liners — Q1, Q2, Q6, Q8: definition + one mechanism sentence + an India example. Q1 names the two major sources, which the chapter singles out as education and health (p. 67). Q2 lists the three indicators of educational achievement. Q6 lists all five factors of formation. Q8 explains how education works as an input to development: raised skill, higher income, innovation.
(b) Comparison questions — Q4, Q5, Q11, Q16: point-form comparison plus a one-line conclusion. Q4 uses the ends-versus-means table above. Q5 uses the broader-term logic: human development counts well-being even without any productivity gain, so it is the broader term. Q11 and Q16 trace the growth channels — productivity, innovation, technology absorption — and close with the two-way causality caveat.
(c) Data-based and evidence questions — Q3, Q10, Q12: cite precise figures and name the limits of the indicators. Q3 uses Sikkim (Rs 96,968) versus Bihar (Rs 10,710). Q10 builds the information-source argument: people must spend on labour-market, education and health information to make efficient decisions about the human capital stock. Q12 comments using Tables 4.1 and 4.2, with the nebulous-evidence caveat attached.
(d) “Discuss as a source” — Q9: for each item, follow the chain: what it includes → costs incurred → return → why it counts as investment. Health infrastructure: preventive, curative and social medicine plus clean water and sanitation → a healthy labour supply. Expenditure on migration: transport, higher living cost and psychic cost → higher earnings outweigh the costs.
(e) Policy and opinion questions — Q18, Q19, Q20: give the chapter’s reasons for intervention, acknowledge the counter-side, and close with a clear position. Q18 and Q19 use the four intervention reasons; Q20 argues for fee regulation through the information-asymmetry and monopoly-power argument.
(f) Link-explaining questions — Q7, Q13, Q14, Q15, Q17: state the mechanism, attach the chapter’s vocabulary, and support with one institutional fact or data point. Q7 uses the institutional map (NCERT, UGC, AICTE; National Medical Commission, ICMR). Q13 and Q14 use education → productivity → innovation → technology absorption.
Q15 uses the recovery logic of on-the-job training — firms bind workers for a fixed period to recover enhanced productivity. Q17 lists economic independence, social status, and the favourable effect on fertility rate and family health.
One-Page Revision Recap: Human Capital Formation in India
This block condenses the NCERT’s own Recap (p. 72) and adds the numbers that matter most. If you have one hour, revise from this table and the two comparison tables above.
| Ask yourself | Your answer must include |
|---|---|
| What is human capital? | The stock of skills and productive knowledge in people; built by deliberate investment; educated labour earns more and contributes more to growth |
| Name the five sources | Education, health, on-the-job training, migration, information — “Every Healthy Mind Invests in Training” |
| Core difference between physical and human capital | Tangible vs intangible; separable vs inseparable (bus vs bus-driver); private vs private-plus-external benefits |
| How does human capital drive growth? | Raises productivity, stimulates innovation, absorbs new technologies — but evidence is nebulous and causality runs both ways |
| Human capital vs human development | Means vs ends; in the development view, basic education and health are a right |
| Why must government intervene? | External benefits, long-term irreversible effects, information problems and monopoly power, poverty and citizens’ rights |
| Two expenditure ratios and their 2020 values | 16.54 per cent of total government expenditure; 4.47 per cent of GDP |
| The 6 per cent target, RTE and cess | Education Commission 1964-66; RTE Act 2009 (ages 6-14); 2 per cent education cess on Union taxes |
| Attainment trends | Adult literacy male 61.9 to 82, female 37.9 to 66 per cent (1990 to 2017-18); illiterates about equal to India’s population at independence |
| Educated unemployment | NSSO 2011-12: rural female graduates about 30 per cent vs 3-6 per cent among primary-educated youth |
FAQs: Human Capital Formation in India
Why is the link between human capital and economic growth called ‘nebulous’ in this chapter?
Because the empirical evidence is not clear-cut. The indicators mis-measure: years of schooling, teacher-pupil ratio and enrolment rates do not capture the quality of education, and health spending, life expectancy and mortality rates do not capture true health status.
Table 4.1 adds the puzzle — human capital indicators converge between developing and developed countries while per-capita real income does not — and causality runs in both directions (NCERT, pp. 64-65).
Why is educated unemployment higher than unemployment among less educated people in India?
NSSO 2011-12 data shows the paradox: unemployment among rural male graduates was 19 per cent, urban male graduates 16 per cent, and rural female graduates about 30 per cent, while only about 3-6 per cent of primary-educated youth were unemployed. The chapter’s response is institutional: higher-education institutions must improve their standard so students are imparted employable skills (NCERT, p. 71).
What is the exact difference between human capital and human development?
The means-versus-ends test. Human capital treats education and health as means to raise labour productivity — an investment that does not raise output is called unproductive. Human development treats them as integral to well-being — people are ends in themselves, so welfare gains count even without productivity gains, and every person has a right to basic education and health (NCERT, p. 66).
Why does India need to spend 6 per cent of GDP on education?
The Education Commission (1964-66) recommended at least 6 per cent of GDP so that educational achievements can grow at a noticeable rate. Actual spending of a little over 4 per cent is inadequate against this target; reaching 6 per cent has been accepted as a must (NCERT, p. 69).
Is physical capital more mobile than human capital across countries?
Yes. Physical capital is completely mobile between countries except for artificial trade restrictions — it can even be built through imports. Human capital is not perfectly mobile because movement is restricted by nationality and culture (NCERT, p. 62).
What are the five sources of human capital formation mentioned in the chapter?
Education, health, on-the-job training, migration and information. Education raises future income like a firm’s capital purchase; health keeps the labour supply productive; on-the-job training raises productivity within firms; migration brings higher earnings that outweigh its costs; and information is needed to make and use human-capital investment decisions (NCERT, pp. 60-61).
Reference: NCERT Class 11 Economics textbook, chapter Human Capital Formation in India.
Explore Class 11 Economics Notes
- Class 11 Economics Notes
- Class 11 CBSE Notes
- CBSE Notes for Classes 1 to 12
- Previous: Liberalisation, Privatisation and Globalisation: An Appraisal
- Next: Rural Development
Class 11 Economics on LearnCBSE:
Related chapters:
- Environment and Sustainable Development notes
- Development Experiences of India: a Comparison with Neighbours notes