
These revision notes compress the entire chapter Development Experiences of India: a Comparison with Neighbours (NCERT Class 11 Economics, Indian Economic Development) into the tables, dates and data relationships you actually need for last-minute revision. This page follows the NCERT textbook for the 2026-27 session.
Work through it in order — timeline, the two country paths, the three big data tables, then the worked examples and error traps — and you will have covered every idea the chapter expects you to compare.
In this chapter you are never asked to memorise isolated numbers. Every idea is a comparison: sector shares against workforce shares, one country’s growth path against another’s, and HDI values against the liberty indicators the index leaves out. The structure below follows that logic.
Why This Chapter Compares India with Neighbours
The starting point of the chapter is globalisation: as geographical boundaries lose meaning, developing countries must understand the development strategies of their neighbours, because they compete with each other in the relatively limited economic space of world markets (NCERT, p. 135).
Nations are therefore forming regional and global economic groupings to strengthen their own domestic economies:
- Regional and global groupings: SAARC, European Union, ASEAN, G-8, G-20 and BRICS.
- Why neighbours specifically: a country that understands its neighbours’ policies can judge its own strengths and weaknesses against them; a shared environment also means common economic activities affect human development across the region.
The chapter is a three-way comparison of India with its two largest neighbouring economies — China and Pakistan — under very different political systems (NCERT, p. 135):
- India: the world’s largest democracy, with a secular and deeply liberal Constitution.
- Pakistan: a militarist political power structure.
- China: a command economy that has only recently started moving towards a democratic system and more liberal economic restructuring.
This chapter is part of the Class 11 Economics notes hub, where every unit of Indian Economic Development is covered in the same data-first style.
Three Nations, One Starting Line: A Quick Timeline
All three countries began their development path at almost the same time and followed a similar planned pattern. This single table anchors everything that follows.
| Anchor | India | China | Pakistan |
|---|---|---|---|
| Independence / establishment | 1947 | 1949 (People’s Republic under one-party rule) | 1947 |
| First Five Year Plan | 1951–56 | 1953 | 1956 (now called the Medium Term Development Plan) |
| Plan system today | Followed five-year plans until March 2017 | 14th Five Year Plan (2021–25) | 12th Five Year Development Plan (2018–23) |
| Reforms | 1991 | 1978 | 1988 |
Until the 1980s, all three countries had similar growth rates and per capita incomes (NCERT, p. 136). India and Pakistan also adopted similar strategies — creating a large public sector and raising public expenditure on social development.
Memory device: the reform years 1978, 1988 and 1991 are the most useful dates in the chapter. Link them in geographic order — moving west from China through Pakistan to India gives 1978 → 1988 → 1991, an increase of 10 years, then 3. The order matters: China reformed first, Pakistan a decade later, India last.
China’s Development Path: From Communes to Market Reforms
China’s story splits into two sharply different phases: the Maoist phase (1949–76) and the reform phase that began in 1978 (NCERT, pp. 136–137).
Phase 1: Maoist development (1949–76)
- After 1949, all critical sectors, enterprises and lands operated by individuals were brought under government control.
- Great Leap Forward (1958): a campaign to industrialise on a massive scale — people were encouraged to set up industries in their backyards. A severe drought followed, killing about 30 million people, and Russia withdrew its professionals during conflicts.
- Communes: rural land was cultivated collectively; by 1958 there were 26,000 communes covering almost all the farm population.
- Great Proletarian Cultural Revolution (1966–76): introduced by Mao in 1965; students and professionals were sent to work and learn from the countryside.
Phase 2: Phased reforms from 1978
- Initial phase — agriculture, foreign trade and investment: commune lands were divided into small plots allocated to individual households (for use, not ownership); households kept all income after paying stipulated taxes.
- Later phase — industry: private firms and township and village enterprises (owned and operated by local collectives) were allowed to produce; government-owned State Owned Enterprises (SOEs) were made to face competition.
- Dual pricing: farmers and industrial units bought and sold fixed quantities at government-fixed prices, and the rest at market prices; as production rose, the market’s share of transactions rose too.
- Special economic zones (SEZs) were set up to attract foreign investors.
Keep one appraisal point in mind for later: China’s post-1978 success was built on a pre-reform base (NCERT, p. 144). Education and health infrastructure, land reforms, communal food distribution and small-scale decentralised experimentation all existed before the market reforms.
Pakistan’s Development Path: Policy Swings and Remittances
Pakistan’s path is harder to summarise because its policy direction swung repeatedly. Follow the decades.
| Period | Strategy | Result or feature |
|---|---|---|
| Late 1950s–1960s | Regulated import-substitution industrialisation — tariff protection for consumer-goods manufacturing plus direct import controls on competing imports; the Green Revolution brought mechanisation and public investment in infrastructure in select areas. | Foodgrain production rose; the agrarian structure changed dramatically. |
| 1970s | Nationalisation of capital goods industries. | State control expanded. |
| Late 1970s–1980s | Denationalisation, encouragement of the private sector, financial support from western nations and remittances from the growing outflow of emigrants to the Middle-east. | Growth was stimulated; a conducive climate for new investment was created. |
| 1988 | Reforms initiated. | Marked the reform point of reference. |
| Recent recovery | — | GDP grew 5.5 per cent in 2017-18, the highest of the previous decade; industry grew 4.9 per cent and services 6.2 per cent, while agriculture stayed unsatisfactory (NCERT, p. 146). |
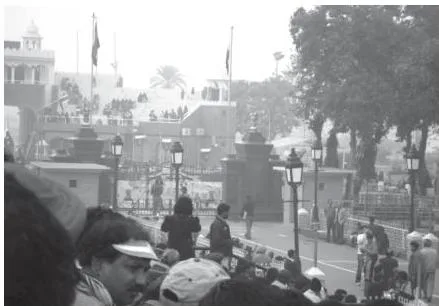
Figure 8.1 is a reminder that this comparison is not purely statistical: the Wagah Border functions both as a tourist site and as a trade link between the two economies (NCERT, p. 137).
Demographic Indicators: Decoding Table 8.1
One useful opener from the chapter: out of every six persons in the world, one is Indian and another Chinese (NCERT, p. 138). Table 8.1 gives the demographic data for 2021–23. Read the table first, then the interpretation below it.
| Indicator | India | China | Pakistan |
|---|---|---|---|
| Estimated population (million) | 1428 | 1411 | 240 |
| Annual growth of population | 0.81 | -0.10 | 1.96 |
| Density (per sq. km) | 473 | 150 | 300 |
| Sex ratio (females per 1000 males) | 930 | 898 | 948 |
| Fertility rate | 2.0 | 1.2 | 3.4 |
| Urbanisation (%) | 36 | 65 | 38 |
Source: World Development Indicators 2024, as cited with NCERT Table 8.1.
Five patterns in this table do most of the answering work (NCERT, p. 138):
- Growth and fertility: Pakistan has the highest population growth (1.96) and the highest fertility (3.4). China has negative growth (-0.10) and the lowest fertility (1.2) — the one-child norm, introduced in the late 1970s, is cited as the major reason.
- Density: China’s density is the lowest (150) even though it is geographically the largest nation; India’s is the highest (473) even though its population (1428 million) is only slightly above China’s (1411 million).
- Sex ratio: biased against females in all three countries (India 930, China 898, Pakistan 948); scholars cite son preference as the common reason.
- Ageing: the one-child norm means China will have more elderly people relative to the young — which is why China now allows couples to have two children.
- Urbanisation: highest in China (65 per cent); India has 36 per cent of its people in urban areas.
One more anchor: Pakistan’s population is tiny by comparison — about one-sixth of China’s or India’s (NCERT, p. 138).
GDP and Sectors: Where Growth Comes From
GDP size and growth
China has the world’s second largest GDP (PPP), at $35 trillion; India’s is $15 trillion and Pakistan’s is $1.5 trillion — roughly 10 per cent of India’s. In ratio form, India’s GDP is about 42 per cent of China’s (NCERT, p. 139).
| Annual GDP growth (%) | 1980–90 | 2015–17 | 2024 |
|---|---|---|---|
| India | 5.7 | 7.3 | 6.5 |
| China | 10.3 | 6.8 | 5.0 |
| Pakistan | 6.3 | 5.3 | 3.1 |
Source: Key Indicators for Asia and Pacific 2025 (Asian Development Bank) and World Development Indicators 2024, as cited with NCERT Table 8.2.
In the 1980s China maintained near double-digit growth, Pakistan was ahead of India, and India was at the bottom. In the later columns, China’s and Pakistan’s growth declined while India recorded a moderate increase; scholars link Pakistan’s decline to its reform processes and long political instability (NCERT, p. 139).
Also notice the change in how output is measured: sectoral GDP is now called Gross Value Added (GVA), the value a sector adds to the economy (NCERT, p. 140).
Sectoral GVA versus workforce
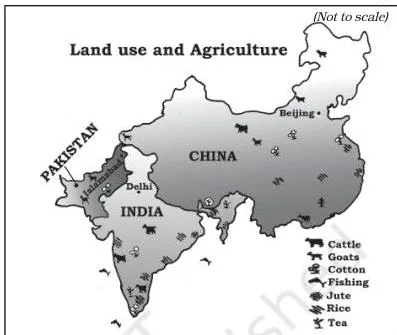
Figure 8.2 shows the land constraint behind the agricultural numbers: because of topography and climate, only about 10 per cent of China’s total land area is suitable for cultivation, and China’s total cultivable area is just 40 per cent of India’s (NCERT, p. 140).
Until the 1980s more than 80 per cent of China’s people depended on farming; the government then encouraged a shift to handicrafts, commerce and transport. The same environment–development link is developed further in the Environment and Sustainable Development notes for Class 11.
| Sector, 2022 | Contribution to GVA (%) | Distribution of workforce (%) | ||||
|---|---|---|---|---|---|---|
| India | China | Pakistan | India | China | Pakistan | |
| Agriculture | 18 | 8 | 24 | 43 | 23 | 36 |
| Industry | 28 | 38 | 21 | 26 | 32 | 26 |
| Services | 54 | 54 | 55 | 31 | 45 | 38 |
Source: World Development Indicators Database 2024; Key Indicators of Asia and Pacific 2025, as cited with NCERT Table 8.3.
Three comparisons stand out (NCERT, p. 141):
- China’s industry contributes 38 per cent of GVA with 32 per cent of the workforce — the strongest industrial engine of the three.
- India’s services contribute 54 per cent of GVA; services are also the largest GVA contributor in all three countries.
- Agriculture’s gap: India’s agricultural workforce (43 per cent) is far larger than its GVA share (18 per cent) — the same mismatch, on a smaller scale, appears in Pakistan (36 per cent vs 24 per cent).
Normal shift versus direct shift
The classical development path runs agriculture → industry → services. China follows it; India and Pakistan shift directly into services (NCERT, p. 141). Table 8.3 shows why: industry’s GVA share is 28 per cent in India and 21 per cent in Pakistan, and the workforce share in industry stayed low at 26 per cent in both.
| Dimension | Classical path — China | Direct shift — India and Pakistan |
|---|---|---|
| Order of the shift | Agriculture → industry → services | Agriculture → services, bypassing industry as the main engine |
| Industry’s role | 38% of GVA, 32% of workforce | 28% / 21% of GVA (India / Pakistan); 26% of workforce in both |
| Services today | 54% of GVA, 45% of workforce | India 54% of GVA / 31% of workforce; Pakistan 55% / 38% |
| Resulting growth driver | Manufacturing plus services | Services alone |
The service workforce data completes the picture: in the 1980s India, China and Pakistan employed 17, 12 and 27 per cent of their workforce in services; by 2022 the figures were 31, 45 and 38 per cent respectively (NCERT, p. 141).
China’s output growth is therefore contributed by manufacturing and services, while India’s is contributed mainly by services; Pakistan showed deceleration in all three sectors over the period (NCERT, p. 142).
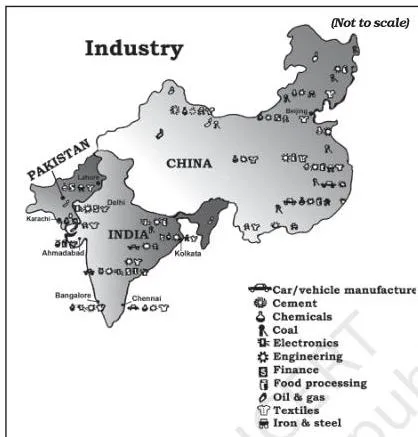
Figure 8.3 shows industry in India, China and Pakistan, alongside the sectoral comparison in the text (NCERT, p. 140).
Human Development Indicators: China Ahead, But the Index Is Incomplete
Table 8.5 compares the three countries on the Human Development Index (HDI) and related indicators for 2017–2023.
| Indicator | India | China | Pakistan |
|---|---|---|---|
| HDI value | 0.685 | 0.797 | 0.544 |
| HDI rank | 130 | 78 | 168 |
| Life expectancy at birth (years) | 72.0 | 78.0 | 67.6 |
| Mean years of schooling (age 15+) | 6.9 | 8.0 | 4.3 |
| GNI per capita (PPP US$) | 9,047 | 22,029 | 5,501 |
| People below poverty line (%) | 21.9* | 0.0** | 21.9** |
| Infant mortality rate (per 1000 live births) | 25.5 | 4.8 | 51 |
| Maternal mortality rate (per 1 lakh births) | 103 | 23 | 154 |
| At least basic sanitation (% of population) | 78 | 96 | 71 |
| At least basic drinking water (% of population) | 93 | 98 | 91 |
| Prevalence of undernourishment (%) | 17 | 3 | 19 |
* India’s poverty figure is for 2019–21; ** China’s and Pakistan’s are for 2023. Sources: Human Development Report 2025; World Development Indicators Metadata 2024, as cited with NCERT Table 8.5.
China is ahead of India and Pakistan on most of these indicators — income, poverty, mortality, sanitation, schooling, life expectancy and nutrition. Three results deserve special attention (NCERT, p. 143):
- Maternal mortality: China loses 23 women per 1 lakh births, India 103 and Pakistan 154. India and Pakistan have not been able to protect women from maternal mortality.
- Poverty: China has the smallest share of poor among the three; China is ahead of India and Pakistan in reducing the proportion below the poverty line; in sanitation, China (96%) is ahead of both India (78%) and Pakistan (71%).
- Drinking water: surprisingly, all three countries report improved drinking water sources for most of their population (91–98 per cent).
Why the HDI alone is incomplete: liberty indicators
The chapter is explicit that these indicators, though extremely important, are not sufficient (NCERT, p. 143). A full assessment also needs liberty indicators — measures of the freedom a society actually gives its citizens.
- One liberty indicator has already been added to the HDI — the extent of democratic participation in social and political decision-making — but it has been given no extra weight.
- Other obvious liberty indicators have not even been introduced yet: the extent of constitutional protection given to citizens’ rights, and the extent of constitutional protection of the independence of the judiciary and the rule of law.
That is the trap to avoid in answers: a country can score well on income, health and education while restricting freedoms. Without giving liberty indicators overriding importance, the construction of the HDI is incomplete and its usefulness limited. The India-specific side of building human capabilities is developed in the Human Capital Formation in India notes.
Appraisal: Why the Three Paths Diverged
Take the initiation of reforms as the point of reference — China 1978, Pakistan 1988, India 1991 — and the verdicts line up (NCERT, pp. 143–146):
| Dimension | China | Pakistan | India |
|---|---|---|---|
| Reform trigger | Own initiative — no compulsion from the World Bank or IMF | Reforms in 1988, in the environment of the World Bank and IMF conditions China avoided | Reforms in 1991; India had to borrow from the IMF and World Bank to set right its balance-of-payments crisis |
| Base before reform | Education and health infrastructure, land reforms, communes, decentralised experimentation | — | — |
| Growth pattern | Manufacturing + services; near double-digit growth in the 1980s | Dependent on good harvests, remittances and foreign loans; overall deceleration | Moderate; service-led |
| Main problems | Lack of political freedom; human rights concerns | Political instability; volatile agriculture; dependence on remittances and foreign loans | India’s largest single workforce share, 43%, still depends on agriculture |
Three appraisal arguments from the chapter are worth reproducing in your own words (NCERT, pp. 143–146):
- China’s pre-reform foundation. The new leadership judged Maoist development a failure — per capita grain output in 1978 was the same as in the mid-1950s. But the pre-reform base (rural health services, communal food distribution, land reforms, small enterprises, experimentation under decentralised government) is what made the post-1978 reforms succeed. Each reform measure was first tested at a small level, then extended on a massive scale.
- Pakistan’s fragile engine. Agricultural growth was based on good harvests rather than institutionalised technical change, so the economy swung with harvest outcomes. Poverty fell from over 40 per cent in the 1960s to 25 per cent in the 1980s and then started rising again — which is why the healthy international poverty-line data does not match official Pakistani data.
- India’s unfinished shift. India performed moderately with democratic institutions, but a majority of its people still depend on agriculture even after seventy years of planned development (NCERT, p. 146).
The chapter’s closing lesson: China’s human development gains owe much to its pre-reform strategy — public intervention in social infrastructure before 1978.
The chapter contrasts this with India and Pakistan, which are attempting to privatise their public sector enterprises; China instead used the market mechanism to create additional social and economic opportunities while retaining collective ownership of land, which ensured social security in rural areas (NCERT, p. 146).
Key Terms at a Glance: From Great Leap Forward to Liberty Indicators
| Term | Meaning | Why it matters |
|---|---|---|
| Great Leap Forward | 1958 campaign to industrialise China on a massive scale, including backyard industries (NCERT, p. 136). | Shows the cost of a rushed, unplanned industrial push. |
| Commune | Rural unit of collective cultivation; 26,000 communes by 1958 covered almost all the farm population (NCERT, p. 136). | The collective base of Maoist agriculture; dismantled into household plots after 1978. |
| Great Proletarian Cultural Revolution | 1966–76 campaign sending students and professionals to work and learn from the countryside (NCERT, p. 136). | Symbol of the Maoist phase’s human cost. |
| Dual pricing | Fixed quantities transacted at government-fixed prices; the rest at market prices (NCERT, p. 137). | How China phased in markets gradually instead of overnight. |
| Special economic zones | Zones set up by China to attract foreign investors (NCERT, p. 137). | The face of China’s open-door reform. |
| State Owned Enterprises (SOEs) | Government-owned enterprises — India’s equivalent is public sector enterprises (NCERT, p. 137). | Made to face competition in the later reform phase. |
| Import-substitution industrialisation | Protecting domestic consumer-goods manufacturing with tariffs and direct import controls (NCERT, p. 137). | Pakistan’s industrialisation route in the late 1950s and 1960s. |
| Green Revolution | Mechanisation plus public investment in infrastructure that raised foodgrain output (NCERT, p. 137). | Transformed Pakistan’s agrarian structure. |
| One-child norm | Late-1970s Chinese policy of one child per couple (NCERT, p. 138). | Arrested population growth; lowered the sex ratio; created ageing pressure; now two children are allowed. |
| Gross Value Added (GVA) | The value a sector adds to output; the current measure of sectoral GDP (NCERT, p. 140). | The basis of every sectoral comparison in Table 8.3. |
| Human Development Index (HDI) | Composite measure of income, health and education, expressed as a value and rank (NCERT, p. 142). | The chapter’s headline human development comparison. |
| Liberty indicators | Measures of democratic participation, constitutional protection of rights, judicial independence and the rule of law (NCERT, p. 143). | The missing dimension that makes the HDI incomplete. |
Key Figures and Data Relationships to Remember
This chapter has no algebraic formulas. The revision anchors are comparison ratios and the structure of the tables. Treat these relationships like formulas:
- India’s GDP (PPP) ≈ 42% of China’s; Pakistan’s GDP ≈ 10% of India’s (NCERT, p. 139).
- Density = population ÷ land area, expressed in people per sq. km — the idea behind Table 8.1’s density column (NCERT, p. 138).
- GVA share vs workforce share: wherever a sector employs more workers than its GVA share, per-worker output in that sector lags — agriculture in all three countries shows this gap.
- China’s land constraint: only about 10 per cent of China’s land is cultivable, and that area equals 40 per cent of India’s cultivable land (NCERT, p. 140).
The data tables are drawn from the World Development Indicators 2024 and Key Indicators for Asia and Pacific 2025, and the human development table from the Human Development Report 2025 — exactly the sources the NCERT notes under each table cite.
Worked Examples: Reading the Data Like an Economist
Both examples below use original calculations from the chapter’s tables. In each, the method is named first, then every step is shown with its units.
Worked Example 1: How Much Denser Is India Than China?
Method: convert absolute densities into a ratio — divide, then interpret the quotient against land and population size.
Step 1: Recall the concept behind Table 8.1’s density column: density = population ÷ land area, in people per sq.
km (NCERT, p. 138).
\[ \text{Density} = \frac{\text{Population}}{\text{Land area}} \]
Step 2: Take the densities from Table 8.1: India 473, China 150, Pakistan 300 people per sq.
km.
Step 3: Divide India’s density by China’s.
\[ \frac{473\ \text{people/sq. km}}{150\ \text{people/sq. km}} = 3.153\ldots \approx 3.2 \]
Step 4: Similarly, Pakistan’s density is exactly twice China’s: 300 ÷ 150 = 2.
Final answer: India’s density is roughly 3.2 times China’s, and Pakistan’s is twice China’s.
The interpretation matters more than the arithmetic: China’s density is the lowest of the three even though it is geographically the largest nation, because its population (1411 million) is spread over a much larger area; India packs a slightly larger population (1428 million) into far less land, producing the highest density (473).
Worked Example 2: Who Shifted to Services Fastest?
Method: work with percentage-point changes — the arithmetic difference between two percentage shares — never with percentage changes of the old share.
- Step 1: Collect the service-sector workforce shares: in the 1980s India 17%, China 12%, Pakistan 27%; in 2022 India 31%, China 45%, Pakistan 38% (NCERT, p. 141).
- Step 2: Subtract the 1980s share from the 2022 share for each country.
\[ \text{India: } 31 – 17 = +14\ \text{percentage points} \]
\[ \text{China: } 45 – 12 = +33\ \text{percentage points} \]
\[ \text{Pakistan: } 38 – 27 = +11\ \text{percentage points} \]
Step 3: Interpret the ranking.
Final answer: China’s shift into services was the fastest (+33 percentage points), India’s was moderate (+14), and Pakistan’s was the smallest (+11). The ranking is deceptive for Pakistan: it started from the highest base (27% in the 1980s, ahead of both India and China) but then lost its lead — by 2022 China (45%) had overtaken it, and Pakistan (38%) stayed ahead of India (31%).
Common Mistakes: Wrong Reform Years, Wrong Sector, Wrong Conclusion
| Mistake | Correct rule | How to check your answer |
|---|---|---|
| Mixing up the reform years — “China 1988, Pakistan 1991”. | China 1978, Pakistan 1988, India 1991 (NCERT, p. 147). | Recite C-P-I: 1978 → 1988 → 1991. |
| Saying China’s growth is service-led, like India’s. | China’s growth comes from manufacturing plus services; only India is service-led (NCERT, p. 142). | Recall Table 8.3: China’s industry is 38% of GVA, the highest of the three. |
| Calling China the most densely populated of the three. | China has the lowest density (150); India’s 473 is the highest (NCERT, p. 138). | Density is population ÷ area — China is geographically the largest. |
| Crediting the 1978 reforms alone for China’s HDI gains. | The gains rest on pre-reform strategy — education, health, land reforms, communes (NCERT, p. 147). | Per capita grain output in 1978 equalled the mid-1950s; reforms did not start from nothing. |
| Reading Pakistan’s healthy international poverty-line data as proof of falling poverty. | Official Pakistani data shows poverty re-emerging; agriculture depended on good harvests rather than technical change (NCERT, p. 144). | Check the trend: over 40% in the 1960s → 25% in the 1980s → rising again. |
| Treating the HDI table as a complete verdict on development. | HDI is incomplete without liberty indicators — participation, constitutional rights, judiciary, rule of law (NCERT, p. 143). | Ask: does the HDI capture freedom? The chapter says it does not. |
Exam Notes: Writing Answers to This Chapter’s Exercises
The chapter’s exercises (NCERT, pp. 148–149) fall into four patterns. Match the pattern and your answer will have the right skeleton.
- Compare-and-contrast (Q9, Q15): answer indicator by indicator or sector by sector. For Q9, line up the sectoral GVA and workforce shares of India and China from Table 8.3 and close with what the pattern indicates — China’s industry-led shift versus India’s direct shift to services. For Q15, take each human development indicator (HDI, life expectancy, schooling, MMR, sanitation) in turn, cite the value for each country, then end with one sentence of significance.
- Explain-and-describe (Q4, Q6): use chronological phases with years. Q4 (Great Leap Forward, 1958) needs the aim, the commune mechanism, and the problems — drought and the withdrawal of Russian professionals. Q6 (Pakistan) walks through import substitution → Green Revolution → nationalisation (1970s) → denationalisation and remittances (late 1970s–80s) → 1988 reforms.
- Do-you-agree (Q5, Q16): state a position, support it with data, then concede a nuance. For Q5, agree that the 1978 reforms explain China’s rapid industrial growth, then add the pre-reform base as the nuance. For Q16, give the 1980–90, 2015–17 and 2024 growth columns for both countries and comment on the reversal — China’s decline from double digits, India’s moderate rise.
- Grouping (Q13): build a three-way table (India | China | Pakistan) and place each feature under the right country. Some features can legitimately sit under more than one head — the mixed economy model, for instance, applies to both India and Pakistan — so show the overlap explicitly rather than forcing an either/or.
Whatever the pattern, a complete answer names its evidence: which table, which values, and which years. Definition questions (Q11, liberty indicators) must give the exact meaning first, then concrete examples. The full chapter, including all exercises, is in the official NCERT textbook PDF for Class 11 Economics on ncert.nic.in.
Revision Summary: Dates and Data Worth Remembering
The NCERT Recap on p. 147 can be reduced to two tables and four takeaway sentences.
Dates that anchor every answer
| Event | India | China | Pakistan |
|---|---|---|---|
| Independence / establishment | 1947 | 1949 | 1947 |
| First Five Year Plan | 1951–56 | 1953 | 1956 |
| Reforms | 1991 | 1978 | 1988 |
Headline data worth quoting
| Indicator | India | China | Pakistan |
|---|---|---|---|
| GDP (PPP) | $15 trillion | $35 trillion | $1.5 trillion |
| GDP growth, 1980–90 | 5.7% | 10.3% | 6.3% |
| GDP growth, 2024 | 6.5% | 5.0% | 3.1% |
| Agriculture workforce share | 43% | 23% | 36% |
| Services GVA share | 54% | 54% | 55% |
| HDI value (rank) | 0.685 (130) | 0.797 (78) | 0.544 (168) |
| Maternal mortality rate (per 1 lakh births) | 103 | 23 | 154 |
Four takeaway sentences:
- China is manufacturing-led; India is service-led; Pakistan depends heavily on agriculture and remittances.
- China’s HDI gains largely reflect its pre-reform strategy — education, health and land reforms before 1978 — not the reform process alone (NCERT, p. 147).
- HDI needs liberty indicators to be complete.
- India’s agriculture still employs the largest workforce share (43%) — the unfinished shift the chapter stresses.
If you are working through the whole syllabus quickly, the Class 11 notes collection groups every subject in one place, and the main CBSE notes library covers all classes.
FAQs: India, China and Pakistan — The Questions Students Ask
Why is China’s population growth negative while India’s is still positive?
China’s one-child norm, introduced in the late 1970s, is cited as the major reason its population growth is low, while India and Pakistan continue with much higher growth (0.81 and 1.96 respectively). China’s fertility rate is 1.2 against India’s 2.0, and its annual growth is -0.10 per cent.
With fewer children, China’s share of elderly is set to rise — which is why the country now allows couples to have two children (NCERT, p. 138).
What are liberty indicators and why does the chapter say HDI is incomplete without them?
Liberty indicators measure the freedom a society gives its citizens. The chapter names three: the extent of democratic participation in social and political decision-making (already added to the HDI but given no extra weight), the extent of constitutional protection of citizens’ rights, and the extent of constitutional protection of the independence of the judiciary and the rule of law.
Without these, the HDI’s usefulness is limited, because a high score on income, health and education can coexist with restricted freedoms (NCERT, p. 143).
Why did Pakistan’s reforms not produce China-like growth?
Pakistan’s agriculture grew on the strength of good harvests rather than institutionalised technical change, so the whole economy swung between good and bad years. Growth also leaned on Middle-east remittances and foreign loans, and long political instability worsened the picture.
The international poverty-line data looks healthy, but official Pakistani data shows poverty re-emerging after a decline to 25 per cent in the 1980s (NCERT, p. 144).
Which sector drives India’s GDP growth, industry or services?
Services. India’s growth is contributed mainly by the service sector, while China’s growth comes from manufacturing and services together. In 2022, services contributed 54 per cent of India’s GVA while employing 31 per cent of the workforce — the largest GVA share of any Indian sector (NCERT, p. 141).
Was the one-child norm only about controlling population, or did it have other effects?
It had major side effects. Besides slowing population growth, it lowered the sex ratio (females per 1000 males) in the context of widespread son preference, and it set up an ageing problem — more elderly people in proportion to the young. That is why China later allowed couples to have two children (NCERT, p. 138).
Reference: NCERT Class 11 Economics textbook (Indian Economic Development), chapter “Development Experiences of India: a Comparison with Neighbours”.
Explore Class 11 Economics Notes
- Class 11 Economics Notes
- Class 11 CBSE Notes
- CBSE Notes for Classes 1 to 12
- Previous: Environment and Sustainable Development
Class 11 Economics on LearnCBSE:
Related chapters:
- Liberalisation, Privatisation and Globalisation: An Appraisal notes
- Human Capital Formation in India notes
- Rural Development notes