
These notes cover the whole of Chapter 6, Basic Principles of Inheritance, from the Class 11 Biotechnology textbook: Mendel’s laws, linkage and crossing over, recombination, sex-linked and extrachromosomal inheritance, polyploidy and reverse genetics — compressed into revision-ready form.
Everything a night-before revision needs is here: definitions, every ratio the chapter expects you to recall, worked examples with original numbers, and guidance on writing the exercise answers. This is a notes page; the step-by-step exercise answers themselves are deliberately left out.
These notes follow the 2026-27 session, and every fact can be verified in the official textbook on the NCERT textbook portal.
The Chapter at a Glance: From Mendel’s Peas to Gene Function
Chapter 6 belongs to Unit III, Genetic Principles and Molecular Processes, which NCERT builds from three chapters (NCERT, p. 145). This chapter states the rules of inheritance; Chapter 7, Basic Processes, explains the molecular machinery behind those rules; Chapter 8, Genetic Disorders, applies them to human disease.
When you need the wider unit, continue with the Basic Processes notes and the Genetic Disorders notes in our Class 11 Biotechnology collection.
Read the chapter in this order — the order a teacher would build it, with the textbook’s own section numbers in brackets:
- Vocabulary: heredity, variation and genetics [6.1].
- The model system: why Mendel chose garden peas [6.1].
- One trait at a time: the monohybrid cross and the test cross → Law of Dominance and Law of Segregation [6.1].
- Deviations from simple dominance: incomplete dominance and codominance [6.1].
- Two traits together: the dihybrid cross → Law of Independent Assortment [6.1].
- Linkage and crossing over: genes on the same chromosome [6.2].
- Recombination: the maize proof and the map-unit rule [6.3].
- Special inheritance patterns: sex-linked inheritance [6.4] and extrachromosomal inheritance [6.5].
- Chromosome number changes: polyploidy and aneuploidy [6.6].
- Gene-function tools: forward and reverse genetics [6.7].
Heredity, Variation and Genetics: Three Terms That Frame the Chapter
Families share facial features, hair colour and skin colour. That is not coincidence: characteristics that run in families have a genetic basis, meaning they depend on genetic information inherited from parents (NCERT, p. 147). Three terms are built from this observation.
| Term | Meaning | Example from the chapter |
|---|---|---|
| Heredity | The transmission of characters from one generation to the next — offspring inheriting parental traits. | Family members resembling each other in facial features, hair colour and skin colour. |
| Variation | The differences between offspring and their parents; offspring are unique even while inheriting. | Siblings of the same parents differ in certain features. |
| Genetics | The study of the scientific facts of heredity and variation. | Everything in this chapter — Mendel’s crosses and their analysis. |
Why biotechnology needs genetics: biotechnology modifies the genetic constitution of organisms to improve human life. You cannot manipulate a trait until you have first identified the genes and their allelic forms that regulate it (NCERT, p. 148). Identifying those genes is precisely what this chapter practises.
Why Mendel Chose the Pea Plant
Mendel was born on 22 July 1822 in Austria and joined the St Thomas Monastery in Brno in 1843, where laboratory facilities turned his attention to research. He chose garden pea (Pisum sativum) as his model because it suited controlled breeding (NCERT, p. 148):
- Annual plant — one generation per season, with data collected over several generations.
- Perfect bisexual flowers — both male and female organs in the same flower.
- Many contrasting pairs of characters to follow.
- Pure lines — self-pollination for several generations fixed each trait.
- Easy controlled crossing — pollen could be transferred with a small brush.
- Large numbers of plants — reliable data over several generations.
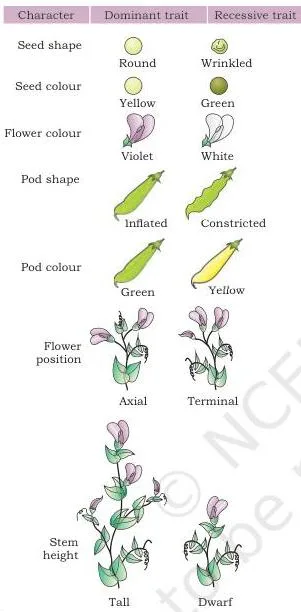
The plate in Fig 6.1 lines up the seven pairs of contrasting traits Mendel selected and kept as pure lines. Several of these pairs appear in the chapter’s crosses: tall versus dwarf stems, red versus white flowers, round versus wrinkled seeds, and yellow versus green seed colour.
Because each cross followed one contrasting pair at a time, the designs are called monohybrid.
Mendel’s results took decades to be recognised. The timeline below is the whole story:
| Year / period | Event |
|---|---|
| 1822 | Gregor Johann Mendel born on 22 July in Austria. |
| 1843 | Began studies as a monk at St Thomas Monastery, Brno, with laboratory access. |
| Nine years | Hybridisation experiments on pea plants; data recorded over several generations. |
| 1866 | Observations published in the Annual Proceedings of the Natural History Society of Brünn — largely ignored. |
| 1884 | Mendel died. |
| 1900 | Work independently rediscovered by Hugo de Vries, Carl Correns and Erich von Tschermak. |
Today he is known as the father of genetics, and his work is treated as the basis of modern genetics (NCERT, p. 146).
The Monohybrid Cross: How the 3:1 Ratio Revealed Two Laws
A cross between parents that differ in a single pair of contrasting characters is a monohybrid cross. Mendel’s first design followed plant height — the simplest possible experiment.
The evidence:
- Pure (homozygous) tall × pure dwarf → F1 all tall; the dwarf phenotype disappeared.
- F1 plants self-pollinated → F2 both tall and dwarf in a \(3:1\) ratio (NCERT, p. 149).
Why: Mendel proposed that each individual has two factors for each character, one inherited from each parent through gametes. F1 plants therefore carry both the tall and the dwarf allele — genotype Tt. Since T masks t, every F1 plant is tall: T is dominant, t is recessive.
Each gene exists in two alternate forms called alleles; two similar alleles (TT or tt) make an individual homozygous, two different alleles (Tt) make it heterozygous.
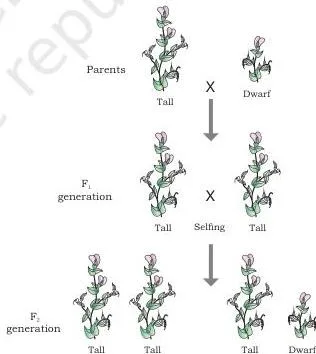
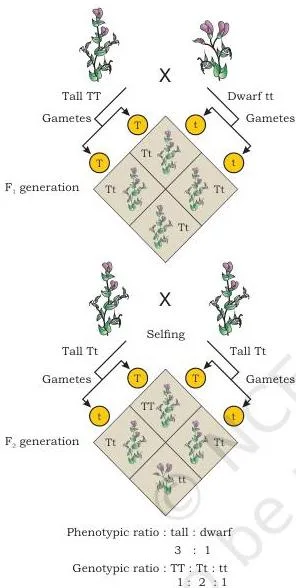
Fig 6.2 is the complete monohybrid cross — parents, gametes, F1 and F2 — and shows where the \(3:1\) actually comes from. Fig 6.3 zooms into the F2: the F1 heterozygotes produce T and t gametes, which combine in a Punnett square into TT, Tt and tt in a \(1:2:1\) genotypic ratio; collapsing by appearance gives the \(3:1\) phenotypic ratio (NCERT, p. 150).
The two laws this cross proves:
- Law of Dominance — of two contrasting characters, one is dominant and the other recessive. It explains why the dwarf trait vanished in F1: the dominant T silenced the effect of t.
- Law of Segregation — alleles of a trait segregate while being inherited. It explains why the dwarf trait reappeared in F2: T and t separated during gamete formation, and two t gametes met again.
The Test Cross: Revealing a Hidden Genotype
The puzzle: can you tell by looking at a tall plant whether it is TT or Tt? No — the phenotype hides the genotype. Mendel’s solution was the test cross: cross the unknown tall plant with a dwarf plant, which is necessarily tt.
- If the tall parent is TT: every gamete passes a T, so all offspring are tall.
- If the tall parent is Tt: half the gametes carry t, so roughly half the offspring are dwarf.
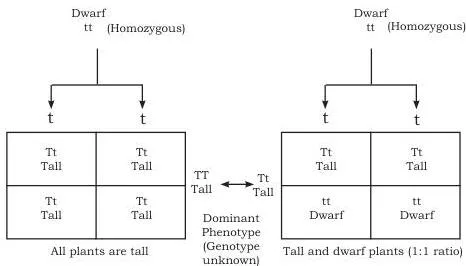
Fig 6.4 diagrams the two possible outcomes of the test cross. An all-tall progeny points to a TT parent; a tall-and-dwarf progeny points to a Tt parent. The cross converts an invisible genotype into a visible offspring ratio.
Incomplete Dominance and Codominance: When the 3:1 Ratio Changes
Incomplete dominance arises when the two alleles of a trait are not related as dominant and recessive: the dominant allele in heterozygous condition has reduced expression, so each allele expresses itself partially. In the four o’clock plant (Mirabilis jalapa), red (RR) × white (rr) gives F1 plants that all bear pink flowers (Rr).
Selfing these pinks gives a \(1:2:1\) ratio of red : pink : white (NCERT, p. 151).
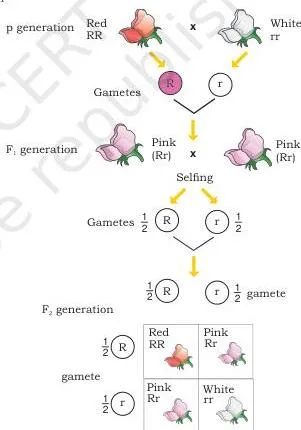
Fig 6.5 tracks the four o’clock cross: red (RR) and white (rr) parents, pink Rr F1, and an F2 of red, pink and white. Notice that here the phenotypic and genotypic ratios are the same, because the heterozygote has its own recognisable colour.
Codominance is the other deviation: both parental alleles are equally and fully expressed in the F1 heterozygote. The chapter gives two examples:
- Roan coat in cattle — pure red (RR) × pure white (WW) gives roan (RW), a permanent mixture of red and white hairs that does not fade with age; both red and white traits are expressed in F1.
- MN blood group in humans — one gene with two alleles, \(L^M\) and \(L^N\), as in the table below (NCERT, p. 152).
| Genotype | Phenotype | Antigen present on red blood cells |
|---|---|---|
| \(L^M L^M\) | M | M |
| \(L^M L^N\) | MN | M and N |
| \(L^N L^N\) | N | N |
The two phenomena are frequently confused. This comparison shows exactly where they part company:
| Feature | Incomplete dominance | Codominance |
|---|---|---|
| What happens in the heterozygote | Each allele is expressed partially | Both alleles are expressed fully |
| Heterozygote appearance | Intermediate: pink flowers | Both traits shown: roan coat, MN blood type |
| F2 ratio after selfing | \(1:2:1\) red : pink : white | No separate ratio — the heterozygote already displays both parental traits |
| Chapter example | Four o’clock plant, Mirabilis jalapa | Roan cattle; MN blood group |
The Dihybrid Cross and the Law of Independent Assortment
Mendel then followed two contrasting pairs at once — a dihybrid cross. He crossed a homozygous round-yellow plant (RRYY) with a homozygous wrinkled-green plant (rryy). All F1 seeds were round and yellow, so round dominates wrinkled and yellow dominates green.
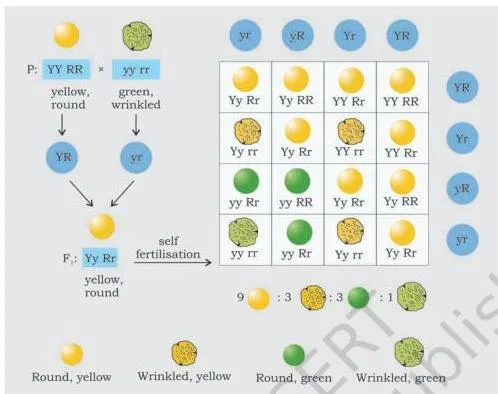
Selfing the F1 (all RrYy) gives the \(9:3:3:1\) spread shown in Fig 6.7: 9 round yellow, 3 wrinkled yellow, 3 round green and 1 wrinkled green (NCERT, p. 152).
The observation that matters: two new combinations appear in F2 — round green and wrinkled yellow. Neither existed in the parents, and they are possible only if the genes for seed shape and seed colour are inherited independently of each other. That is the Law of Independent Assortment: genes controlling a specific trait are inherited independently of other genes.
Memory hooks. First, the \(9:3:3:1\) of a dihybrid is just two monohybrid \(3:1\) ratios multiplied together — a \(3:1\) for shape times a \(3:1\) for colour:
\[ (3:1)\times(3:1)=9:3:3:1 \]
Second, the three laws in order — Dominance, Segregation, Independent assortment — give the initials D-S-I: remember “Do Simple Inheritance”. The order also mirrors the experiments: one trait first (dominance emerges), then that trait’s alleles splitting apart (segregation), then two traits jointly (independent assortment).
Ratios and Symbols: The Working Tools of Inheritance Problems
This chapter has no algebraic formulas. Its working tools are the standard ratios and one map-unit rule. Learn this master table cold:
| Cross | Phenotypic ratio | Genotypic ratio |
|---|---|---|
| Monohybrid selfing \(Tt \times Tt\) | \(3:1\) | \(1:2:1\) |
| Monohybrid test cross \(Tt \times tt\) | \(1:1\) | \(1:1\) |
| Incomplete-dominance selfing \(Rr \times Rr\) | \(1:2:1\) | \(1:2:1\) |
| Dihybrid, independent assortment \(RrYy \times RrYy\) | \(9:3:3:1\) | \(1:2:1:2:4:2:1:2:1\) |
The dihybrid genotypic ratio comes from filling the 16-cell Punnett square of \(RrYy \times RrYy\). The NCERT textbook itself asks you to work this out, so treat the value above as a check on your own square.
Writing symbols and building the square — five conventions:
- Use a letter for each allele: the dominant allele is the capital letter (T), the recessive is the lowercase (t).
- A genotype is two letters written together — TT, Tt or tt — one allele from each parent.
- A gamete carries one allele of each gene: T or t, never Tt, because alleles segregate at gamete formation.
- In a Punnett square, put one parent’s gametes across the top (the columns) and the other parent’s down the left side (the rows); each cell then combines one allele from each parent.
- Count the cells by genotype for the genotypic ratio, then group genotypes that look alike for the phenotypic ratio.
Linkage: When Genes on the Same Chromosome Stay Together
Humans carry 20,000–25,000 protein-coding genes on 23 pairs of chromosomes — meaning every chromosome holds several genes. The chapter now asks: are all the genes on one chromosome inherited together, or independently?
Since several genes sit on a chromosome, meiosis tends to pass them on together. This is linkage — the inheritance of genes together so that the parental combination is retained in the offspring. Three terms ride on it (NCERT, p. 153-154):
- Linked genes — genes on the same chromosome that are inherited together.
- Linked characters — the characters controlled by linked genes.
- Linkage group — all the genes located on a single chromosome.
The sweet pea evidence. Bateson and Punnett crossed red-flowered, long-pollen sweet peas with white-flowered, short-pollen ones. All F1 plants were red-long, so both pairs of alleles were dominant. When F1 was selfed, however, the offspring distribution was peculiar: more than 50% kept the parental combinations (red-long and white-short), while recombinants (red-short and white-long) were less than 50% — a clear deviation from \(9:3:3:1\).
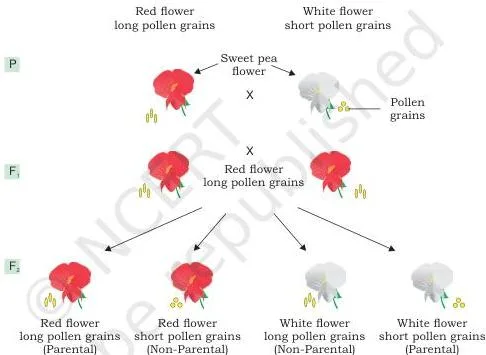
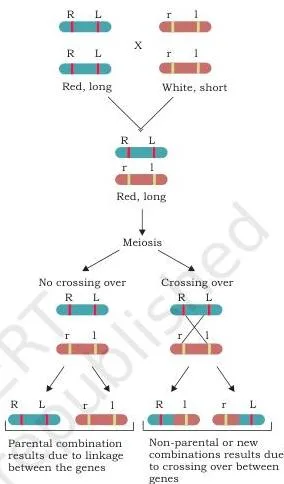
Fig 6.8 records the sweet pea experiment itself — the parental cross, the all-red-long F1, and the shifted F2 that defied \(9:3:3:1\). Fig 6.9 supplies the explanation: R/r and L/l are drawn on the same chromosome, so parental combinations persist unless crossing over breaks them.
Bateson and Punnett could not explain their own results; Morgan’s Drosophila work later provided the answer (NCERT, p. 154).
Crossing Over and Recombination: Where New Combinations Come From
Morgan’s Drosophila experiments turned the linkage story quantitative. His cross, in the textbook’s own symbols:
BBvv (grey body, vestigial wings) crossed with bbVV (black body, long wings) → F1 all BbVv — grey-bodied and long-winged. Crossing F1 females with double-recessive males (bbvv) produced four offspring classes (NCERT, p. 155-156):
- grey vestigial — 41.5%
- grey long — 8.5%
- black vestigial — 8.5%
- black long — 41.5%
That is 83% parental and 17% non-parental combinations. Non-parental offspring can exist only if linked genes sometimes separate — the event being crossing over: the interchange of chromosome segments between non-sister chromatids of homologous pairs during gametogenesis.
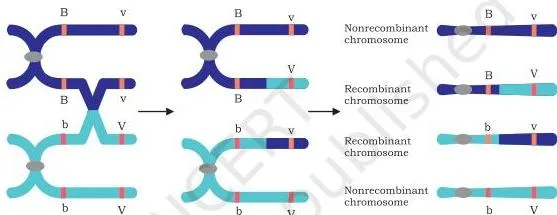
Fig 6.10 shows the physical event: two non-sister chromatids of a homologous pair break and rejoin with the segments swapped — the mechanism behind the 17% non-parental flies.
Recombination is the process by which this exchange of parts of homologous chromosomes takes place during meiosis. Its visible products are the recombinant phenotypes — exactly the red-short and white-long sweet peas that appeared in fewer than half the offspring.
The maize proof. In 1931, Harriet Creighton and Barbara McClintock gave cytological evidence for segment exchange in maize. The two chromosome 9s could be told apart: one was normal, the other carried a heterochromatic knob at one end and a piece of another chromosome at the other end.
They scored kernel markers — coloured (C) versus colourless (c) and starchy (Wx) versus waxy (wx). Recombinant offspring carried only one of the aberrant markers, not both — proof that a physical exchange of chromosome parts had occurred (NCERT, p. 157-158).
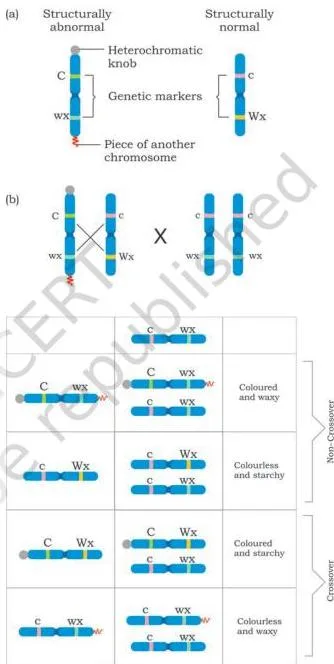
Panel (a) of Fig 6.11 shows the marker chromosomes, and panel (b) the test-cross progeny in their non-crossover and crossover forms. Together they link the visible chromosome marker to the appearance of recombinants.
The map-unit rule — commit this to memory: when two traits recombine in 1% of offspring, they are said to be 1 map unit apart, and 1 map unit = 1 centimorgan (cM) (NCERT, p. 157).
Sex-Linked Inheritance: Morgan’s White-Eyed Fly and Human Disorders
Sex-linked inheritance was introduced by Morgan in 1910 through Drosophila melanogaster. Among his wild red-eyed flies, one white-eyed male suddenly appeared. The cross sequence:
- White-eyed male crossed with a red-eyed female → all F1 red-eyed, both sexes — so the white mutation (w) is recessive to red (W).
- F1 flies mated freely → F2 red : white in \(3:1\), but every white-eyed fly was male; all females were red-eyed.
Morgan concluded that the eye-colour gene lies on the X chromosome (NCERT, p. 159). Such genes — present on sex chromosomes though the character itself has nothing to do with sex — are called sex-linked genes, and their inheritance is sex-linked inheritance.
The pattern makes sense because a male has a single X: a recessive allele on it is always expressed in him, while a female needs two copies.
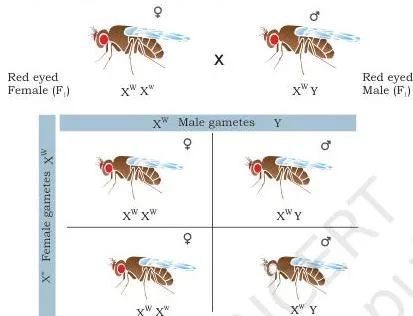
Fig 6.12 charts the crosses just described: the white allele travels on the X, so in F2 the white-eyed flies are exclusively male — the clue that placed the gene on the X chromosome.
Human examples: colour blindness and haemophilia are common sex-linked (X-linked) disorders in humans. The chapter opens the topic with a historical note that haemophilia, the ‘bleeders disease’, was observed only in males in the British royal family (NCERT, p. 158).
Extrachromosomal Inheritance: The Mother’s Cytoplasm Decides
Why the mother dominates this story: before fertilisation, the sperm sheds most of its cytoplasm and cytoplasmic organelles, and only the sperm nucleus enters the egg. The zygote therefore receives the plastid and mitochondrial genomes only from the maternal parent (NCERT, p. 159-160).
Any trait controlled by genes in mitochondrial or plastid DNA therefore does not follow Mendelian principles. Most recorded cytoplasmic traits follow the maternal line, so this phenomenon is also called maternal or uniparental inheritance.
Examples from the chapter:
- Mitochondrial DNA codes for some of the enzymes required for cellular respiration.
- Plastid DNA codes for chlorophyll and other pigments.
- In the four o’clock plant (Mirabilis jalapa), leaves can be white, green or variegated (a mixture of white and green) because of plastid genes.
- Crossing a female green, white or variegated plant with any of those pollen types yields offspring with the female phenotype only.
Contrast this with every earlier cross in the chapter: standard Mendelian ratios assume the two parents contribute nuclear genes equally. For plastid and mitochondrial traits the male contributes nothing observable, so the trait simply tracks the mother.
Polyploidy and Aneuploidy: Extra Chromosome Sets and Their Errors
Ploidy counts the complete chromosome sets in a cell. One complete set is n; most organisms are diploid (2n); organisms with more than two complete sets are polyploids — triploid (3 sets), tetraploid (4), hexaploid (6), octoploid (8), and so on (NCERT, p. 160).
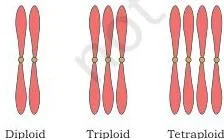
Fig 6.14 lines up chromosomes set by set, showing how polyploidy multiplies whole chromosome sets rather than adding stray chromosomes.
Facts to remember:
- Most species around us are diploid; natural haploidy is rare. In some bees and ants, males are haploid and females diploid.
- Polyploidy is rare in the animal kingdom but very common in plants — more than 30% of plants are polyploid.
- Polyploid plants typically have larger leaves and cells, and they tolerate harsh environmental conditions better.
| Plant | Total chromosomes | Chromosomes in one set (X) | Ploidy level |
|---|---|---|---|
| Rice | 24 | 12 | Diploid |
| Sorghum | 20 | 10 | Diploid |
| Banana | 22 or 33 | 11 | Diploid or triploid |
| Apple | 34 or 51 | 17 | Diploid or triploid |
| Peanuts | 40 | 10 | Tetraploid |
| Cotton | 52 | 13 | Tetraploid |
| Potato | 48 | 12 | Tetraploid |
| Wheat | 42 | 7 | Hexaploid |
| Strawberry | 56 | 7 | Octoploid |
| Sugarcane | 80 | 10 | Octoploid |
Table 6.1 (NCERT, p. 161) reads as total ÷ chromosomes per set = number of sets. Wheat: 42 chromosomes in sets of 7 → 6 sets → hexaploid. Strawberry: 56 in sets of 7 → 8 sets → octoploid.
Aneuploidy is a different error. An aneuploid organism has one or more chromosomes of a set missing or present in extra copies — an incomplete set. Aneuploidy usually results from irregular meiotic division that distributes chromosomes unequally to the opposite poles.
Do not mix the two: polyploidy adds or removes whole sets of chromosomes; aneuploidy adds or removes single chromosomes. Wheat’s extra complete sets make it a healthy polyploid; a single unbalanced chromosome from a meiotic error makes an aneuploid.
Forward and Reverse Genetics: Two Directions to a Gene’s Function
The chapter closes by contrasting two research directions (NCERT, p. 161-162).
Forward genetics begins with phenotypic variation in a population: macro-variations such as size, shape and number of body organs, or micro-variations in DNA sequence, protein profiles and metabolites. The goal is to identify the DNA sequences or genes that regulate those variations.
Reverse genetics begins with a DNA or protein sequence of unknown function. The candidate gene is selected, disrupted, and the effect on the organism’s development is analysed.
Techniques named in the chapter:
- RNA interference (RNAi) — small double-stranded RNA molecules silence the gene or inhibit its expression or translation.
- Targeted gene disruption by homologous recombination — the candidate gene is replaced or broken at its own chromosome location.
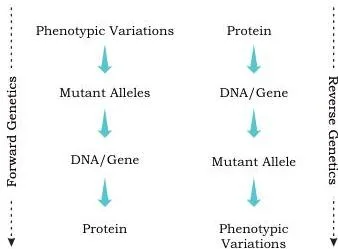
Fig 6.15 places the two directions side by side: forward genetics travels from observed variation to the responsible gene; reverse genetics travels from an anonymous sequence, through experimental disruption, out to the phenotypic outcome.
Why reverse genetics is needed: whole-genome sequencing has identified enormous numbers of genes, but the functions of only a few are known, and not every gene produces a visible variation. Reverse genetics is the route to characterise those genes of unknown function. In short: forward genetics finds the genes behind visible phenotypes; reverse genetics finds the phenotype behind a sequence.
Worked Examples: Applying the Crosses Step by Step
Three problems with original numbers, each following the method the chapter’s exercises expect. No step is skipped.
Example 1: A Monohybrid Punnett Square with Two Heterozygotes
Method: monohybrid Punnett square, using the chapter’s red/white flower vocabulary (R dominant, r recessive).
- Step 1: Parents are both heterozygous: Rr × Rr.
- Step 2: Gametes — each parent forms R and r in equal numbers (one allele per gamete).
- Step 3: Fill the two-by-two square, with one parent’s gametes across the top and the other’s down the left:
| R | r | |
|---|---|---|
| R | RR | Rr |
| r | Rr | rr |
- Step 1: Genotypic ratio — RR : Rr : rr = 1 : 2 : 1.
- Step 2: RR and Rr are both red, so the phenotypic ratio is 3 red : 1 white.
\[ \frac{3}{4}\times 120=90 \text{ red};\quad \frac{1}{4}\times 120=30 \text{ white} \]
Final answer: in 120 offspring, expect 90 red and 30 white plants.
What this tells us: the \(3:1\) phenotypic split from a selfed heterozygote is the signature of dominance with segregation — the same logic Mendel used for tall and dwarf.
Example 2: A Test Cross with an Unknown Tall Parent
Method: test cross — cross the unknown tall pea with a dwarf (tt) and read the offspring.
- Step 1: Unknown tall plant (T_) crossed with a dwarf (tt).
- Step 2: If the parent were TT, every gamete would pass T and all offspring would be tall.
- Step 3: Observed: out of 46 offspring, 24 are tall and 22 are dwarf — almost exactly a \(1:1\) split.
- Step 4: A \(1:1\) split can happen only if the tall parent sometimes passes t → the parent’s genotype is Tt.
Final answer: the tall parent was heterozygous (Tt).
What this tells us: dwarf offspring appeared only because the tall parent carried a hidden recessive allele — exactly what a test cross is designed to expose.
Example 3: From Recombination Percentage to Map Units
Method: convert recombination frequency to map distance using the rule 1% recombination = 1 map unit = 1 cM.
- Step 1: A maize test cross produces 210 offspring.
- Step 2: Of these, 25 are recombinant types.
\[ \text{Recombination frequency}=\frac{25}{210}\approx 0.119 \]
Step 3: That is about 11.9% — call it 12%.
Apply the map-unit rule: 1% recombination → 1 map unit → 1 cM.
Step 4: 12% recombination → 12 map units.
Final answer: the two genes are about 12 map units (12 cM) apart on the chromosome.
What this tells us: recombination percentage is a relative distance — the closer two linked genes lie, the smaller the recombinant percentage, so the map distance shrinks.
Common Mistakes in Inheritance Problems — and the Corrections
Six errors students repeat most often, each with the correction and the reason behind it:
| Students write… | Correct is… | Why / how to check |
|---|---|---|
| “The \(3:1\) is the genotypic ratio.” | The phenotypic ratio is \(3:1\); the genotypic ratio is \(1:2:1\). | Count the Punnett cells by genotype first (TT, Tt, tt), then group by appearance for the phenotype. |
| “One gamete is Tt.” | Gametes are T or t separately. | Alleles segregate at gamete formation; every gamete carries one allele of each gene. |
| “Incomplete dominance and codominance are the same thing.” | In incomplete dominance the heterozygote is an intermediate (pink); in codominance both alleles express fully (roan, MN). | Ask: is the heterozygote a blend, or a mixture of both parental traits? |
| “The white-eye gene is on the Y chromosome because all white-eyed flies were male.” | The gene is X-linked. | A male has one X, so a recessive allele on it is always expressed; a female needs two copies — matching the F2 data. |
| “Independent assortment applies to any two genes.” | It holds for genes on different chromosomes; linked genes on one chromosome stay together. | That is exactly why the sweet pea F2 deviated from \(9:3:3:1\). If parental combinations exceed 50%, suspect linkage. |
| “A centimorgan is a physical length.” | 1 cM = 1% recombination frequency — a frequency measure used for mapping. | Convert recombination percent directly to cM; it is not a distance in base pairs. |
How to Answer the Exercise Questions in This Chapter
The chapter’s exercises (NCERT, p. 164-165) test four skills: definitions, cross mechanics, linkage reasoning and open judgement. Every answer must show the working cross, not just the final number. What each question group demands:
| Questions | What a complete answer contains |
|---|---|
| Q1: differentiate (a)–(g) | One-line definition of each term, one contrasting point, then a chapter example. For genotype vs phenotype: genetic make-up versus observable trait — and note that one phenotype (tall) can hide two genotypes (TT or Tt). |
| Q2: ratios for three crosses | For each cross, write parents → gametes → Punnett square before stating the genotypic and phenotypic ratios. |
| Q3: test cross | Draw the two possible Punnett squares in the style of Fig 6.4 — \(TT \times tt\) and \(Tt \times tt\) — and state what each outcome reveals. |
| Q4: explain the three laws | Structure each answer: statement of the law → parental cross → F1 result → F2 ratio → conclusion that the ratio supports the law. Use a monohybrid cross for dominance and segregation, a dihybrid cross for independent assortment. |
| Q5: tomato cross | Assign symbols to the dominant traits first, write both parental genotypes, then their gametes, then the square. State both genotypic and phenotypic ratios — the working method is the answer. |
| Q6: linkage detection | Explain that deviation from the expected ratio detects linkage, and the percentage of recombinant offspring measures its degree. |
| Q7: is linkage absolute? | Answer no — crossing over during meiosis breaks parental combinations, as Morgan’s 17% non-parental offspring showed. |
One Page Revision Summary
The entire chapter in one table — read it alone the night before your class test and you have the structure; come back to the sections above for any row that feels thin.
| Law / principle | What it says | Key cross or evidence | Ratio or key number |
|---|---|---|---|
| Law of Dominance | Of two contrasting characters, one is dominant, the other recessive. | Pure tall crossed with pure dwarf → F1 all tall. | \(3:1\) in F2 |
| Law of Segregation | Alleles of a trait segregate while being inherited. | F1 Tt selfed → TT, Tt, tt. | Genotypic \(1:2:1\) |
| Law of Independent Assortment | Genes controlling a trait are inherited independently of each other. | Dihybrid cross, RRYY with rryy. | \(9:3:3:1\) |
| Incomplete dominance | Each allele is partially expressed in the heterozygote. | \(RR \times rr\) in the four o’clock plant. | F2 \(1:2:1\) red : pink : white |
| Codominance | Both alleles are fully expressed in the F1 heterozygote. | Roan cattle; MN blood group. | Heterozygote shows both traits |
| Linkage | Genes on the same chromosome are inherited together, retaining parental combinations. | Bateson-Punnett sweet pea; Morgan’s Drosophila. | 83% parental in Morgan’s cross |
| Crossing over / recombination | Exchange of segments between non-sister chromatids during gametogenesis. | Morgan’s F1 females crossed with bbvv males; Creighton-McClintock maize. | 17% non-parental |
| Sex-linked inheritance | A recessive gene on the X chromosome is expressed in males, who have one X. | White-eyed Drosophila; colour blindness and haemophilia. | \(3:1\), all white-eyed flies male |
| Extrachromosomal (maternal) inheritance | Mitochondrial and plastid genes pass only from the mother. | Mirabilis jalapa leaf colour. | Offspring match the female parent |
| Polyploidy vs aneuploidy | Whole extra chromosome sets vs single missing or extra chromosomes. | Crop plants of Table 6.1. | Wheat 42 = 6 sets; strawberry 56 = 8 sets |
| Forward vs reverse genetics | Phenotype → gene vs sequence → function. | RNAi; targeted gene disruption by homologous recombination. | No ratio — a direction of study |
Numbers to remember:
- Monohybrid: phenotypic \(3:1\), genotypic \(1:2:1\); test cross \(1:1\).
- Dihybrid with independent assortment: \(9:3:3:1\).
- Incomplete dominance F2: \(1:2:1\) red : pink : white.
- Mendel’s laws: Dominance, Segregation, Independent assortment — “Do Simple Inheritance”.
- 1% recombination = 1 map unit = 1 centimorgan (cM).
- Morgan’s cross: 83% parental, 17% non-parental.
Before you finish, skim the worked examples once more. If you are revising other subjects too, the Class 11 notes hub and the full CBSE notes library are organised by class and subject.
Frequently Asked Questions
Why did Mendel choose pea plants for his breeding experiments?
Pea (Pisum sativum) is an annual plant with perfect bisexual flowers and many pairs of contrasting characters. Pure lines could be fixed by self-pollination for several generations, cross-pollination was easy to control with a small brush, and large numbers of plants gave reliable data (NCERT, p. 148).
Why did the dwarf trait disappear in the F1 generation and reappear in F2?
The F1 plants are Tt heterozygotes: the dominant T suppresses the effect of the dwarf allele t, so all F1 plants are tall. In F2, T and t segregated into gametes; when two t gametes combined, tt dwarf plants reappeared (NCERT, p. 149-150). This single observation is what the laws of dominance and segregation explain.
What is the difference between incomplete dominance and codominance?
In incomplete dominance each allele is only partially expressed, so the heterozygote is an intermediate — pink flowers in the four o’clock plant. In codominance both alleles are fully expressed, so the heterozygote shows both parental traits at once — roan coat in cattle (mixed red and white hairs) and the MN blood group (both M and N antigens) (NCERT, p. 150-152).
Why did Bateson and Punnett’s sweet pea cross deviate from the 9:3:3:1 ratio?
Because the genes for flower colour and pollen length lie on the same chromosome. Linked genes do not assort independently, so more than 50% of the F2 offspring kept the parental combinations (red-long and white-short), and recombinants were less than 50% (NCERT, p. 156).
Is linkage absolute, or can linked genes get separated?
Linkage is not absolute. Crossing over during meiosis exchanges segments between non-sister chromatids of homologous pairs, separating linked genes and producing non-parental combinations — Morgan’s cross produced 17% non-parental offspring (NCERT, p. 155-156).
How do forward genetics and reverse genetics differ?
Forward genetics starts from phenotypic variation in a population and identifies the genes regulating it. Reverse genetics starts from a DNA or protein sequence of unknown function, disrupts the candidate gene, and analyses the effect on the organism (NCERT, p. 161-162).
Reference: NCERT Class 11 Biotechnology textbook, chapter Basic Principles of Inheritance.
Explore Class 11 Biotechnology Notes
- Class 11 Biotechnology Notes
- Class 11 CBSE Notes
- CBSE Notes for Classes 1 to 12
- Previous: Cellular Processes
- Next: Genetic Disorder
Class 11 Biotechnology on LearnCBSE: