
Need the whole of National Income Accounting in one readable place? These class 12 notes condense Chapter 2 of Introductory Macroeconomics into a rapid-revision format: the circular flow, the three methods of calculating GDP, the full ladder of aggregates, price indices, and the GDP-versus-welfare debate. They follow the rationalised NCERT for the 2026-27 session. Reference: NCERT Class 12 Economics textbook, chapter National Income Accounting.
The Big Idea: One Circular Flow, One GDP, Three Methods
All of national income accounting rests on one picture: a simple economy with only households and firms — no savings, no government, no foreign trade (NCERT, p. 14). Households supply factor services; firms pay for them; households spend that income on the firms’ output; the money keeps circling.
There are four types of factor contributions, each with its own remuneration (NCERT, p. 14):
- Labour → wage
- Capital → interest
- Entrepreneurship → profit
- Land (fixed natural resources) → rent
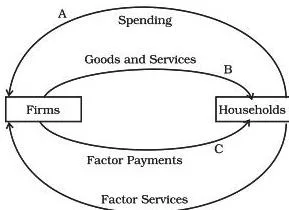
Read the two pairs of arrows in Fig. 2.1 (NCERT, pp. 15-16). The top pair is the goods and services market: spending flows from households to firms one way, and goods and services flow back the other way. The bottom pair is the factor market: households send factor services to firms, and firms send factor payments back.
Because the same money circulates, you can measure the annual value of production at three points:
- At A — aggregate spending by buyers → the expenditure method.
- At B — aggregate value of final goods and services produced → the product method.
- At C — sum total of all factor payments → the income method.
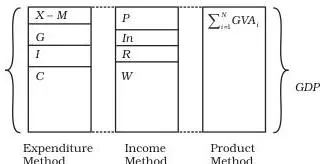
Fig. 2.2 is the chapter’s summary diagram: production, distribution and disposition are three phases of the same circular flow, so all three routes converge on one GDP (NCERT, p. 23). Crucially, adding savings or other complications does not break this — however complex the economy, the annual product estimated by the three methods stays equal (NCERT, p. 16).
Analogy to hold on to: think of a pizza shop. The product method counts the pizzas made; the income method adds every worker’s earnings from making them; the expenditure method adds what buyers paid for them. One pizza, one total, three counting routes — so the three totals cannot disagree.
Basic Concepts: Final Goods, Stocks and Flows, Investment, Depreciation
These definitions are the vocabulary of every formula in the chapter. Learn them in this order.
Final vs intermediate goods — the test is use, not nature
A final good is meant for final use and will not pass through more stages of production or transformation (NCERT, p. 10). An intermediate good is used by producers as material input — it is not a final good.
The classic trap the book uses: tea leaves brewed at home are a final good, but the same tea leaves used in a restaurant are an input sold to customers, so there they are an intermediate good. Goods are not final by nature — by the economic nature of their use.
Likewise, home cooking is not an economic activity (nothing is sold), while identical cooking in a restaurant is (NCERT, p. 10).
Consumption goods, capital goods, consumer durables
- Consumption goods: food, clothing, recreation — consumed when purchased by the ultimate consumer (p. 10).
- Capital goods: durable goods used in production — tools, machines, buildings. They are final goods (not transformed in production) but not ultimately consumed; they enable production for many cycles (p. 10).
- Consumer durables: TV sets, cars, home computers — durable like capital goods, but bought for ultimate consumption (p. 11).
The double-counting trap
The value of final goods already includes the value of the intermediate goods inside them. Counting intermediates separately exaggerates total output — the error of double counting (NCERT, p. 11). This is why the product method uses value added, not total output.
Stocks and flows
A stock is defined at a particular point of time; a flow is defined over a period of time (NCERT, pp. 11-12). Think of the book’s water tank: the water already in the tank is a stock; the water coming from the tap per minute is a flow.
A change in stock is itself a flow — a machine belongs to the capital stock for years, but enters the flow of new machines only in the year it is installed (p. 12).
Investment and depreciation
- Gross investment — the part of final output that consists of capital goods: machines, buildings, infrastructure (p. 12).
- Depreciation — an annual allowance for the ordinary wear and tear of capital (p. 12).
- Net investment = Gross investment − Depreciation — the actual addition to the capital stock (p. 12).
- Economists’ meaning of investment: always capital formation — a gross or net addition to capital stock. Buying shares, property or insurance is not investment in macroeconomics (footnote, p. 12).
- Depreciation is an accounting concept, not a real yearly expense; and it covers only ordinary wear and tear — not accidental destruction or natural calamities (footnotes, p. 13).
One trade-off to remember: producing more capital goods today means fewer consumer goods now, but more of both in the future because workers get more equipment to work with (NCERT, pp. 13-14).
The Three Methods in Detail
1. Product (value added) method
The wheat-bread logic in the book (NCERT, p. 17): farmers produce Rs 100 of wheat and sell Rs 50 to bakers; bakers produce Rs 200 of bread. Adding the two outputs gives Rs 300 — wrong — because Rs 50 of wheat is embedded in the bread. The farmers’ contribution is Rs 100, the bakers’ net contribution is Rs 200 − Rs 50 = Rs 150, and true production is Rs 250.
So for any firm: Value Added = value of production − value of intermediate goods used (p. 17). It is a flow variable.
- Gross Value Added (GVA) includes depreciation/wear and tear; Net Value Added (NVA) = GVA − depreciation (p. 18).
- Inventories: the stock of unsold finished or semi-finished goods or raw materials a firm carries from one year to the next. Inventory is a stock; the change in inventories is a flow. Identity: change in inventories = production − sales (pp. 18-19).
- Planned vs unplanned accumulation or decumulation of inventories: an unexpected fall in sales leaves unplanned unsold stock (unplanned accumulation); an unexpected rise in sales runs down stock (unplanned decumulation) (p. 19).
Here is the book’s formal identity (equation 2.1, NCERT, p. 20):
\[ GVA_i \equiv V_i + \text{change in inventories}_i – Z_i \]
where \(V_i\) is the value of sales, \(Z_i\) the value of intermediate goods used, and sales include exports. All variables are annual flows (p. 20). Summing over all \(N\) firms: GDP ≡ Σ GVA_i (equation 2.2, p. 20). The symbol Σ just means “add up all the firms’ values” — like adding the pocket money of a class of students (p. 20).
Quick numeric check (original numbers): output = 1,000, intermediate goods = 400, depreciation = 80.
- Step 1: Gross value added: \(1000 – 400 = 600\).
- Step 2: Net value added: \(600 – 80 = 520\).
Final answer: GVA = 600, NVA = 520 (units of money per year).
2. Expenditure method
Look at the demand side instead. Final expenditure is spending undertaken for final use, not for intermediate purposes — the baker’s purchase of wheat is excluded (NCERT, p. 21). A firm earns final expenditure from four kinds of buyers:
- C — final consumption expenditure (mostly households);
- I — final investment expenditure on its capital goods (other firms);
- G — government final expenditure (both consumption and investment);
- X — export revenue from abroad.
Aggregate over all firms, subtract imports, and you get the identity (equation 2.4, NCERT, p. 22):
\[ \text{GDP} \equiv C + I + G + X – M \]
Why subtract \(M\)? Imports are already sitting inside \(C\), \(I\) and \(G\) — a car imported and bought by a household is in consumption. Adding \(M\) would count it twice (p. 22). Notice also that investment \(I\) is the most unstable of the five components (p. 22).
3. Income method
The logic in one line: every rupee of sales revenue a firm earns is eventually distributed to the factors of production (NCERT, p. 22). With \(M\) households, GDP is (equation 2.5, p. 22):
\[ \text{GDP} \equiv W + P + In + R \]
where \(W\) = wages and salaries, \(P\) = gross profits, \(In\) = interest payments, \(R\) = rents, summed over all households. (The book’s examples often fold rent and interest into “operating surplus”, so the income side can read as wages + profits — footnote, p. 24.)
Combine all three routes (equation 2.6, NCERT, p. 23):
\[ \text{GDP} = \sum GVA_i = C + I + G + X – M = W + P + In + R \]
Note that \(I\) here includes planned and unplanned investment together (p. 23). This triple equality is exactly what Fig. 2.2 draws.
Factor Cost, Basic Prices and Market Prices
The distinction rests on two kinds of taxes (NCERT, p. 24):
- Production taxes/subsidies — tied to production but independent of the volume of output: land revenue, stamp and registration fees.
- Product taxes/subsidies — paid per unit of output: excise duty, service tax, export-import duties.
The conversion lines are:
\[ \text{GVA at factor cost} + \text{Net production taxes} = \text{GVA at basic prices} \]
\[ \text{GVA at basic prices} + \text{Net product taxes} = \text{GDP at market prices} \]
Why this matters: in its January 2015 revision, the Central Statistics Office (CSO) replaced “GDP at factor cost” as the headline measure. India now reports GVA at basic prices and GDP at market prices (called just GDP) (p. 24). The concept of National Income (NNP at factor cost) still exists, which is why the aggregate ladder below still builds it.
For current context, Table 2.5 shows India’s 2024-25 provisional estimates: GVA at basic prices plus net production taxes gives GDP (NCERT, p. 34).
The Aggregate Ladder: GDP to PDI
Build the chain one rung at a time — each rung has a reason.
- GDP + NFIA = GNP. GDP counts production inside India’s territory whoever earns it. To get what Indian residents earn, add income earned by domestic factors abroad and subtract income earned by foreign factors here — the Net Factor Income from Abroad (NFIA). Example: profits of the Korean-owned Hyundai factory leave India’s GDP (NCERT, p. 25).
- GNP − Depreciation = NNP at market prices (p. 25).
- NNP at market prices − Net Indirect Taxes = National Income, i.e. NNP at factor cost (p. 25). Indirect taxes raise market prices above what factors receive; subsidies do the opposite. National Income = NNP at factor cost — this is the definition to memorise.
- Personal Income (PI): the part of NI received by households. From NI subtract profits the firms kept (undistributed profits), the corporate tax firms pay, and the net interest households pay to firms/government; add transfer payments from government and firms (pensions, scholarships, prizes) (p. 26).
- Personal Disposable Income (PDI): PI − personal tax payments − non-tax payments (such as fines) (p. 26). This is what households can consume or save.
Two more aggregates to recognise (NCERT, pp. 26-27):
- National Disposable Income = NNP at market prices + other current transfers from the rest of the world (gifts, aids). It tells you the maximum goods and services the domestic economy has at its disposal.
- Private Income = factor income from net domestic product accruing to the private sector + national debt interest + NFIA + current transfers from government + other net transfers from the rest of the world.
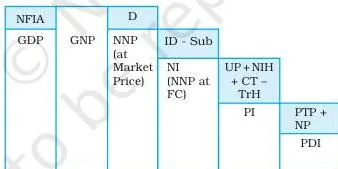
Fig. 2.3 is the ladder as a flow map: read each abbreviation as one rung — GDP → (+NFIA) GNP → (−D) NNP at market prices → (−ID +Sub) NNP at factor cost (National Income) → (−UP −CT −NIH +TrH) Personal Income → (−PTP −NP) Personal Disposable Income (NCERT, p. 26).
The exhaustive reference is Table 2.4’s eleven aggregates (pp. 27-28); a condensed version sits in the revision summary below.
Mnemonic for the six rungs: “Girls Grow Nicely, Never Pick Daisies” — GDP → GNP → NNP → National Income → Personal Income → Disposable Income. The first two both start with G and the next two with N — say them separately, then the P’s.
Worked Examples: Three Fresh Numericals
Example 1 — One economy, three methods, the same GDP
Method used: all three methods applied to the same three-firm chain, to prove the triple equality of equation 2.6.
A farmer produces Rs 600 crore of wheat, selling Rs 400 crore to a flour mill and Rs 200 crore directly to households. The mill sells flour worth Rs 700 crore to a bakery. The bakery sells bread worth Rs 900 crore to households.
Step 1 (Product method): value added by each firm = value of production − intermediate goods used.
- Farmer: \(600 – 0 = 600\)
- Flour mill: \(700 – 400 = 300\)
- Bakery: \(900 – 700 = 200\)
\[ \text{GDP} = 600 + 300 + 200 = 1100\ \text{Rs crore per year} \]
Step 2 (Expenditure method): only final expenditure counts — the household purchases: bread Rs 900 + wheat bought directly Rs 200.
\[ \text{GDP} = 900 + 200 = 1100\ \text{Rs crore per year} \]
Step 3 (Income method): suppose wages total Rs 440 crore and profits total Rs 660 crore across the three firms.
\[ \text{GDP} = 440 + 660 = 1100\ \text{Rs crore per year} \]
Final answer: all three methods give GDP = Rs 1,100 crore per year. The totals agree because the same annual flow is being measured at three points (see Fig. 2.1).
Example 2 — Climbing the aggregate ladder
Method used: the conversion chain from GDP at market prices down to Personal Disposable Income.
Givens: GDP at market prices = Rs 2,000 crore; NFIA = Rs 100 crore; depreciation = Rs 150 crore; net indirect taxes = Rs 120 crore; undistributed profits = Rs 180 crore; corporate tax = Rs 90 crore; net interest paid by households = Rs 40 crore; transfers to households = Rs 75 crore; personal taxes = Rs 120 crore; non-tax payments = Rs 15 crore.
Step 1: GNP at market prices = GDP + NFIA.
\[ 2000 + 100 = 2100\ \text{Rs crore} \]
Step 2: NNP at market prices = GNP − depreciation.
\[ 2100 – 150 = 1950\ \text{Rs crore} \]
Step 3: National Income = NNP at market prices − net indirect taxes.
\[ 1950 – 120 = 1830\ \text{Rs crore} \]
Step 4: Personal Income = NI − undistributed profits − corporate tax − net interest paid by households + transfers.
\[ 1830 – 180 – 90 – 40 + 75 = 1595\ \text{Rs crore} \]
Step 5: Personal Disposable Income = PI − personal taxes − non-tax payments.
\[ 1595 – 120 – 15 = 1460\ \text{Rs crore} \]
Final answer: GNP at market prices Rs 2,100 crore; NNP at market prices Rs 1,950 crore; National Income Rs 1,830 crore; Personal Income Rs 1,595 crore; Personal Disposable Income Rs 1,460 crore.
Example 3 — Real GDP and the GDP deflator
Method used: constant-price valuation and the deflator ratio.
A rice-only economy: in 2023, 200 kg of rice at Rs 40/kg; in 2024, 240 kg at Rs 50/kg. Use 2023 as the base year.
Step 1: Nominal GDP (current prices):
\[ 2023:\ 200 \times 40 = 8000; \quad 2024:\ 240 \times 50 = 12000\ \text{Rs} \]
Step 2: Real GDP for 2024 at base-year (2023) prices:
\[ 240 \times 40 = 9600\ \text{Rs} \]
Step 3: GDP deflator = Nominal GDP ÷ Real GDP × 100.
\[ \frac{12000}{9600} \times 100 = 125\% \]
Final answer: Real GDP for 2024 is Rs 9,600; the deflator is 125%, so the price level rose 25% between 2023 and 2024.
Definition Table
| Term | Meaning | Example |
|---|---|---|
| Final goods | Goods for final use; they leave the active economic flow | Bread sold to a household |
| Intermediate goods | Goods used as inputs in further production | Wheat bought by a baker |
| Consumption goods | Goods and services consumed by their ultimate buyers | Food, clothing |
| Capital goods | Durable goods that enable production but are not transformed by it | Machines, factory buildings |
| Consumer durables | Durable goods bought for ultimate consumption | TV set, car |
| Stock | A variable defined at a point of time | Water already in a tank |
| Flow | A variable defined over a period of time | Water flowing from a tap per minute |
| Gross investment | Total output of capital goods in a year | All machines produced this year |
| Net investment | Gross investment minus depreciation; new capital formation | Machines added to the stock |
| Depreciation | Annual accounting allowance for ordinary wear and tear | One-twentieth of a machine’s value each year |
| Value added | Value of production − value of intermediate goods used | Baker: 200 − 50 = 150 |
| Inventory | Stock of unsold finished, semi-finished goods or raw materials | Unsold shirts at year-end |
| GDP | Market value of all final goods and services produced in the domestic territory in a year | Σ GVA of all firms |
| GNP | GDP + net factor income from abroad | Adding Indians’ earnings abroad, subtracting Hyundai’s profits |
| NNP at market prices | GNP − depreciation | — |
| National Income | NNP at factor cost = NNP at market prices − net indirect taxes | — |
| Personal Income | Income actually received by households | NI − undistributed profits − corporate tax + transfers |
| Personal Disposable Income | PI − personal tax − non-tax payments | Income households can consume or save |
| GDP deflator | Ratio of nominal to real GDP, times 100 | 12,000/9,600 = 125% |
| Externalities | Benefits or harms not paid for or penalised | A refinery polluting a river |
Formulas You Must Know
| # | Formula | What each symbol means | Units |
|---|---|---|---|
| 1 | \( \text{Net Investment} = \text{Gross Investment} – \text{Depreciation} \) | Addition to capital stock after wear and tear | Rs crore per year |
| 2 | \( GVA_i \equiv V_i + \text{change in inventories}_i – Z_i \) | \(V_i\) = sales; \(Z_i\) = intermediate goods used by firm \(i\) | Rs crore per year |
| 3 | \( \text{GDP} \equiv \sum GVA_i \) | Sum of gross value added of all firms | Rs crore per year |
| 4 | \( \text{GDP} \equiv C + I + G + X – M \) | Consumption, investment, government spending, exports, minus imports | Rs crore per year |
| 5 | \( \text{GDP} \equiv W + P + In + R \) | Wages, profits, interest, rents | Rs crore per year |
| 6 | \( \text{GDP} = \sum GVA_i = C + I + G + X – M = W + P + In + R \) | The master identity equalising all three methods | Rs crore per year |
| 7 | \( \text{GNP} = \text{GDP} + \text{NFIA} \) | NFIA = factor income from abroad − factor income paid abroad | Rs crore per year |
| 8 | \( \text{NNP} = \text{GNP} – \text{Depreciation} \) | Net national product at market prices | Rs crore per year |
| 9 | \( \text{NI} = \text{NNP}_{MP} – \text{Net Indirect Taxes} = \text{NDP}_{FC} + \text{NFIA} \) | National Income = NNP at factor cost | Rs crore per year |
| 10 | \( \text{PI} = \text{NI} – \text{UP} – \text{Corporate Tax} – \text{Net Interest by Households} + \text{Transfers} \) | UP = undistributed profits | Rs crore per year |
| 11 | \( \text{PDI} = \text{PI} – \text{Personal Tax} – \text{Non-tax Payments} \) | Disposable income of households | Rs crore per year |
| 12 | \( \text{GDP Deflator} = \frac{\text{Nominal GDP}}{\text{Real GDP}} \times 100 \) | Price level relative to the base year | Ratio (percent) |
| 13 | \( \text{CPI} = \frac{\text{Cost of basket, current year}}{\text{Cost of basket, base year}} \times 100 \) | Cost of a fixed consumer basket | Index (percent) |
| 14 | \( \text{GVA at basic prices} + \text{Net Product Taxes} = \text{GDP at market prices} \) | CSO’s current reporting convention | Rs crore per year |
One-line warning: the symbol ≡ means identity — true by definition, always — unlike =, which holds only for particular values. That is exactly why the three methods cannot disagree (NCERT, p. 18).
Common Mistakes and How to Avoid Them
| What students write or do | The correct version | Why |
|---|---|---|
| “Buying shares is investment.” | Investment in macroeconomics means capital formation — an addition to capital stock. | The economist’s definition excludes buying physical or financial assets (footnote, NCERT, p. 12). |
| “Add up every firm’s total output.” | Sum value added of each firm, not total output. | Total output contains intermediate goods, so adding it causes double counting (p. 11, 17). |
| “Stock and flow are the same thing.” | Stock is at a point of time; flow is over a period. | A change in stock is itself a flow; the water-tank example fixes the idea (p. 12). |
| “GDP = C + I + G + X + M.” | GDP = C + I + G + X − M. | Imports are already inside C, I and G; adding M would count them twice (p. 22). |
| “National Income equals GDP at factor cost.” | National Income is NNP at factor cost. | Go down the ladder: GDP → GNP → NNP at market prices → NNP at factor cost (= NI) (pp. 25-28). |
| “Skipping depreciation when moving from GNP to NNP.” | NNP = GNP − Depreciation. | Wear and tear never becomes anyone’s income, so it must be removed (p. 25). |
| “GDP deflator and CPI are identical.” | They differ in three ways: coverage, imports, and weights. | Consumers’ basket ≠ all goods; CPI includes imports, deflator does not; CPI weights are constant (p. 33). |
| “Writing = where the book writes ≡.” | Use ≡ for identities that hold by definition. | An identity is always true; an equation holds only for particular values (p. 18). |
| “Depreciation covers all capital losses.” | Depreciation covers only ordinary wear and tear. | Accidents, natural calamities and sudden disuse are excluded (footnote, p. 13). |
Exam Notes: How to Attack the Textbook’s Exercises
The chapter’s twelve exercises sit on pages 33-34 of the textbook. Here is the approach for each group — methods, not full solutions.
- Q1 (factors and remunerations): direct recall — name wage, interest, profit and rent for labour, capital, entrepreneurship and land.
- Q2 (final expenditure = factor payments): argue through the circular flow — what firms receive as sales revenue is exactly what they distribute as factor payments.
- Q3 (stock vs flow): use the tank analogy; compare net investment (a flow) with capital (a stock) and connect both to the water example.
- Q4 (planned vs unplanned inventories): contrast unexpected and expected sales outcomes, then write the relation: change in inventories = production − sales.
- Q5 (three identities): write equations 2.2, 2.4 and 2.5 and explain that all measure the same circular flow from different points.
- Q6 (deficits): define budget deficit and trade deficit, then link private investment minus saving with the two deficits.
- Q7-Q9, Q10 (conversion chains): first write the identity connecting the given aggregate to the required one, then substitute. In Q10, track Raju’s income through depreciation, sales tax and income tax to reach GDP, NNP at market price, NNP at factor cost, PI and PDI.
- Q11 (deflator): compute nominal ÷ real; note that when nominal is below real, the price level has fallen since the base year.
- Q12 (GDP and welfare): give the three limitations — distribution, non-monetary exchanges, externalities — each with its direction of bias.
Quick Revision Summary: The Chapter in One Screen
The circular-flow one-liner: firms pay households for factor services; households spend that income on firms’ output — the same money circles, so production, income and expenditure are the same annual total.
The aggregate ladder at a glance
| Rung | How you get there |
|---|---|
| GDP at market prices | Start: final goods produced within domestic territory |
| GNP at market prices | + Net Factor Income from Abroad |
| NNP at market prices | − Depreciation |
| National Income (NNP at factor cost) | − Net Indirect Taxes |
| Personal Income | − Undistributed Profits − Corporate Tax − Net Household Interest + Transfers |
| Personal Disposable Income | − Personal Tax − Non-tax Payments |
| National Disposable Income | NNP at market prices + current transfers from abroad |
| Private Income | Factor income to the private sector + national debt interest + NFIA + current transfers |
The three methods
| Method | What it measures | Formula |
|---|---|---|
| Product | Sum of firms’ net contributions | \( \text{GDP} \equiv \sum GVA_i \) |
| Expenditure | Final spending on domestic output | \( \text{GDP} \equiv C + I + G + X – M \) |
| Income | Total factor payments | \( \text{GDP} \equiv W + P + In + R \) |
Price indices
| Index | What it measures | One caveat |
|---|---|---|
| GDP deflator | Nominal ÷ real GDP, the economy-wide price level | Weights change with production levels |
| CPI | Cost of a fixed consumer basket | Includes imported goods; constant weights |
| WPI (PPI in the US) | Wholesale/bulk transactions | Covers raw and semi-finished goods, not just retail |
Why GDP is not welfare
| Limitation | What GDP misses | Direction of bias |
|---|---|---|
| Distribution | Who actually gets the extra income | GDP can rise while most people lose → overestimates welfare |
| Non-monetary exchanges | Unpaid domestic work, barter | Underestimates GDP, especially in developing countries |
| Externalities | Unpriced harms (negative) or benefits (positive) | Negative externalities → GDP overestimates welfare; positive ones → underestimates |
FAQs: National Income Accounting Doubts, Answered
Why do the product, expenditure and income methods of calculating GDP give the same answer?
Because they measure the same circular flow at three different points (NCERT, pp. 15-16, 23). A rupee of spending at A becomes a rupee of sales revenue for a firm at B, which the firm then distributes as factor payments at C.
The identities \(\text{GDP} \equiv \sum GVA_i = C + I + G + X – M = W + P + In + R\) are versions of the same total; adding savings or other complications does not break the equality (p. 16).
What is the difference between GDP at market prices and national income?
GDP at market prices is the value of final goods produced within domestic territory in a year. National Income is NNP at factor cost: GDP + NFIA − depreciation − net indirect taxes (NCERT, p. 25). So national income is a net concept (after depreciation), it adds income earned abroad by residents, and it removes indirect taxes that never reach the factors of production.
How do you calculate real GDP and the GDP deflator?
Real GDP values the current year’s production at base-year prices; nominal GDP values it at current prices. The deflator is the ratio \(\frac{\text{Nominal GDP}}{\text{Real GDP}} \times 100\), read as the price level relative to the base year (NCERT, p. 29).
In the rice example above, 240 kg at base price Rs 40 gives real GDP Rs 9,600, while nominal GDP is Rs 12,000 — a deflator of 125%, meaning prices rose 25%.
Why are intermediate goods not included in GDP?
Because their value is already embedded in the value of the final goods (NCERT, pp. 10-11). Counting them separately is double counting. Instead, the product method uses value added — production minus intermediate goods — which excludes them automatically (p. 17).
Is GDP a good measure of the welfare of a country?
Not fully. GDP fails on three counts (NCERT, pp. 30-31): its rise may be concentrated among a few (distribution), it ignores unpaid and barter activity (non-monetary exchanges, so GDP is underestimated), and it excludes externalities — a refinery that pollutes a river raises GDP while harming fishermen, so GDP overestimates welfare there.
Reference: NCERT Class 12 Economics textbook, chapter National Income Accounting.
Explore Class 12 Economics Notes
- Class 12 Economics Notes
- Class 12 CBSE Notes
- CBSE Notes for Classes 1 to 12
- Next: Money and Banking
Class 12 Economics on LearnCBSE:
Related chapters:
- Determination of Income and Employment notes
- Open Economy Macroeconomics notes
Official source: download the NCERT textbook free from ncert.nic.in.