
Understanding Data Class 12 notes — that is what this page gives you. Chapter 7 of the NCERT Class 12 Computer Science textbook, condensed into one set of revision notes: what data is, structured vs unstructured data, the collection-to-processing pipeline, and the five statistical measures (mean, median, mode, range and standard deviation), each with its formula and a step-by-step worked example.
These notes follow the 2026-27 session.
Use this page the night before your exam, or as a quick refresh before moving to the database chapters. Read the one-view overview to fix the big picture, then jump to exactly what you need with the contents links below — the formula box, the worked examples, the choose-the-technique decision table, or the common-mistakes table.
Like every page in the CBSE notes library, this one is built for quick, complete revision.
Everything here follows the NCERT Class 12 Computer Science textbook (Chapter 7, pages 97-110).
Understanding Data: The Chapter in One View
The chapter runs on one idea: decisions need data, but raw data alone decides nothing. The path the book builds is \( \text{data} \rightarrow \text{collection} \rightarrow \text{storage} \rightarrow \text{processing} \rightarrow \text{statistics} \rightarrow \text{decision} \).
This chapter supplies the vocabulary (data, datum, attribute, observation, metadata) and the statistical toolkit (the five measures). It also previews later work: page 101 names MySQL, and page 102 introduces the Database Management System (DBMS) as the answer to file-processing limits. For the rest of the book, start from the Class 12 Computer Science notes hub or the Class 12 notes index.
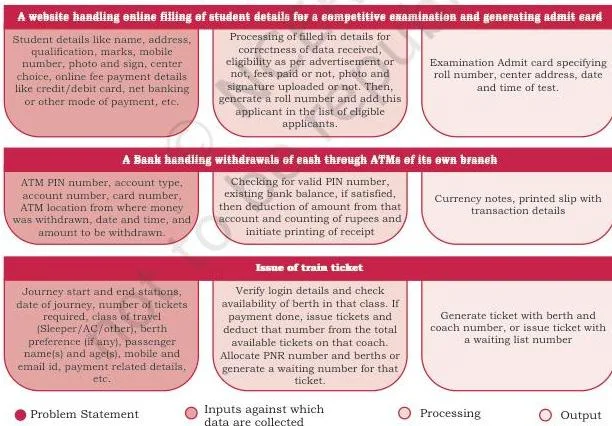
Figure 7.2 shows the same argument as a picture. It lists example tasks, and alongside each task the data it needs, the processing applied, and the output or information generated (NCERT, p. 103). That is the chapter’s whole message in one frame: data in, information out.
What Is Data and Why Does It Need Processing?
Data is a collection of characters, numbers and other symbols that stands for values of situations or variables; the singular of data is datum (NCERT, p. 98). A knowledge base is a store of facts, assumptions and rules that an AI system can use for decision making (NCERT, p. 98).
Data matter because decisions rest on data and their analysis — choosing a college, running a census, coaching a sports team, or maintaining bank accounts all depend on it.
Why not just look at the data? The chapter’s placement example is the test case: a college holds placement records of about 2000 students over the last three years, and reading those rows directly supports no judgment at all. The college processes and analyses the data, then publishes the results in a placement brochure as summaries and visuals (NCERT, p. 98).
The raw rows are data; the brochure’s summary is what a decision can rest on.
Examples of everyday data (NCERT, p. 98):
- Personal details — name, age, gender, contact details
- Transaction data from banking, ticketing and shopping, online or offline
- Images, graphics, animations, audio and video
- Documents and web pages
- Online posts, comments and messages
- Signals generated by sensors
- Satellite data — meteorological, communication, earth observation
Why data are tracked and analysed (NCERT, pp. 98-99):
- ATM withdrawal: the bank must debit the linked account, so account data must be maintained and updated.
- Cyclone and heavy-rain warnings: meteorological offices continuously monitor satellite data.
- Dynamic pricing: airlines and railways set prices from demand-supply relationships; cab apps raise or lower fares with demand (surge pricing).
- Happy hours: restaurants decide when and how much to discount by analysing sales data across time periods.
- EVM results: voting data from all machines are accumulated to declare election results quickly.
- Pharmaceutical trials: companies record data to judge a new medicine’s effectiveness.
- Libraries: book and membership records support the library’s services.
- Search engines: results come from analysing huge volumes of web data — the searching chapter covers how those results are located and ordered.
Structured vs Unstructured Data: Two Families, One Word
On the basis of format, data falls into two broad families (NCERT, p. 99).
| Aspect | Structured data | Unstructured data |
|---|---|---|
| Format | Organised, well-defined, recordable format | No fixed structure or pattern |
| How it is stored | Tabular — rows and columns, as in a spreadsheet or database | Free-form — text documents, web pages, images, audio/video files |
| How a computer reads it | Each column is one attribute; each row is one observation | No row-column structure to query directly |
| Chapter’s canonical example | Table 7.1, the kitchen-inventory table | A newspaper page; the content of an email |
The kitchen-inventory table (Table 7.1) is the model of structured data: columns such as ModelNo, ProductName, Unit Price, Discount and Items in Inventory, with each row one product (NCERT, p. 100). Table 7.2 extends the idea — books at a shop (BookTitle, Author, Price, Year of Publication), school fee deposits and ATM withdrawals are all recorded against fixed attribute sets.
A newspaper page, by contrast, places news items in no fixed pattern, and an email has no rule about lines, paragraphs or attachments — that is unstructured data (NCERT, pp. 100-101).
Quick check: can the data be arranged into rows and columns without losing meaning? If yes, it is structured; if no, it is unstructured. Activity 7.1 has you practise this with Voter ID cards — list the fields such as name and card number, and check whether they are the same for every member of the family (NCERT, p. 100).
Metadata is data about data (NCERT, p. 101). The chapter gives two examples: an email is described by parts such as subject, recipient, main body and attachment, and an image file is described by its size (in KB or MB), its type (JPEG, PNG) and its resolution.
From here the book deliberately concentrates on structured data, since summarisation methods are applied on tabular data (NCERT, p. 104).
Definitions: Key Terms in One Table
The chapter’s load-bearing vocabulary in one place for quick revision.
| Term | Meaning | Example |
|---|---|---|
| Data | A collection of characters, numbers and other symbols representing values of situations or variables | 2000 placement records of a college |
| Datum | The singular of data; one value | One student’s placement row |
| Knowledge base | A store of facts, assumptions and rules an AI system can use for decision making | Rules stored for an AI that shortlists colleges |
| Attribute / characteristic / variable | A parameter; each column of a structured table stands for one | Unit Price in the kitchen-items table |
| Observation | One row of a structured table, covering all attributes of a single item | The row for Water bottle in Table 7.1 |
| Structured data | Data organised in a well-defined, tabular format | Table 7.1 kitchen inventory |
| Unstructured data | Data outside the traditional row-column structure | Newspaper layout; email content |
| Metadata | Data about data | An email’s subject, recipient, body, attachment; an image’s size, type, resolution |
| Data collection | Identifying already available data or gathering it from appropriate sources | Copying a shopkeeper’s diary into a spreadsheet |
| Data storage | Keeping data on storage devices so it can be retrieved later | Saving a CSV file on a pen drive |
| Data processing | Steps applied to data to generate results and output | Filtering student records to build a scholarship list |
| Outlier | An exceptionally large or small value compared with the rest of the data | One 203 cm value in a height list clustered near 100 cm |
Data Collection and Storage: Getting and Keeping Data
Data collection means identifying data that already exist or gathering data from the appropriate sources (NCERT, p. 101). The chapter illustrates this with three situations at a grocery shop (NCERT, p. 101):
- Sales data exist in the shopkeeper’s diary or register — enter them in a digital form, such as a spreadsheet.
- Data already exist digitally, say in a CSV (comma-separated values) file — use them as they are.
- No data have been recorded yet — build software (for example, in Python) that stores and retrieves data from a CSV file or from a database management system like MySQL.
Once data are gathered and processed, we keep them for future use instead of discarding them. Data storage is the process of storing data on storage devices so that data can be retrieved later (NCERT, p. 102). Falling prices of digital storage have made the task easier.
The chapter’s list of devices: Hard Disk Drive (HDD), Solid State Drive (SSD), CD/DVD, tape drive, pen drive, memory card (NCERT, p. 102).
Is it necessary to store data in files before processing? The chapter’s own Think-and-Reflect leaves the question open (NCERT, p. 102). Strictly, you can process data without first saving it — but the workflow the book follows stores data first because collected data are meant to be reused.
And while files can hold data such as school or hospital records, file processing has certain limitations, which a Database Management System (DBMS) overcomes (NCERT, p. 102) — the database concepts chapter explains exactly how.
The Data Processing Cycle: Input, Process, Output
By looking at a vast amount of data, one cannot arrive at a conclusion. Data need to be processed to get results, and only after analysing those results do we make conclusions or decisions (NCERT, p. 103).
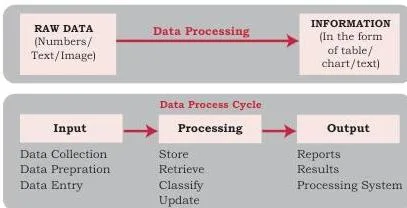
Figure 7.1 lays out these steps. Read it as the cycle every automated system runs: data enters and is stored, stored data are processed, processing produces output, and analysis of that output is what leads to a decision. The chapter summarises the cycle as input and storage of data, its processing, and generating output (NCERT, p. 108).
Automated processing is all around: online bill payment, registration of complaints, and booking tickets all run the same input-store-process-output loop (NCERT, p. 103).
A cooking analogy fixes the idea: raw vegetables are data — nobody can judge a meal from a sack of vegetables. Cooking is processing; the served dish is the information. You judge the dish, not the sack. In the same way, we judge processed output, never raw rows.
So the chapter’s key sentence, re-worded: raw data alone supports no conclusion; processing, followed by analysis of results, is what makes a decision possible.
Formula Box: Five Measures at a Glance
All five measures in one table, with every symbol identified and the unit of the result stated:
| Measure | Formula / rule | What the symbols mean | Unit of result |
|---|---|---|---|
| Mean | \( \bar{x} = \frac{\sum_{i=1}^{n} x_i}{n} \) | \( x_i \) = each value; \( n \) = number of values | same as data (cm, ₹, marks) |
| Median | Sort the values. Odd \( n \): take the middle value. Even \( n \): average the two middle values. | \( n \) = number of values | same as data |
| Mode | The value with the highest frequency | — | any type, even non-numeric |
| Range | \( M – S \) | \( M \) = maximum value; \( S \) = minimum value | same as data |
| Standard deviation | \( \sigma = \sqrt{\frac{\sum_{i=1}^{n} (X_i – \bar{X})^2}{n}} \) | \( X_i \) = each value; \( \bar{X} \) = mean; \( n \) = count; \( \sigma \) = sigma | same as data |
Two points worth remembering. First, the quantity inside the square root, \( \frac{\sum (X_i – \bar{X})^2}{n} \), is the variance — the average of the squared differences. Standard deviation is the square root of the variance.
Second, before squaring, the deviations \( X_i – \bar{X} \) always add up to 0 (give or take rounding): a non-zero sum in your working means a copying or arithmetic slip.
Two mode edge cases to remember: a data set has no mode if every value occurs exactly once, and it can have multiple modes when two or more values share the highest frequency (NCERT, p. 105).
With an even count, the median is the average of the two middle values — a value that may not itself appear in the data (NCERT, p. 105).
Mean, Median and Mode: Measures of Central Tendency
A measure of central tendency is a single value that gives some idea about a whole data set, so you do not have to inspect every value (NCERT, p. 104). The three common measures:
- Mean — the average of the numeric values of one attribute: add all the values and divide by the count. Choose it only when the data have no outliers; the chapter says extreme values should be removed first, or another measure chosen (NCERT, p. 104).
- Median — the middle value once the data are sorted in ascending or descending order; it divides the sorted data into two equal halves (NCERT, p. 104).
- Mode — the value that appears most often in the data of an attribute; it is based on frequency of distinct values and works for numeric as well as non-numeric data (NCERT, p. 105).
An outlier is an exceptionally large or small value compared with the rest of the data. Outliers can distort the average and other statistical calculations, so they are often treated as errors (NCERT, p. 104).
That is why mean and median can disagree: one extreme value pulls the sum-based mean, while the position-based median holds its place — a comparison the chapter asks you to think through on page 105.
The chapter’s own examples use nine height values (in cm): Example 7.1 gives a mean of 101.33 cm, Example 7.2 a median of 102 cm, and Example 7.3 a mode of 110 cm (NCERT, pp. 104-105). The same three measures, computed from fresh numbers, appear in the Worked Examples section below.
Because mode depends on frequency rather than value order, it is the only central-tendency measure available for categorical or non-numeric data — colours, divisions, or products.
Range and Standard Deviation: Measures of Variability
Two data sets can share the same mean, median and mode yet differ completely in spread. Measures of variability, also called measures of dispersion, capture that spread — the degree of diversity within a data set — around the mean (NCERT, p. 105). The chapter’s two measures:
- Range — the maximum value minus the minimum value. It tells the coverage or spread of the data at a glance, but it uses only the two extreme values, so a single outlier badly influences it (NCERT, pp. 105-106). Range works only on numeric data.
- Standard deviation — unlike the range, it uses every value in the data. It is the positive square root of the average of the squared differences of each value from the mean (NCERT, p. 106). The chapter’s height example computes \( \sigma \approx 10.2 \) cm (NCERT, p. 106).
Interpreting \( \sigma \): a smaller standard deviation means the data are less spread out; a larger one means they are more spread out (NCERT, p. 106). Why take a square root at all?
Because the deviations themselves always sum to 0 — squaring them first turns every deviation positive so they can be averaged, and the square root at the end brings the unit back to the data’s own unit.
All five measures side by side — what each answers, which data type it accepts, and how outliers treat it:
| Measure | What it answers | Data type it accepts | How outliers affect it |
|---|---|---|---|
| Mean | the ordinary average | numeric | pulled easily — drop outliers first |
| Median | the middle of the sorted list | numeric | resistant — position-based, the middle stays put |
| Mode | the most frequent value | numeric or non-numeric | unaffected |
| Range | spread between the extremes | numeric | badly affected — only the two extremes are used |
| Standard deviation | spread around the mean, using all values | numeric | affected — every value enters the calculation |
Choosing the Right Technique: A Decision Table
Page 107 prints six problem statements with an empty choose-suitable-statistical-method column. The textbook deliberately leaves the choices open; here is a defensible choice with a one-line reason for each (NCERT, p. 107):
| Problem statement | Suitable technique | Reason in one line |
|---|---|---|
| Disparity in salaries of all employees | Range or Standard Deviation | the question asks about spread, not average |
| Average performance of the whole class in a test | Mean | it asks for the ordinary average of marks |
| Compare height of residents of two cities | Mean | height is numeric and has no serious outliers |
| Find the dominant value from a set of values | Mode | dominant means most frequent |
| Compare income of residents of two cities | Median | income data usually hold extreme values that would pull the mean |
| Find the popular colour for a car after a survey | Mode | colour is non-numeric; the question asks for the most frequent |
Three questions reduce the whole decision to a routine:
- Is the data non-numeric or categorical? If yes, use the Mode.
- Do outliers or extreme values exist? If yes, use the Median — or remove the outliers and use the Mean.
- Does the question need the ordinary average? If yes, use the Mean.
Memory device: “Averages ask for the Mean, middles ask for the Median, and the most repeated answer is the Mode.”
This same choose-and-justify reasoning powers the end-of-chapter exercise — most directly questions 5, 6 and 7, and again in the comparisons of question 10 (NCERT, pp. 109-110).
Worked Examples: Measures Computed Step by Step
Three original data sets with brand-new numbers. Solve each one yourself first, then check against the working below.
Example A: Mean, Median, Mode and Range of Pocket Money
Method: apply the four definitions in order — count, sum, sort, tally.
- Step 1: The pocket money (in ₹) of 9 students is 50, 60, 60, 70, 80, 90, 90, 90, 120, so \( n = 9 \).
- Step 2: Sum of values: \( 50 + 60 + 60 + 70 + 80 + 90 + 90 + 90 + 120 = 710 \).
- Step 3: Mean:
\[ \bar{x} = \frac{710}{9} = 78.9 \]
- Step 1: The values are already ascending, and \( n = 9 \) is odd, so the median is the 5th value: ₹80.
- Step 2: Tally the frequencies: 90 occurs 3 times, 60 occurs twice, all others once.
Mode = 90, that is ₹90.
Step 6: Range: \( 120 – 50 = 70 \), that is ₹70.
Result: mean ₹78.9 (1 d.p.), median ₹80, mode ₹90, range ₹70.
Meaning: the mean (₹78.9) sits below the median (₹80) because the low values pull it down more than the ₹120 value pulls it up — exactly the outlier effect the chapter warns about.
Example B: Median and Range of Runs in Six Matches — an Even Count
Method: sort first; an even count means the median is the average of the two middle values.
Step 1: Runs in 6 matches: 12, 25, 18, 42, 30, 20.
Here \( n = 6 \), an even count.
- Step 1: Sort ascending: 12, 18, 20, 25, 30, 42.
- Step 2: For even \( n \), average the two middle values, 20 and 25:
\[ \text{Median} = \frac{20 + 25}{2} = 22.5 \]
- Step 1: Range: \( 42 – 12 = 30 \) runs.
- Step 2: For reference, the mean is \( \frac{12 + 18 + 20 + 25 + 30 + 42}{6} = \frac{147}{6} = 24.5 \) runs.
Result: median 22.5 runs, range 30 runs, mean 24.5 runs.
Meaning: the even-count median (22.5) is not one of the original scores — that is normal whenever the two middle values differ.
Example C: Mean, Range and Standard Deviation of Seven Heights (σ = 4 cm)
Method: mean first; then deviations, their squares, the average of squares (variance), and the positive square root (standard deviation).
- Step 1: Heights of 7 players (in cm): 150, 152, 154, 156, 158, 160, 162; \( n = 7 \).
- Step 2: Sum = \( 150 + 152 + 154 + 156 + 158 + 160 + 162 = 1092 \), so
\[ \bar{x} = \frac{1092}{7} = 156\ \text{cm} \]
Step 3: Deviations \( X_i – \bar{x} \) and their squares — set out in the same table layout the textbook uses:
| Height (cm) | Deviation from mean | Squared deviation |
|---|---|---|
| 150 | \( -6 \) | 36 |
| 152 | \( -4 \) | 16 |
| 154 | \( -2 \) | 4 |
| 156 | 0 | 0 |
| 158 | \( +2 \) | 4 |
| 160 | \( +4 \) | 16 |
| 162 | \( +6 \) | 36 |
Step 4 (check): the deviations sum to \( (-6) + (-4) + (-2) + 0 + 2 + 4 + 6 = 0 \) — a perfect check.
- Step 1: Sum of squared deviations: \( 36 + 16 + 4 + 0 + 4 + 16 + 36 = 112 \).
- Step 2: Variance (average of the squared deviations):
\[ \frac{112}{7} = 16 \]
Step 7: Standard deviation (positive square root):
\[ \sigma = \sqrt{16\ \text{cm}^2} = 4\ \text{cm} \]
Step 8: Range: \( 162 – 150 = 12 \) cm.
Result: mean 156 cm, standard deviation 4 cm, range 12 cm.
Meaning: a σ of 4 cm against a mean of 156 cm is small — the heights cluster tightly around the mean, and the 12 cm range confirms it at a glance.
Common Mistakes in Data and Statistics
Seven chapter-specific errors, each with the correct rule and a way to check (NCERT, pp. 104-106):
| Mistake | Correct rule | How to check your answer |
|---|---|---|
| Finding the median without sorting the data first | Always sort ascending or descending, then take the middle value (or the average of the two middles) | After sorting, count to the middle: 9 values → 5th; 6 values → between the 3rd and 4th |
| Even count: taking only one of the two middle values | With even \( n \), the median is the average of the two central values | Try 12, 18, 20, 25, 30, 42: median = \( \frac{20 + 25}{2} = 22.5 \), not 20 or 25 |
| Reporting the variance as the standard deviation | Variance is the averaged squared difference; \( \sigma \) is its square root | Variance = \( \sigma^2 \). If the average of squares is 16, then \( \sigma = 4 \) |
| Dividing the sum of squared deviations by \( n – 1 \) | This chapter’s formula divides by \( n \) | Recheck against \( \sigma = \sqrt{\frac{\sum (X_i – \bar{X})^2}{n}} \) — the denominator is \( n \) |
| Trusting the range when an outlier is present | Range uses only the two extremes, so one outlier destroys it; standard deviation, which uses all values, is the safer spread measure | Sort the data and look at the extremes: if one value is far from everything else, prefer \( \sigma \) |
| Writing “mode = 0” when no value repeats | A data set in which every value occurs once has no mode — not a mode of 0 | Tally the frequencies: if every frequency is 1, write “no mode” |
| Skipping the deviation-sign check | The deviations about the mean always sum to 0, give or take rounding | Add up your \( X_i – \bar{X} \) column: a large non-zero total means a copying or arithmetic error |
How to Write Complete Answers to the Textbook Exercises
The exercises on pages 108-110 come in four shapes. Match the shape and you know exactly what a complete answer must contain (NCERT, pp. 108-110).
- Identify data required (Q1, Q4): answer as a bulleted list of fields, then one line classifying each as structured or unstructured. For the e-certificate system (Q1a), the fields would include student name, roll number, class, marks or grade, and certificate number — each structured, because it can sit in a row-column table. Q8 runs on the same idea from the collection side: propose a collection method (for example, rating each student’s skills) and represent the skills as data (for example, a table of skills with scores).
- Describe data processing steps (Q2, Q3): follow the cycle: collect → store → process → output, naming the condition inside “process”. A complete Q2 answer: “Collect each student’s name, class, marks and family income. Store the records in a spreadsheet or database. Process by selecting students with more than 75% marks in two consecutive years and family income below ₹5 lakh per annum. Output the beneficiary list.” For Q3, the results to check after processing are the number of bank accounts per family and the average monthly balance per person.
- Choose and justify a technique (Q5-Q7 and the comparisons of Q10): use the one-line skeleton “Use [technique] because [data type / outliers / what the question asks]”. For the average temperature of a week (Q5a), use the Mean because the values are numeric with no extreme outliers. The reason matters as much as the name.
- Create a dataset and apply techniques (Q10): show the table columns — item, purchase price, sale price, quantity. For comparisons: the difference of means compares purchase price with sale price; the mode or mean identifies the more popular item; the range or standard deviation captures variation in the sale prices of different companies’ fruit juices for the same quantity (ml).
Do not forget that the textbook’s question asks you to justify, not just name — every answer that picks a technique should pair it with a one-line reason.
Quick Revision Summary: From Data to Decision
Use this as your night-before checklist (NCERT, pp. 107-108):
| Measure | Definition in one line | When to reach for it |
|---|---|---|
| Mean | average of all values | numeric data, no outliers |
| Median | middle of the sorted list | outliers present; even count: average of the two middle values |
| Mode | most frequent value | non-numeric data; dominant value |
| Range | maximum minus minimum | quick spread; numeric only; fragile against outliers |
| Standard deviation | spread around the mean, using all values | comparing two groups or data sets |
- Data are unorganised facts; processing and analysing them generates meaningful results (information) — the placement-brochure example.
- Data are structured (rows and columns) or unstructured (no fixed pattern); the book works with structured data.
- Route of the chapter: collect → store → process → output. Storage devices include HDD, SSD, CD/DVD, tape drive, pen drive and memory card.
- The processing cycle is input and storage, processing, then generating output; conclusions come only after analysing the output.
- Summarising data with statistical techniques reveals the characteristics hidden in the data.
- Metadata is data about data; files have limitations that DBMS overcomes.
FAQs on Understanding Data
What is the difference between data and information in this chapter?
Data are unorganised facts; processing and analysing data produces meaningful results, which is what the chapter means by information. The placement example carries the difference: 2000 raw placement rows are data, while the summarised, visualised placement brochure is the information that helps a student choose a college (NCERT, p. 98).
How do you find the median when a data set has an even number of values?
Sort the data, then average the two middle values. In the runs example (12, 18, 20, 25, 30, 42), the two middle values are 20 and 25, so the median is \( \frac{20 + 25}{2} = 22.5 \). The chapter’s rule: with an even count, the median is the average of the two middle values (NCERT, p. 105).
Why is the mean more sensitive to outliers than the median?
Because the mean adds every value into its sum, one extreme value shifts the total; the median depends only on the position of the middle value in the sorted list, so an extreme value at either end leaves it unchanged. The chapter itself asks you to compare the two in a Think-and-Reflect on page 105.
Practical rule: if an extreme value is present, prefer the median, or remove the outlier before averaging (NCERT, p. 104).
What is metadata, and what two examples does the chapter give?
Metadata is data about data. The chapter’s two examples: an email, described by parts such as subject, recipient, main body and attachment; and an image file, described by its size (in KB or MB), its type (for example JPEG or PNG) and its resolution (NCERT, p. 101).
When should I choose the mode instead of the mean or median?
Choose the mode when the data are non-numeric (colour, division, category) or when the question asks for the dominant, most frequent value — such as the popular colour of a car after a survey. The mean and median need numeric values, while the mode is computed from frequency and works on any data type (NCERT, p. 105).
Reference: NCERT Class 12 Computer Science textbook, chapter Understanding Data.
The full chapter text (pages 97-110) can be consulted on the official NCERT textbook portal.
Explore Class 12 Computer Science Notes
- Class 12 Computer Science Notes
- Class 12 CBSE Notes
- CBSE Notes for Classes 1 to 12
- Previous: Searching
- Next: Database Concepts
Class 12 Computer Science on LearnCBSE:
Related chapters:
- File Handling in Python notes
- Queue notes
- Sorting notes
Official source: download the NCERT textbook free from ncert.nic.in.